Review Article: 2020 Vol: 24 Issue: 1
Budgetary Governance and Sustainable Development in Nigeria
Otalor J.I, University of Calabar
Oti P.A, University of Calabar
Abstract
The study examines the relationship between actual expenditure outlays for education, health, infrastructure, social amenities and agriculture and public debt and deficit as indicator of sustainability and the implication for national development in less developed economies like Nigeria. The empirical strategy adopted for estimating the variables specified in the model for this study is the Autoregressive Distributed Lag (ARDL) approach to cointegration. Relying on the progressive theory of public expenditure, the study posits that sustainability may remain at a very low ebb in Nigeria if the vast resources at the disposal of government are not deployed in an enduring manner. The cointegrated test result indicates that in the long run, burgeoning public debt and deficit portend danger for the Nigerian economy as expenditure patterns leads to slow adjustment in fiscal stability. But true to our apriori expectation, the short run 1 result of the study reveals that the coefficient of expenditure on education and infrastructure are positive and significant, indicating that this form of expenditure exerts significant instability in the public debt behaviour over time. However, expenditure on health and agriculture have negative effect on public debt and deficits, suggesting that budget outlay in these sector are not financed through debt and deficits. Apparently, in Nigeria, since 1981, expenditure on education and infrastructure is financed predominantly through public borrowings and budget deficits, implying that budgets for education and infrastructure in Nigeria appears to be at the expense of the unborn generations as supported by the yearly increase in accumulation of public debt. The study recommends that government in Nigeria should watch the rate of accumulation of public debt as it portends danger for the nation especially as the rate of change in expenditure on education and health which has direct impact on the teeming population of youth in the country largely falls short of change in public debt and deficit.
Keywords
Budgetary Governance, Sustainability, Sustainable Development, Well-Being, Future Generations.
Introduction
The main nucleus of sustainability study conducted by the International Monetary Fund centred on concern about the capability of governments in less developed countries to service their debts if capital depletes, currency depreciates, and interest rates soar, thus resulting in a shift in attention from the not too far to the faraway future. Sustainability which is concerned with the effect of current actions on future alternatives seeks to balance the conflicting goals of ensuring a quality life and living within the limits of nature (Chambers et al., 2000).
Sustainability entails sustaining human well-being on a long term basis by minimizing the impact of human activities on the natural environment that ultimately supports that wellbeing (Dietz et al., 2009; Knight & Rosa, 2011). Thus, sustainability is simply another way of seeing “the good life” as an amalgam of a high level of human well-being, as well as high level well-being of the ecosystem upon which it depends. It is all about ensuring a desirable living condition for humans (a society that people want to sustain because it meets their needs), an enduring ecosystem condition including a balance between extant and upcoming generations and within the extant generation (Allen-Prescott, 2001; Elliot, 2006).
Sustainability refers to the action related variant of Sustainable Development (CCE 2007). Sustainable Development entails maintaining equilibrium between the need to improve human lifestyles and well-being and conserving the ecosystem and natural resources, meant to support both present and future generations. Sustainability assessments have two main dimensions: indicators of public debt and deficits, and medium-term fiscal projections (IMF 2002). This study focuses on the public debt and deficit dimension. Fiscal sustainability entails the notion that governments should manage their finances prudently in such a manner that would guarantee future growth. Much of the debate on sustainability and the means to attain sustainable development focuses on the power, and expediency of each of the aspects of sustainability (Knight & Rosa 2011). The four dimensions of sustainability that have been identified are: the capacity of government to settle its financial commitments (Solvency); fiscal policy capable of sustaining economic growth (Growth); the ability of government to settle future financial obligations with extant tax surcharges (Stability); and the competence of government to meet current commitments without transferring the burden to future generations (Fairness). All four responsibilities outlined above should be primarily assigned to government (Heller 2003; Treasury, 2004).
Budgetary governance consists of the processes, structures, institutions and laws put in place to ensure that the budgeting system meets set objectives in an enduring and sustainable manner. The budget which presents estimate of government’s revenue and spending, as well as policy changes provides means of securing control and accountability over public funds. Budgeting constitutes essential bedrock in the trust building process between states and their citizens. Good budget supports, and is in turn supported, by the various pillars of modern public governance: integrity, participation, openness, accountability including strategic approach to planning and achievement of national goals (Schick, 2005). National development can be describes as a collective socio-economic, political as well as religious advancement or the overall development of a nation which can best be achieved through a country’s collection of strategies mapped out by the government-development planning (Lawal & Oluwatoyin, 2011).
Fiscal sustainability remains a challenge for all national governments especially developing economies like Nigeria where spending pressures continues to balloon and as expectations for income transfers or prior commitments become due. The main objective of this paper is to examine the relationship between actual budget performance for education, health, infrastructure, social amenities and agriculture and public debt and deficit as indicator of sustainability and the implication for national development. Consequently, the first objective of this study is to investigate whether expenditure on education affects public debt and deficit as a surrogate of sustainability. The second objective of the paper seeks to investigate how expenditure on health affect public debt and deficit as proxy for sustainability, while the third purpose of the study is to investigate the extent of the effect of expenditure on infrastructure on public debt and deficit which serves as a measure of sustainability in this study. The fourth and fifth objectives of the study investigate the effect of expenditure on social amenities and agriculture respectively on public debt and deficit. These questions are important to national development planners and sustainable development scholars, advocates and practitioners in view of the worrisome level of youth unemployment, the decrepit health system, huge infrastructural gap and moribund education system in Nigeria which calls to question the essence of the yearly budgets operated in the country over the years. To the best of the researchers’ knowledge, no study in Nigeria has examined budgetary governance and sustainability in the dimension taken by this study, thus the study makes a novel contribution to the issue of budgeting, governance and sustainability in Nigeria.
Literature Review and Hypotheses Development
Theory
This study examines the implication of budgetary governance and sustainability on national development. As the economic growth and development of any nation depends on effective implementation of the budget, this research rests on the progressive theory of public expenditure. This theory was proposed by Walker (1930) in attempts to develop a positive budget theory. In the views of Beckett (2002), “Walker’s purpose was to provide a theory based on economic thought, particularly aspects of marginal utility, to be tested through statistical data analysis sufficient to be descriptive and a theory to aid in decisions for allocation of government expenditures”. The progressive philosophy holds the view that a society can only develops and improves with the help of government who is regarded as the agent to bring about this desired change.
Budgeting and Sustainable Development
In the public sector, the budget reflects how government revenue and expenditures are allocated and ensure that expenses are contained within set limits. Budgeting is both an instrument for reflecting the basic goals of government and the means by which the goals are achieved. A sound budgeting system engenders trust among citizens and government, and assures the citizens that government is listening to their concerns, is committed to achieving worthwhile objectives, and is prepared to use the available resources effectively, efficiently and in a sustainable manner (Hackbart & Ramsey, 2002; Schick, 2005). Sustainable development implies conserving an enduring development and avoiding wasteful utilisation of resources. Elliot (2006) asserts that “Sustainable development is fundamentally about reconciling development and the environmental resources on which society depends”. There is no universally agreed definition of sustainable development. However, in 1987, the World Conference on Environment and Development published their report entitled, ‘Our Common Future’ which used the term “sustainable development’ widely and defined it as ‘Development that meets the needs of the present without compromising the ability of future generations to meet their own needs” (WECD, 1987).
Most definitions of sustainable development encompass the idea that there are three interdependent pillars of sustainable development: Environmental, economic and social (Elliot, 2006). An economically sustainable system should be able to generate goods and services on an enduring basis, maintenance of manageable levels of local and external debt, and to obviate severe economic imbalances capable of damaging both industrial and agricultural outputs. For a system to be environmentally sustainable it must maintain a stable resource base devoid of overexploitation of renewable resources or environmental sink functions, and depletion of nonrenewable resources to the extent that investment options are adequately explored. Similarly, a social system should accomplish the goals of fairness in opportunity and distribution including the provision of adequate social and health care services, education, gender equity, accountability and political participation in a sustainable manner (Harris et al., 2001; Holmberg, 1992; Reed, 1997). Knight & Rosa (2011) define sustainability explicitly or impliedly as, striking a balance between societal demands on the environment and social well-being of both current and future generations.
Achieving economic growth while at the same time conserving the quality of the environment in such a way that each reinforces the other has been described as sustainable development. Thus, Sustainable development is maintaining a balance between the human need to enhance lifestyles and feeling of well-being on one hand, and conserving the ecosystems and natural resources on which we and future generations depend (Lee et al., 2000; Potter et al., 2004). Development is something we all desire, hence in the more developed economies; ‘selfdevelopment’ is strongly encouraged including attracting large amounts of money. Opinions about the best ways to achieve our yearnings and needs are supposedly as old as human civilisation. Examining the role of public spending on sustainable growth in Nigeria, Bakare (2012) found that despite the increase in government expenditure between 1975 and 2008, not much was achieved in terms of sustainable growth and therefore concluded that public spending in Nigeria appears to be unproductive and unsustainable as fiscal policy failed to fulfil the desired goals.
Sustainability (Public Debt and Deficit) and Actual Budget Performance for Education
Human capital is predominantly built up through education or training which increases a person’s productivity economically, thus, enabling them to produce more or more valuable goods and services and ultimately earn higher income. Employers, government and employees invest in human capital by devoting time and finance to education and training in order to accumulating knowledge and skills. Governments spend public funds on education because they believe that a better educated population will contribute to faster and more sustainable development. Primary
school attendance helps children to acquire basic literacy and numeracy including other knowledge and skills required for their education and training (Soubbotina, 2004). Moreover, there is a general belief that even poor countries, with inadequate resources to invest in knowledge creation, can “leapfrog” their development efforts provided that they are able to absorb advanced global knowledge and adapt it to meet the needs of their developing economies (CBO, 2003; Crippen, 2003). United Nations Educational, Scientific and Cultural Organizations (UNESCO) recommends that 26 % of annual budget of every nation state should be allocated to education. Thus, globally, it is expected that countries should ensure that annual budget on education should not be less than 26%. In Nigeria, this benchmark has never been achieved in several years. Omagu (2016) reports that public expenditure on education in Nigeria between 1999 and 2013 falls below the minimum standard of 26.0% of annual budget prescribed by UNESCO as shown by the ratio of expenditure on education to total government expenditure which peaked at 13% in 2008 and stood at 8.7% in 2013. Consequently, the hypothesized relationship between budget for education and public debt and deficit is stated thus:
H1: If the Nigerian government fails to increase budgetary allocation to education, the goals of sustainability may not be achieved.
Sustainability (Public Debt and Deficit) and Actual Budget Performance for Health
The health of a country’s population is often mirrored by two key indices: life expectancy at birth and the mortality rate of children below 5 years of age. These statistical indices are also often used among other broad measures of citizen’s quality of life because they indirectly reflect many aspects of the people’s welfare, including the levels of income and nutrition, the quality of the environment, access to health care, safe water, and sanitation (Soubbotina, 2004).
Availability of quality health care facilities is still a big challenge for Nigeria and many other nations in sub-Sahara Africa (Olufemi et al., 2013). Soubbotina (2004) opines that “the average level of public health expenditures in low-income countries is still only 1 percent of GDP compared with 6 percent in high-income countries”. Therefore, the hypothesized relationship between budgets for health and public debt and deficit is stated as follows:
H2: Life expectancy at birth and children mortality rate in Nigeria will remain at a very low ebb if concerted effort is not made by government to address the problem of decrepit health facilities.
Sustainability (Public Debt and Deficit) and Actual Budget Performance for Infrastructure
The quest for development as encapsulated in the millennial development goals is rooted in the global desire to ensure eradication of extreme poverty. In 2015, leaders from 193 countries across the globe created a plan called Sustainable Development Goals (SDGs). It consists of 17 set of goals aimed to rid our world of poverty and hunger and enable safety from the scourge of climate change. Infrastructure is a basic physical and organizational structural elements such as buildings, transport, energy resources, roads, telecommunications, pipe borne water supply, railways, urban transport, ports, waterways, airports and so on that provides a framework that can support the entire structure of development necessary for the operation of a society or organisation, or facilities and services that are essential for enhancing and sustaining the living condition of societies (Omagu, 2016; Usman, 2014). Adenipekun (2013) examined the implementation of MDGs parameters in the rural areas of Atakunmosa West Local Government Area of Osun State using the basic infrastructure available. The goal of the study was to articulate the challenges confronting development in the area and the means of sustaining human development. The study found that the present state of the rural development in AWLGA of Osun state is a clear indication that choices and opportunities for living a decent life within the context of MDGs may not be achieved in Nigeria. There is huge infrastructural facilities deficit in Nigeria, therefore, the relationship between budget for infrastructure and sustainability as measured by public debt is hypothesized as follows:
H3: Huge infrastructure deficit will continue to plague Nigeria as a nation and hamper the achievement of sustainability unless deliberate effort is made by government to confront the problem squarely.
Sustainability (Public Debt and Deficit) and Actual Budget Performance for Social Amenities
Social amenities are things provided by the government to promote the comfort, convenience and social economic well-being of citizens. Social amenities include portable water, sanitation, electricity, sports facilities, housing quality, drainage, cultural and social facilities, recreational facilities (parks) and so on. These amenities must be provided in a financially sustainable manner by ensuring that the amenities are relevant to achieving the desired outcomes, kept in good condition and the provision and maintenance should keep public debt at manageable levels. Citizens’ right include the right to fulfil their potentials through access to quality social amenities and in a safe environment. Social amenities such as play materials and sanitation facilities assists in enhancing the quality of education as it enables children to develop language skills, communication skills, motor skills and increased intellectual capacity (Githaka et al. 2019). Security challenge in Nigeria has worsened since February, 2014 when over 200 school girls were abducted from the female hostel of Government Secondary school in Chibok, North- East Nigeria, many of which are still missing. Moreover, one out of the more than 100 school girls kidnapped on the February 19, 2018 from Dapchi is still missing up to the time of writing this article. In view of the relatively unsafe environment in Nigeria and the non-availability of sufficient social amenities, the study hypothesizes that:
H4: Inadequate expenditure on social amenities in Nigeria will hinder the achievement of sustainability unless government take appropriate steps to address the menace.
Sustainability (Public Debt and Deficit) and Actual Budget Performance for Agriculture
The sustainable development goal number 2 seeks to enthrone zero hunger across the globe by the year 2030. While some countries have made progress in increasing agricultural productivity and reducing the number of undernourished people within their clime, many developing nations including Nigeria are still grappling with the extreme hunger and undernourishment. Malnutrition and acute food insecurity continues to plague most countries in Africa and regions in South America. To resolve this challenge requires both national effort and international cooperation to ensure increased investment in agricultural technology to promote sustainable agriculture, support for small-scale farmers, access to arable land and so on (UNDP 2019). Globally about 821 million people were said to be undernourished as at 2017. With Nigeria ranking 103rd with a Global Hunger Index (GHI) of 31.1 out of the 119 countries evaluated in 2018 and the declaration of the country as the poverty capital of the world, it is not unlikely that a greater percentage of the 821 million malnourished persons are from Nigeria. As the 2018 GHI shows that the level of hunger in Nigeria is serious, the relationship between agriculture and sustainability is proposed as follows:
H5: Self-sufficiency in food production may not be achieved in Nigeria and this may affect sustainability unless government focus adequate attention on agricultural and agricultural value chain.
Methodology
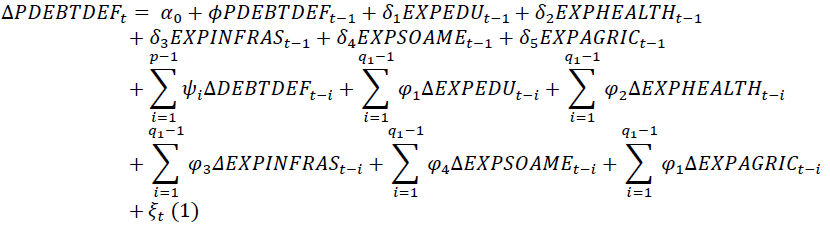
This research employed the expost facto design method. This is because the data used in the study are already in existence. The population for this study consists of data on public debt, education, infrastructure, health, social amenities and agriculture for the period 1981 to 2016 culled from the Central Bank of Nigeria Statistical bulletin. The choice of the terminal date is informed by the non-availability of data for 2017. Given the dynamic nature of public debt deficits in Nigeria and the goal of the study, the Autoregressive Distributed Lags (ARDL) approach to cointegration relationship modelling is adopted. The (ARDL) approach to cointegration is based on the methodology outlined in Pesaran and Shin (1999). The main advantage of this procedure is that “it can be applied regardless of the stationary properties of the variables in the sample and allows for inferences on long-run estimates, which is not possible under alternative cointegration procedures” (Belke & Polleit, 2006). The ARDL/Bounds Testing methodology of Pesaran & Shin (1999) and Pesaran et al. (2001) has a number of features that give it some advantages over conventional cointegration testing. In relation to the current study, the expanded ARDL model that explains dynamic relationship between fiscal policies on investment in Nigeria is specified as:
The conditional long-run model can then be produced from the reduced form solution of
(1), when the first-differenced variables jointly equal zero. The adjustment to long run long run
investment is determined by the cointegrating equation. Also, the values of short-run public
deficits is given by  while the values of long-run run public deficits performance is
represented as
while the values of long-run run public deficits performance is
represented as 
Diagnostic Tests
The application of the ARDL technique presupposes that certain properties of the time series data employed in the analysis possess qualities. These qualities will be tested based on the diagnostic testing procedure
Testing for Stationarity
The Augmented Dickey-Fuller (ADF), Phillip-Perron (P-P) and the Kwiatkowski– Phillips-Schmidt-Shin (KPSS) unit roots test was used to test for stationarity. “A variable is said to be stationary when the calculated test statistic is greater than the critical value in absolute terms, and the critical value is read at a certain level of significance” (Belke & Polleit, 2006). The use of a non-stationary variable in regression analysis results in spurious relationship. This would lead to poor forecasts. The ADF and P-P tests take the unit root to be null hypothesis Ho: ρ =1 which is then tested against one-side alternative H1: ρ<1. For the KPSS test, the null hypothesis for the test is that the data is stationary; while the alternate hypothesis for the test is that the data is not stationary.
Co-integration Tests
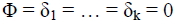
If a linear combination of variables is stationary, then, the relationship between dependent variable and a linear combination among these variables can be thought to be cointegrated. The test for long run relationship between the dependent variable and each of the independent variables is the cointegration test. The null hypothesis of non-existence of a longrun relationship is defined by testing the hypothesis [based on the general form of the ARDL model] in equation (1) above:
 (1)
(1)
This test is the bounds testing procedure introduced by (Pesaran et al. 1996), along with the critical value bounds. The test is performed by comparing the F-statistic computed from the ARDL equation with the upper and lower 90, 95 or 99 percent critical value bounds (FU and FL). In the case where the F-statistic lies below the lower bound, the long run relationship may be rejected. On the other hand, if the F-statistic is higher than the upper bound of the critical value band the null of no long run relationship between the variables can be rejected irrespective of their order integration. In the case that the F-statistic is between the two bounds then a unit root test should be applied (Ioannides et al., 2005).
Model Specification and Operationalization of Variables
The model used in this study is specified as follows:
SUSTABILITY = f (BUDGOVERN) (2)
Where:
SUSTABILITY = Sustainability, measured by outstanding Public Debt and deficit
BUDGOVERN = Budgetary Governance, measured by actual budget performance as reflected by expenditure on education, health and infrastructure.
The estimated model is in the form:
PDEBTDEF = f (PDEBTDEF, EXPEDU, EXPHEALTH, EXPINFRAS, EXPSOAME, EXPAGRIC) --------------- (3)
Where:
PDEBTDEF = Public Debt (both domestic and foreign) and deficit
EXPEDU = Expenditure on education
EXPHEALTH = Expenditure on health
EXPINFRAS = Expenditure on infrastructure
EXPSOAME = Expenditure on social amenities
EXPAGRIC = Expenditure on agriculture
Discussion
As mentioned earlier, the nature of the study and the empirical tools employed suggest that the time series properties of the data used are examined to ensure stability and time invariance in the estimated relationships. There is therefore need to investigate the stationery of variables in the model. These and other preliminary examination of the data is carried out to observe the initial characterization of the data and their relational properties.
Descriptive Statistics
The summary of data and other fundamental attributes of the series is given by the descriptive statistics. The annual summary statistics for all the variables in the study are reported in Table 1 below. Average public debt is at 256.4 and is relatively high. The median value is low, suggesting di-similarity among the data series over the period. The skewness value for the distribution is relatively high at 1.97 suggesting that the series on debt accumulation in Nigeria were concentrated on left side of the mean value; the kurtosis also confirms this outcome. The Jarque Bera value is significant at the 1 percent level, implying that the hypothesis of normality of the distribution should be rejected. This implies that the data series may have endogeneity issues which dictate the adoption of a systems estimator which is capable of capturing the endogeneity effects. To examine the underlying behavioural designs of the data series, the (unconditional or ordinary) correlation analysis is conducted on the data. The chart below (Figure 1 (Source: Authors’ computation)) shows that a positive correlation is demonstrated, suggesting that public debt and educational expenditure move in the same direction. The regression line shows that a one percent rise in educational expenditure will also cause public debt to increase by 0.789 percentage point. This is a high proportional relationship which indicates that educational spending and public debt are strongly related.
| Table 1 Summary Statistics | |||||||
| Mean | Median | Std. Dev. | Skewness | Kurtosis | Jarque-Bera | Prob. | |
| PDEBTDEF | 256.24 | 74.81 | 362.5 | 1.97 | 6.72 | 44.04 | 0 |
| EXPEDU | 93.02 | 27.37 | 126.32 | 1.28 | 3.17 | 9.86 | 0.01 |
| EXPHEALTH | 53.93 | 9.98 | 77.97 | 1.39 | 3.54 | 11.98 | 0 |
| EXPINFRAS | 44.89 | 7.79 | 60.95 | 1.19 | 3.1 | 8.55 | 0.01 |
| EXPSOAME | 57.53 | 3.94 | 96.65 | 1.42 | 3.22 | 12.1 | 0 |
| EXPAGRIC | 20.38 | 4.62 | 31.94 | 1.88 | 5.64 | 31.64 | 0 |

Figure 1 Unconditional Correlation Between
In Figure 2 (Source: Authors’ computations), the upward-sloping line shows positive relationship between public debt accumulation and health expenditure. The slope of the line is 0.7388, which is close, but less than, that of the educational expenditure line. Apparently, debt accumulation also raises sharply with larger health budgets.

Figure 2 Unconditional Correlation Between Public Debt and Health
For the relationship between infrastructural budget outlays and public debt, the chart in Figure 3 (Source: Authors’ computations) shows that the relationship is positive and quite strong. From the slope of the simple regression line, it can be seen that a percentage expansion in infrastructural expenditure causes debt to rise by 0.844 percentage points.

Figure 3 Unconditional Correlation between Public Debt and Infrastructure
The relationship between expenditures on social amenities and public debt in Nigeria is shown in Figure 4 (Source: Authors’ computations). A positive correlation is demonstrated between the two variables and the regression line shows a slope of 0.712, suggesting a very high positive relationship between the two variables. It shows that when all other expenditure structures are not taken into cognizance, a 1 per cent increase in expenditures on social amenities leads to a 0.712 percent increase in public debts in Nigeria.

Figure 4 Unconditional Correlation between Public Debt and Expenditure on Social Amenities
The correlation Chart in Figure 5 (Source: Authors’ computations) also shows a positive relationship between the two variables of government debt and expenditures in agriculture in Nigeria.

Figure 5 Unconditional Correlation between Public Debt and Expenditure on Agriculture
Unit Root Test
Table 2 presents results of Augmented Dickey Fuller (ADF) and Philip-Perron (PP) tests of the level and first differences ignoring any trend in variables. That is because an explicit test of the pattern of the time series was not conducted. The results indicate that each of the variables possesses both ADF and PP values that are less than the 95 percent critical values for the levelled series and greater than the critical value for the differenced series. In all cases, the six variables were non-stationary at levels but their first differences were found to be stationary. In essence, the log form of the variables were I(1). Therefore, the study adopted the cointegration analysis for estimation of the relationships between the variables, believing that the method will allow for the possible joint endogeneity of the variables used in the study. The Unit Root test shows that the series in the estimation are not stationary at the tested levels; therefore, the authors proceeded to determine whether they are cointegrated.
| Table 2 Unit Root Test for Variables | |||||
| Variable | ADF Test | Phillip-Perron Test | Order of Integration | ||
| Levels | First Difference | Levels | First Difference | ||
| pdebtdef | -1.223 | -7.543 | -1.103 | -7.635 | I[1] |
| expedu | -1.833 | -7.445 | -1.217 | -10.42 | I[1] |
| exphealth | -1.204 | -9.677 | -0.599 | -19.03 | I[1] |
| expinfras | -1.155 | -8.272 | -1.233 | -9.67 | I[1] |
| expsoame | -0.917 | -6.751 | -0.837 | -8.049 | I[1] |
| expagric | -1.657 | -8.319 | -1.251 | -9.719 | I[1] |
Source: Authors’ computation
Bound Test Analysis
Given that the study focuses on error correction processes in the ARDL procedure, test for a common stochastic trend is also conducted in this study. This involves the existence of a cointegrating relationship between public debt deficits and the other sustainability variables. This test also helps to confirm the application of a dynamic structure for the model estimation. Table 3 shows the result of the Bounds test of long run effects for the ARDL specifications for the equation. The evaluation of the results is based on the critical F-statistic values for the lower and upper bounds as also reported in the results. According to the empirical output of the F-values in Table 3, it can be seen that the null hypothesis of no long-run relationship between public debt deficit and the entire determinant variables is rejected at the 5 percent level. These results reveal that the determinant variables had strong long run relationships with the public debt deficits outcome.
| Table 3 Bounds Test Results | ||
| Test Statistic | Value | k |
| F-statistic | 15.36 | 5 |
| Critical Value Bounds | ||
| Significance | I0 Bound | I1 Bound |
| 10% | 2.26 | 3.35 |
| 5% | 2.62 | 3.79 |
| 2.50% | 2.96 | 4.18 |
| 1% | 3.41 | 4.68 |
The results (Table 4) of the ARDL estimations in this section is presented by reporting both the short run results as well as the cointegrated results. It should be noted that the optimum lag length of four (4) was selected for the ARDL structure based on the Shwarze-Bayesian criterion (SBC) as suggested by Peseran & Shin (1995). The results of the unrestricted short run, which is the OLS estimates of the distributed lags equation without taking the cointegration structure of the relationships into cognizance, are presented in Table 3. The result shows impressive diagnostic tests, with high adjusted R-squared value of 0.999 and highly significant F-value of 36328. This indicates that the model possesses high explanatory capacity and the independent variables are largely important in the determination of PDEBTDEF from the results.
| Table 4 The Short Run Results | |||
| Variable | Coefficient | t-Statistic | Prob.* |
| Constant | 0.573 | 0.461 | 0.669 |
| PDEBTDEF(-1) | -0.035 | -0.277 | 0.793 |
| PDEBTDEF(-2) | -0.063 | 1.583 | 0.187 |
| PDEBTDEF(-3) | 0.616 | 4.517 | 0.011 |
| EXPEDU | -4.612 | -3.548 | 0.024 |
| EXPEDU(-1) | 8.473 | 4.73 | 0.009 |
| EXPEDU(-2) | -0.997 | -1.098 | 0.334 |
| EXPEDU(-3) | 10.736 | 7.405 | 0.002 |
| EXPHEALTH | 22.428 | 8.671 | 0.001 |
| EXPHEALTH(-1) | -19.567 | -12.186 | 0 |
| EXPHEALTH(-2) | -6.261 | -1.736 | 0.158 |
| EXPHEALTH(-3) | -48.595 | -9.048 | 0.001 |
| EXPHEALTH(-4) | 5.914 | 4.182 | 0.014 |
| EXPINFRAS | -0.883 | -0.52 | 0.631 |
| EXPINFRAS(-1) | 12.514 | 7.037 | 0.002 |
| EXPINFRAS(-2) | -0.812 | -0.288 | 0.788 |
| EXPINFRAS(-3) | 15.643 | 7.693 | 0.002 |
| EXPINFRAS(-4) | -11.035 | -14.604 | 0 |
| EXPSOAME | 2.287 | 1.83 | 0.141 |
| EXPSOAME(-1) | -6.33 | -2.238 | 0.089 |
| EXPSOAME(-2) | -8.898 | -13.528 | 0 |
| EXPSOAME(-3) | 15.555 | 11.753 | 0 |
| EXPSOAME(-4) | 15.409 | 6.06 | 0.004 |
| EXPAGRIC | -3.609 | -7.356 | 0.002 |
| EXPAGRIC(-1) | -4.728 | -5.559 | 0.005 |
| EXPAGRIC(-2) | -3.926 | -2.346 | 0.079 |
| EXPAGRIC(-3) | -10.46 | -10.608 | 0 |
| EXPAGRIC(-4) | 1.362 | 0.85 | 0.443 |
| R-squared | 0.999996 | ||
| Adjusted R-squared | 0.999968 | ||
| F-statistic | 36328 | 0 | |
| D.W, stat. | 2.56 | ||
The coefficient of the lagged dependent variable is positive and significant at the 5 percent level, suggesting that past budget deficit values tend to affect current ones. The plausible reason is not unconnected with the nature of the budgetary process in Nigeria (where annual budgets are not implemented until the middle of each fiscal year). This also presents a startling outcome, since the result suggests that previous shortcomings in the budgets and its management can be easily transmitted into current budget outcomes in Nigeria.
For the independent variables, the results show that expenditure on education has an unexpected distributed impact on fiscal deficits in Nigeria in the short run. The initial effect is negative, then it becomes positive and then back to negative. However, the overall impact in the short run I shown to be positive, indicating that educational expenditure contributes significantly to short term increases in fiscal deficits in Nigeria. The coefficients of health expenditures are generally higher than those of education, and are mainly negative. This shows that in the short run, health expenditure mainly reduces fiscal deficits in Nigeria. For the coefficient of infrastructural expenditure, the coefficients are mainly positive, although the signs change from initial negative to positive. Apparently, expenditures on infrastructure also stimulate fiscal deficits in Nigeria. The coefficients of expenditures on both social amenities and agriculture both exert combined negative impact on fiscal deficit, implying that these patterns of expenditure tend to reduce the deficit accumulated by the public sector in Nigeria in the short run.
The results of the cointegrated equations for are reported in Table 5. In the results, the short run cointegrated and the long run estimates are reported. In the short run results, lagged public deficits coefficient is negative, which is unexpected. This shows that within the structure of long term perspective, public deficits in Nigeria may not be sustainable. The coefficients of all the expenditure factors exhibited similar results with those of the unrestricted OLS estimates of the short run behaviour. The study however focus on the coefficient of the ECM term for the ARDL estimation. This coefficient gives indication about the pattern of long run adjustments of the relationship estimated. The coefficient of the ECM term possesses the expected positive sign which is less than one in absolute terms. This shows that long run equilibrium is stable and that any short run deviation from long run equilibrium budget deficits level in Nigeria will always be restored on the basis of the expenditure patterns in the model. The coefficients of the ECM term is however relatively low, thereby indicating that adjustment to long run equilibrium in the public sector financing is slow in Nigeria. Indeed, only about 36 percent of the adjustment is completed within the first year. Thus, there is evidence that expenditure patterns in Nigeria tend to contribute to slow adjustment in the fiscal space.
| Table 5 The Cointegrated Results | |||
| Cointegrating (short run) estimates | |||
| Variable | Coefficient | t-Statistic | Prob. |
| D(PDEBTDEF(-1)) | -0.679 | -5.396 | 0.006 |
| D(EXPEDU) | -4.612 | -3.548 | 0.024 |
| D(EXPEDU(-1)) | 0.997 | 1.098 | 0.334 |
| D(EXPEDU(-2)) | -10.736 | -7.405 | 0.002 |
| D(EXPHEALTH) | 22.428 | 8.671 | 0.001 |
| D(EXPHEALTH(-1)) | 6.261 | 1.736 | 0.158 |
| D(EXPHEALTH(-2)) | 48.595 | 9.048 | 0.001 |
| D(EXPHEALTH(-3)) | -5.914 | -4.182 | 0.014 |
| D(EXPINFRAS) | -0.883 | -0.52 | 0.631 |
| D(EXPINFRAS(-1)) | 0.812 | 0.288 | 0.788 |
| D(EXPINFRAS(-2)) | -15.643 | -7.693 | 0.002 |
| D(EXPINFRAS(-3)) | 11.035 | 14.604 | 0 |
| D(EXPSOAME) | 2.287 | 1.83 | 0.141 |
| D(EXPSOAME(-1)) | 8.898 | 13.528 | 0 |
| D(EXPSOAME(-2)) | -15.555 | -11.753 | 0 |
| D(EXPSOAME(-3)) | -15.409 | -6.06 | 0.004 |
| D(EXPAGRIC) | -3.609 | -7.356 | 0.002 |
| D(EXPAGRIC(-1)) | 3.926 | 2.346 | 0.079 |
| D(EXPAGRIC(-2)) | 10.46 | 10.608 | 0 |
| D(EXPAGRIC(-3)) | -1.362 | -0.85 | 0.443 |
| CointEq(-1) | -0.356 | -4.695 | 0.009 |
| Long Run Results | |||
| Variable | Coefficient | t-Statistic | Prob. |
| constant | 1.611 | 0.467 | 0.665 |
| EXPEDU | 0.383 | 5.424 | 0.006 |
| EXPHEALTH | -0.13 | -4.347 | 0.012 |
| EXPINFRAS | 0.434 | 2.748 | 0.052 |
| EXPSOAME | 0.507 | 4.276 | 0.013 |
| EXPAGRIC | -0.601 | -4.939 | 0.008 |
In the long run results, the steady-state impacts of each variable on budgets and fiscal deficits are demonstrated. The long run coefficients of educational expenditure, infrastructural expenditure, and social amenities expenditures are all positive. This shows that following a sustained increase in these expenditures in Nigeria, fiscal deficits will continue to expand in the public sector. Apparently, these expenditure patterns are the main features that explain debt sustainability or budget sustainability in Nigeria. The focus of debt management in Nigeria should therefore be beamed on this expenditure framework, especially in terms of efficiency of resource use in the respective sectors. This is because, it will be difficult to argue for a reduction in allocations to these sectors since they are critical for overall growth of the economy and welfare of citizens in Nigeria. On the other hand, the coefficients of health and agricultural expenditures possess negative signs which indicate that these expenditure patterns tend to mitigate deficits accumulation in Nigeria, both in the short run and run the long run.
Robustness Test
Finally, we provide robustness check by testing the stability of the estimated equation across the data set within the cross sections in the sample. This helps to eliminate doubt about possible outlier regression for any of the groups in the sample. The chart in Figure 6 shows the result of the CUSUM test. It can be seen that the CUSUM line for the result lies entirely within the dotted 5 percent significance bound line throughout the chart. This reveals that the estimation is stable within the analysis.

Figure 6 Cusum Test Diagram
Conclusion
A sound budgeting system should ensure that worthwhile objectives are achieved, and that government use the available resources effectively, efficiently and in a manner that would sustain development over a long horizon without causing any impairment on the welfare of generations yet unborn. In Nigeria, current year budgets are not implemented until the second half of the fiscal year and the shortcomings of the previous year’ s budget appears to have spillover effect on the current year budgets. The result of the study shows that expenditure outlays have less than expected effects in explaining budgeting for sustainability in Nigeria, especially in the long run. This study finds that that in the long run, expenditure on education, infrastructure and social amenities have positive significant impact on public debt and deficits implying that budgets for in Nigeria budget for these sectors will continue to expand fiscal deficits. Financing expenditure on these critical sectors appears to be at the expense of future generations as evidenced by the yearly increase in accumulation of public debt. Expenditure on health and agriculture do not exert any pressure on public debt and deficits. The plausible reason for this is that it appears Nigeria as a nation is not spending much on the sectors especially as citizens continue to decry the country’s dependence on importation of food items and medical tourism abroad.
In the short run, expenditure on education contributes significantly to public debt and deficits in Nigeria, health expenditure affects public debt and deficits negatively indicating that expenditure on this sector is not financed through debt and deficits. Moreover, the result reveals that while expenditure on infrastructure in Nigeria is financed through public debt and deficits, expenditure on agriculture is not. As the study shows that expenditure on education and infrastructure will continue to exert pressure on public debt and deficits, and these sectors are critical to national development, hence cutting budget on these sectors cannot be advocated, the researchers recommend that debt management by Nigerian government should focus on efficient resource allocation to all sectors of the economy to ensure all-round development, given that fiscal deficits will continue to balloon as revealed by this study. Secondly, if the country must run a deficit budget or accumulate debt, a larger proportion of it should be channelled to education and health to guarantee a better future for generations yet unborn.
References
- Adenipekun, M.T. (2013). Sustainable rural infrastructural development in Nigeria within the context of Vision 20:2020. International Journal of Development and Sustainability, 2(1), 254-269
- Allen- Prescott, R. (2001). The wellbeing of nations: A Country-by-Country Index of Quality of Life and the Environment. Washington, DC: Island Press
- Bakare, A.S. (2012). Assessing the role of public spending for sustainable growth: Empirical evidence from Nigeria. Journal of Economics and Sustainable Development, 3(2), 50-57
- Beckett, J. (2002). Early budget theory: The progressive theory of public expenditures. In A. Khan & W. B. Hildreth (Eds), Budget theory in the public sector (pp. 22-41) London: Quorum Books
- Belke, A., & Polleit, T. (2006). Monetary policy and dividend growth in Germany: long-run structural modelling versus bounds testing approach. Applied Economics, 38(12): 1409-1423.
- Chambers, N., Simmons, C., & Wackernagel, M. (2000). Sharing Nature’s Interest: Ecological Footprints as an Indicator of Sustainable Development. London: Earthscan
- Crippen, D. (2003). Countering uncertainty in budget forecasts. OECD Journal on Budgeting, 3(2), 139-151.
- Dietz, T., Rosa, E.A., & York, R. (2009). Environmentally efficient well-being: Rethinking sustainability as the relationship between human well-being and environmental impacts. Human Ecology Review, 16(1), 114-123.
- Elliot, J.A. (2006). An introduction to sustainable development (3rd ed.). New York, (NY): Routledge
- Githaka, P.W., Gachahi, M.W., & Mwaruvie, J. (2019). Social amenities and academic performance in primary schools in Gichugu Constituency, Kenya. European Journal of STEM Education, 4(1), 04
- Treasury, H.M. (2004), Long-term Public Finance Report: An Analysis of Fiscal Sustainability, (December), London: H.M. Treasury.
- Hackbart, M., & Ramsey, J.R. (2002). The theory of the public sector budget: An economic perspective. In A. Khan & W. B. Hildreth (Eds), Budget theory in the public sector (172-187) London: Quorum Books
- Harris, J.M., Wise, T.A., Gallagher, K.P., & Goodwin, N.R. (2001). A Survey of Sustainable Development: Social and Economic Dimensions. Washington, D.C.: Island Press
- Heller, P.S. (2003). Who Will Pay? Coping with Aging Societies, Climate Change, and Other Long-term Fiscal Challenges. Washington DC: International Monetary Fund
- Holmberg, J. (1992). Making Development Sustainable: Redefining Institutions, Policy, and Economics. Washington, D.C.: Island Press
- Ioannides, D., Katrakilidis, C., & Lake, A. (2005). The relationship between Stock Market Returns and Inflation: An econometric investigation using Greek data. In J. Jacques and L. Philippe (Eds.) Applied Stochastic Models and Data Analysis, Theme of the International Symposium on Applied Stochastic Models and Data Analysis held at Brest-France, May 17-20 910-916
- Knight, K.W., & Rosa, E.A. (2011). The environmental efficiency of well-being: A cross-national analysis. Social Science Research 40, 931-949.
- Lawal, T., & Oluwatoyin, A. (2011). National development in Nigeria: Issues, challenges and prospects. Journal of Public Administration and Policy Research, 3(9), 237-241
- Lee, K., Holland, A., & McNeill, D. (eds.) (2000) Global Sustainable Development in the Twenty-First Century. Edinburgh: Edinburgh University Press
- Olufemi, E.A., Olatunbosun, A.J., Olasode, O.S., & Adeniran, I.G. (2013). Infrastructural development and its effect on economic growth: The Nigerian perspective. European Scientific Journal, 9(31), 431-452.
- Omagu, F.E. (2016). Infrastructural development in Nigeria: A panacea for transforming educational sector for sustainable national development. International Journal of Capacity Building in Education and Management (IJCBEM), 3(1), 13-19
- Pesaran, M.H., Shin, Y., & Smith, R.J. (1996). Testing for the existence of a long-run relationship. DAE Working Papers Amalgamated Series, No. 9622, University of Cambridge.
- Pesaran, M., Hashem., & Shin, Y. (1999). An autoregressive distributed lag modelling approach to cointegration analysis. In S. Strom, A. Holly and P. Diamond (Eds.) Econometrics and Economic Theory in the 20th Century. The Ragnar Frisch Centennial Symposium. Cambridge University Press.
- Pesaran, M., Hashem., Shin., Yongcheol., & Smith, R.J. (2001). Bounds testing approaches to the analysis of level relationships. Journal of Applied Econometrics 16, 289-326.
- Potter, R.B., Binns, J.A., Elliott, J.A., & Smith, D. (2004) Geographies of Development, (2nd ed.). Harlow: Addison Wesley Longman
- Reed, D. (1997). Structural Adjustment, the Environment and Sustainable Development. London: Earthscan Publications.
- Soubbotina, T.P. (2004). Beyond Economic Growth: An Introduction to Sustainable Development (2nd ed.), Washington, D.C: The International Bank for Reconstruction and Development/The World Bank
- Usman, B. (2014). Infrastructural challenges to the study of physics in tertiary institutions. JORIND 12(1), 1-19
- Walker, M.L. (1930). Municipal Expenditures. Baltimore: Johns Hopkins Press.
- World Commission on Environment and Development (1987) Our Common Future. Oxford: Oxford University Press.