Research Article: 2018 Vol: 22 Issue: 4
CEO Pension and Auditors Going Concern Opinion
Kyung Jin Park, Myongji University
Kyoungwon Mo, Chung-Ang University
Nayoung Yoon, Korea Advanced Institute of Science and Technology
Abstract
In U.S., CEO pension is common and sizable compensation recorded as off - balance sheet liabilities before CEOs’ retirement . Also, since it becomes unplayable after bankruptcy, CEOs awarded with pension plans are known to manage their firms conservatively to prevent such bankruptcies. Therefore, it was empirically examine d how auditors consider CEO pension in determining their going - concern opinions. O ur empirical results indicate that auditors are more likely to issue nega tive going - concern opinions for firms that provide their CEOs with pension plans. The results remain robust after controlling various endogeneity issues. Overall, our findings impl y that auditors recognize CEO pensions as liabilities rather than significan tly consider how CEO pensions provide incentives for conservative firm management .
Keywords
Inside Debt; CEO Pension; Audit Opinion; Going-Concern Opinion.
Jel Classification : M40; M42; M52.
Introduction
This study examines how Chief Executive Officers’ (CEO) pensions affect auditors’ going-concern opinions. Although CEO pensions are camouflaged in executive compensation structure, they are very sizable and commonly provided to CEOs in U.S. firms as extra compensation1. Bebchuk & Jackson Jr. (2005) analyse the CEO compensation structures among Standard and Poor 500 firms to discover that on average, CEO pension’s account for 34% of total CEO compensation and that this proportion increases drastically as the CEO’s years of service increase2. Sundaram & Yermack (2007) also find that 78% of Fortune 500 firms provide CEO pension plans, and that the benefits’ annual increase in value is approximately 17% of that of CEOs’ equity-based compensation.
Pension plans for CEOs have unique characteristics that distinguish them from other types of CEO compensation. As a defined benefit pension plan, CEO pensions require firms to recognize the (off-balance sheet) liabilities of future payments for retirement benefits every fiscal-year end, and to make lump sum or yearly pension payments after the CEO’s retirement. This feature converts CEO pensions into a debt-like compensation in which the CEO is a firm creditor. Further, as a CEO’s right to pension benefits cannot be secured if the firm goes bankrupt, a pension can induce CEOs’ conservative decisions to prevent such bankruptcies.
Many recent empirical studies have examined whether CEO pensions provide such incentives. For instance, Sundaram & Yermack (2007) find that bankruptcy risk is relatively and significantly lower among firms that provide large CEO pension benefits. Cassell et al. (2012) find that large CEO insider debt induces firms to increase their cash holdings, diversify business segments, and reduce both debt-to-equity ratios and research and development expenditures.
Wang et al. (2013) demonstrate that CEOs of firms that offer CEO pensions are more likely to adopt a more conservative accounting policy.
It was extend the literature by raising a research question: how do auditors recognize the CEO pensions in determining their going-concern opinion? If auditors concern more on the liabilities arising from CEO pensions than the incentives for conservative CEO decision making, they are more likely to issue negative going-concern opinions3. Or, if auditors value more on the incentives for conservative CEO decision making than the increased liabilities from CEO pensions, they are less likely to issue negative going-concern opinions for firms with CEO pension plans.
Our results indicate that auditors are more likely to issue going-concern opinions for firms that provide CEO pensions. This implies that auditors are concerned that CEO pensions increase liabilities, and thus, bankruptcy risk. Further, it was performed by many tests to alleviate endogeneity issues. First, it discover a significantly positive correlation between CEO pensions and going-concern opinions after adopting propensity score matching and Heckman (1979) twostage regression approaches to control for the endogeneity of providing CEO pension plans. Second, it was additionally control for the level of earnings management and auditors’ independence to alleviate the endogeneity concern arising from omitted variables. The regression results also indicate that auditors who report going-concern opinions consider CEO pensions as liabilities, and not as factors that indirectly affect the degree of earnings management or impaired auditors’ independency.
This study contributes to literature in various aspects. First, this study introduce CEO pension as new factor that auditors consider in their audit process. Auditors developing their audit plans comprehensively consider various aspects of their client firms (Chen et al., 2015; Jayaraman & Milbourn, 2015). Specifically, the literature argues that auditors understand how the CEO compensation structure affects CEO behaviours. For example, Kim et al. (2015) and Fargher et al. (2014) find that auditors require higher audit fees from audited firms that provide greater equity-based compensation. This implies that auditors assume that CEOs with higher equity-based compensation are likely to make aggressive investments and financial decisions, and to manage earnings. However, few studies have examined whether and how the auditor’s opinion reflects CEO pensions.
Second, this study expands research on CEO pensions to include an examination of whether auditors understand the incentives that CEO pensions generate. Recent studies, based on initial research of how CEO pensions affect CEO behaviour, have broadened the research area by examining whether various market participants, such as shareholders and creditors, understand how changes in CEO behaviour are driven by CEO pensions. This study is significant because auditors play important roles in the capital market alongside shareholders and creditors. Further, this study posits that the CEO pension is a factor that affects the audit process. Although Sun et al. (2014) reveal a positive relationship between audit fees and CEO pensions, and argue that auditors increase their audit fees when they observe that a CEO pension reduces a firm’s accounting conservatism, their evidence does not confirm that auditors directly observe the effects of CEO pensions. It has reflected this in their audit process, as auditors may indirectly react to reduced accounting conservatism. Moreover, as CEO pensions directly relate to bankruptcy, investigating going-concern opinions seems to be the most suitable research focus, as these more closely relate to bankruptcy risk than audit fees, which more directly relate to the degree of misreporting.
The remainder of this paper is organized as follows: It was examine prior literature and develop a hypothesis in Section 2. Section 3 presents the sample selection procedure and research design. It discusses the data and research results in Section 4, followed by an additional analysis in Section 5. Finally, this study concludes in Section 6.
Literature Review
CEO Pensions
According to agency theory, the optimal CEO compensation structure is one in which the ratio of capital-like to debt-like compensation equals the firm’s capital-to-debt ratio (Jensen & Meckling, 1976; Edmans & Liu, 2011). Agency theory argues that capital-like compensation attenuates the CEO’s risk aversion and matches the CEO’s incentives with those of shareholders, while debt-like compensation controls the benefits of capital-like compensation and aligns the CEO’s benefits with those of creditors. Thus, it is appropriate that firms with large total debts on their financial statements should provide debt-like compensation to their CEOs, as this aligns creditors’ benefits with the benefits of agency. Despite the importance of debt-like compensation to the design of compensation plans, empirical studies focus on equity-based compensation, examining whether it aligns CEOs and shareholders’ incentives (Murphy, 1985; Lambert & Larcker, 1987; Morck et al., 1988; McConnell & Servaes, 1990; Hanlon et al., 2003; Coleset al., 2006; Low, 2009; Brockman et al., 2010).
However, it has recently become known that CEO pensions have debt-like characteristics. Firms record CEO pensions as liabilities in their financial statements during the CEO’s tenure. The firm will make a lump-sum payment or periodic pension payments after the CEO’s retirement, barring the firm’s bankruptcy. In this instance, the CEOs are exposed to the same default risks and insolvency treatment as outside creditors, as inside debt obligations are unsecured and unfunded. Researchers regard the CEO pension as a debenture unsecured bond. Recent studies consider the CEO pension as a debt-like CEO compensation instrument, and examine whether it aligns the CEO’s and creditors’ benefits, as agency theory argues. Specifically, many studies investigate whether CEOs who receive pensions make more conservative investment, financing, and accounting decisions to protect their insider debt from firm bankruptcy.
For example, Sundaram & Yermack (2007) report that bankruptcy risk is lower among firms that provide greater CEO pensions than among firms that provide lower CEO pensions. They also indicate that CEOs voluntarily retire after finishing their mandatory service years when given a payable CEO pension. Cassell et al. (2012) find that the CEO pension is not only negatively associated with the volatility of the firm’s future stock returns, R&D expenditures, and the financial leverage ratio, but is also positively associated with the extent of diversification and asset liquidity. This indicates that CEOs with larger CEO pensions are more risk-averse. Phan (2014) notes that CEOs with larger pensions are less likely to pursue mergers and acquisitions that might increase the firm’s bankruptcy risk. Wang et al. (2013) find that firms with CEO pensions are more likely to choose a more conservative accounting policy and insist on a substitutionary relationship between the CEO pension and accounting conservatism. Meanwhile, recent studies of CEO pensions have focused on whether market participants understand their debt-like characteristics. For example, Wei & Yermack (2011) find that companies’ reports of inside debt reduce the cost of debt and increase the cost of equity. It argue that this occurs because both shareholders and bondholders understand that a pension changes CEOs’ behavioural patterns. Although the aforementioned studies investigate various market participants’ reactions to insider debt, few studies have examined whether auditors-among the most important market participants in the capital market-clearly understand CEO pensions. This study fills this research gap concerning CEO pensions and auditors by first investigating the determinants of auditor decision making.
Audit Process
Auditors’ primary tasks include planning and implementing an error-free audit process to verify whether the firm’s financial reporting meets financial accounting standards. Auditors establishing an auditing plan consider various factors, such as business risk and the probability of accounting fraud. If the fraud risk is high enough to justify detailed auditing, they broaden the audit’s range and rigor to reduce the risk to an acceptable level. Many accounting studies investigate the factors that auditors consider when determining a firm’s overall risk (Bedard, 1989; Davis et al., 1993; Mock & Wright, 1993; O’Keefe et al., 1994; Johnstone, 2000; Bell et al., 2001; Bedard & Johnstone, 2004). For example, Bedard & Johnstone (2004) reveal that auditors recognize how corporate governance influences the degree of earnings management, and auditors reflect this in their auditing process. Other studies argue that CEO incentive structures are also considered during audit planning. Chen et al. (2015) find that the vega, representing the degree of synchronicity to stock return volatility, has a positive relationship with CEO compensation, and they suggest that auditors understand how equity-based CEO compensation can affect CEO behaviours.
Jayaraman & Milbourn (2015) posit that only auditors who are highly experienced in the client’s industry understand the incentives provided by CEO compensation. Kim et al. (2015) examine not only whether auditors consider equity-based compensation, such as stocks and options, as risky instruments, but also if auditors understand how equity-based compensation changes CEO behaviour. They found that auditors understand that equity-based compensation can induce CEOs to conduct more earnings management, and that auditors reflect this in their audit fees. Similarly, Fargher et al. (2014) examine whether auditors understand the incentives offered by equity-based compensation. Contrary to Kim et al. (2015), they found that auditors demand higher fees from firms with higher equity-based compensation. This occurs not because of the probability of earnings management, but due to concerns that CEOs offered substantial equity-based compensation would pursue aggressive investments and financial decision-making, which could increase the firm’s bankruptcy risk. Thus, auditors recognized how CEO compensation affects CEO behaviour, and reflect this knowledge in their audit plans. However, research has focused merely on whether auditors understand the effects of equity-based compensation. This study develops the hypothesis described below to examine whether auditors understand another type of CEO compensation the CEO pension and whether they reflect its impact in their audit process, and especially in their going-concern opinions.
Hypothesis Development
Overall, CEO pensions are recorded as liabilities and thus, increase bankruptcy risk but their debt-like characteristics also help align the CEO’s benefits with creditors’ benefits, as CEOs holding pensions have incentives to reduce their firms’ bankruptcy risks. If auditors are concerned that CEO pensions behave like a liability, auditors will be more likely to issue negative going-concern opinions for firms that provide those that are more generous. Meanwhile, if auditors understand and highly evaluate the mechanism of the CEO pension, they will be less likely to issue negative going-concern opinions for firms that provide higher CEO pensions. It was established the following hypothesis to test these two conflicting concepts:
H1: Ceteris paribus, auditors are more likely to issue negative going-concern opinions for firms that provide higher CEO pensions.
Methodology
Sample Selection
Sample selection process started with all U.S. firms that announced CEO pension-related data in the ExecuComp database from 2006 to 2014. The sample began in 2006 because the Securities and Exchange Commission (SEC) amended the announcement-related law for listed firms in 2006; the SEC mandated that firms with CEO pensions had to announce their present value. Further, ExecuComp provided electronic pension data from the fiscal year end of 2006. It has excluded financial firms, including such companies in the banking and insurance industries as Standard Industrial Classification (SIC) codes 6000–6999, as the accounting policies and systems used in such firms are structurally unique, and considering them would reduce the comparability between firms. It was obtained auditors’ going concern opinions from the AuditAnalytics database, and remove missing firm-year observations when data is missing from either ExecuComp or AuditAnalytics. It was used the same procedure for missing control variables. The control variables’ dataset is composed using Compustat, AuditAnalytics, and ExecuComp. The sampling process yields 12,366 firm-year observations. Among the sample firms, 97 received negative going-concern opinions from auditors, and the other 12,269 firms received positive going-concern opinions.
Research Model
Hypothesis 1 tested that auditors report more negative going-concern opinions for firms that provide higher CEO pensions by calculating the amounts of CEO pension holdings using the ratio of CEO pension holding to equity-based compensation, as in the work of Wei & Yermack (2011).
The CEO pension amount is the sum of the present values of the CEO pension and deferred compensation, as reported in ExecuComp. The CEO’s equity-based compensation is calculated by adding the total values of option-based and stock-based compensation. Collectively, CEO leverage is a main independent variable related to CEO pensions, and can be expressed as follows:

After controlling for several variables that might affect the auditor’s audit process following Kim et al. (2015). It was employed the logit model to test Hypothesis 1, based on the independent variable for CEO pension:
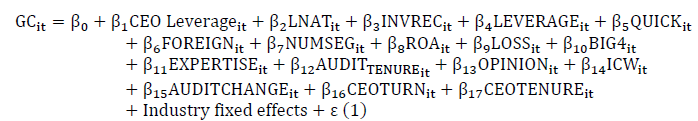
Where, the dependent variable GC is a proxy reflecting whether auditors report goingconcern opinions positively or negatively. This is an indicator variable with a value equal to 1 if a firm receives a negative going-concern opinion, and 0 otherwise. Thus, if auditors report less negative going-concern opinions for firms holding higher CEO pensions, as defined in the null hypothesis, then β1 , the coefficient of CEO Leverage, will be negative. Alternatively, if auditors recognize CEO pensions as a liability, then the value of β1 will be positive.
It has follow the work of Kim et al. (2015) and control for the following variables, which are known to be important determinants in the audit process: First, it has control for client firms’ characteristics by including the firm’s asset size (LNAT), inventory and receivable assets (INVREC), debt ratio (LEVERAGE), quick ratio (QUICK), foreign sales (FOREIGN), the number of segments (NUMSEG), the return on assets (ROA), and loss (LOSS). Second, it has also control for auditor characteristics, such as whether the auditors work for Big 4 firms (BIG4), whether auditors have industry expertise (EXPERTISE), and auditor tenure (TENURE). It had also consider whether the client firms received a negative going-concern opinion within the past two years (OPINION), whether they received a negative audit opinion for inside control systems within two years (ICW), whether the auditors changed (AUDITOR_CHANGE), whether CEO turnover occurred (CEOTURN), and the CEO’s service years (CEO_TENURE). Finally, It had control for fixed effects regarding the client’s industry and the fiscal year. It is used two-digit SIC codes (i.e., for 100 industry groups) to reduce the industry-fixed effects on the auditor’s going-concern opinion. All variables are winsorized at the top and bottom 1% to alleviate the impacts of extreme values, and are defined in Appendix 1.
Results And Discussion
Descriptive Statistics
Table 1 presents the descriptive statistics for all the variables used in the regression model (1). The mean value of GC is 0.008, indicating that approximately 97 firm-year observations (12,366*0.008) received negative going-concern opinions. The main variable of interest, CEO Leverage, has a mean value of 0.376 and a median value of 0.031, implying that our sample includes firm-year observations in which CEOs receive high-level pensions. The untabulated results indicate that 59.29% of the sample firms provide CEO pensions. These results are low compared to the ratios reported by both Sundaram & Yermack (2007) and Bebchuk & Jackson Jr. (2005). As our sample firms are taken from the ExecuComp database, which includes S&P 1500 companies, the firms are smaller than those considered by Sundaram & Yermack (2007) or Bebchuk & Jackson (2005). The control variables’ descriptive statistics are similar to those in the work of Kim et al. (2015).
| Table 1 Descriptive Statistics |
|||||
| Variable (N=12,366) | Mean | Median | S.D. | 25% | 75% |
| GC | 0.008 | 0.000 | 0.088 | 0.000 | 0.000 |
| CEO Leverage | 0.376 | 0.031 | 0.911 | 0.000 | 0.326 |
| LNAT | 7.526 | 7.443 | 1.629 | 6.351 | 8.615 |
| INVREC | 0.236 | 0.216 | 0.155 | 0.108 | 0.328 |
| LEVERAGE | 0.521 | 0.517 | 0.234 | 0.354 | 0.666 |
| QUICK | 1.864 | 1.412 | 1.517 | 0.955 | 2.190 |
| FOREIGN | 0.899 | 1.000 | 0.301 | 1.000 | 1.000 |
| NUMSEG | 2.095 | 2.303 | 1.015 | 1.609 | 2.890 |
| ROA | 0.041 | 0.051 | 0.104 | 0.019 | 0.088 |
| LOSS | 0.178 | 0.000 | 0.382 | 0.000 | 0.000 |
| BIG4 | 0.905 | 1.000 | 0.293 | 1.000 | 1.000 |
| EXPERTISE | 0.335 | 0.288 | 0.252 | 0.132 | 0.489 |
| AUDIT_TENURE | 15.335 | 12.000 | 11.333 | 7.000 | 22.000 |
| OPINION | 0.013 | 0.000 | 0.111 | 0.000 | 0.000 |
| ICW | 0.029 | 0.000 | 0.168 | 0.000 | 0.000 |
| AUDITCHANGE | 0.034 | 0.000 | 0.181 | 0.000 | 0.000 |
| CEOTURN | 0.104 | 0.000 | 0.306 | 0.000 | 0.000 |
| CEO_TENURE | 8.283 | 6.000 | 7.125 | 3.000 | 11.000 |
Note: N represents the number of firm-year observations. All variables are defined in Appendix 1. All continuous variables are winsorized at the top and bottom 1%.
Correlations
Table 2 presents the Pearson correlations among the variables used in the regression model (1). The correlation analysis indicates that CEO Leverage, a main variable of interest, positively correlates with the dependent variable, GC (coefficient=0.11) and is statistically significant (p-value=0.00). The positive relationship between these two variables implies a rejection of the null hypothesis that auditors report less negative going-concern opinions for firms providing higher CEO pensions. Other control variables display similar relationships with GC, or results that are consistent with prior studies. These indicate that firms are less likely to receive negative going-concern opinions as the firm size, quick ratio, foreign business revenues, business segments, and ROA (Return on Asset) increase; the auditors work for Big 4 audit firms; and as the auditor’s tenure increase. In contrast, firms are more likely to receive negative goingconcern opinions as their leverage ratio increases, as they report more losses, if they have received past going-concern opinions, when their auditor changes, or when CEO turnover occurs.
| Table 2a Pearson Correlation |
||||||||||
| Variables | 1 | 2 | 3 | 4 | 5 | 6 | 7 | 8 | 9 | 10 |
| GC | 1 | 0.11 | -0.06 | 0.01 | 0.15 | -0.03 | -0.04 | -0.04 | -0.22 | 0.16 |
| (0.00) | (0.00) | (0.12) | (0.00) | (0.00) | (0.00) | (0.00) | (0.00) | (0.00) | ||
| CEO Leverage | 1 | 0.21 | -0.04 | 0.20 | -0.13 | 0.01 | 0.08 | -0.10 | 0.06 | |
| (0.00) | (0.00) | (0.00) | (0.00) | (0.17) | (0.00) | (0.00) | (0.00) | |||
| LNAT | 1 | -0.22 | 0.37 | -0.35 | 0.03 | 0.20 | 0.15 | -0.20 | ||
| (0.00) | (0.00) | (0.00) | (0.00) | (0.00) | (0.00) | (0.00) | ||||
| INVREC | 1 | -0.04 | -0.12 | -0.01 | 0.05 | 0.03 | 0.00 | |||
| (0.00) | (0.00) | (0.23) | (0.00) | (0.00) | (0.79) | |||||
| LEVERAGE | 1 | -0.55 | 0.00 | 0.00 | -0.19 | 0.12 | ||||
| (0.00) | (0.62) | (0.64) | (0.00) | (0.00) | ||||||
| QUICK | 1 | 0.01 | -0.01 | 0.05 | 0.02 | |||||
| (0.35) | (0.55) | (0.00) | (0.03) | |||||||
| FOREIGN | 1 | 0.69 | -0.01 | 0.01 | ||||||
| (0.00) | (0.45) | (0.42) | ||||||||
| NUMSEG | 1 | 0.02 | -0.02 | |||||||
| (0.01) | (0.02) | |||||||||
| ROA | 1 | -0.69 | ||||||||
| (0.00) | ||||||||||
| LOSS | 1 | |||||||||
| BIG4 | ||||||||||
| EXPERTISE | ||||||||||
| AUDIT_TENURE | ||||||||||
| OPINION | ||||||||||
| ICW | ||||||||||
| AUDITCHANGE | ||||||||||
| CEOTURN | ||||||||||
| CEO TENURE | ||||||||||
| Table 2b Pearson Correlation |
||||||||
| Variables | 11 | 12 | 13 | 14 | 15 | 16 | 17 | 18 |
| GC | -0.07 | -0.01 | -0.04 | 0.79 | 0.04 | 0.04 | 0.03 | -0.03 |
| (0.00) | (0.56) | (0.00) | (0.00) | (0.00) | (0.00) | (0.00) | (0.00) | |
| CEO Leverage | 0.10 | 0.09 | 0.08 | 0.09 | -0.01 | -0.03 | 0.01 | -0.08 |
| (0.00) | (0.00) | (0.00) | (0.00) | (0.42) | (0.00) | (0.25) | (0.00) | |
| LNAT | 0.36 | 0.34 | 0.21 | -0.05 | -0.06 | -0.09 | 0.00 | -0.10 |
| (0.00) | (0.00) | (0.00) | (0.00) | (0.00) | (0.00) | (0.88) | (0.00) | |
| INVREC | -0.09 | 0.02 | 0.03 | 0.01 | 0.02 | 0.01 | 0.00 | 0.02 |
| (0.00) | (0.07) | (0.00) | (0.31) | (0.01) | (0.24) | (0.85) | (0.07) | |
| LEVERAGE | 0.20 | 0.19 | 0.06 | 0.14 | 0.05 | -0.02 | 0.04 | -0.15 |
| (0.00) | (0.00) | (0.00) | (0.00) | (0.00) | (0.07) | (0.00) | (0.00) | |
| QUICK | -0.17 | -0.20 | -0.06 | -0.03 | -0.02 | 0.04 | -0.02 | 0.11 |
| (0.00) | (0.00) | (0.00) | (0.00) | (0.02) | (0.00) | (0.02) | (0.00) | |
| FOREIGN | 0.00 | 0.00 | 0.06 | -0.04 | -0.06 | -0.02 | -0.02 | 0.03 |
| (0.93) | (0.90) | (0.00) | (0.00) | (0.00) | (0.05) | (0.05) | (0.00) | |
| NUMSEG | 0.08 | 0.09 | 0.11 | -0.03 | -0.06 | -0.04 | -0.01 | 0.00 |
| (0.00) | (0.00) | (0.00) | (0.00) | (0.00) | (0.00) | (0.37) | (0.68) | |
| ROA | 0.08 | 0.05 | 0.06 | -0.20 | -0.09 | -0.07 | -0.07 | 0.05 |
| (0.00) | (0.00) | (0.00) | (0.00) | (0.00) | (0.00) | (0.00) | (0.00) | |
| LOSS | -0.10 | -0.07 | -0.06 | 0.16 | 0.10 | 0.06 | 0.09 | -0.06 |
| (0.00) | (0.00) | (0.00) | (0.00) | (0.00) | (0.00) | (0.00) | (0.00) | |
| BIG4 | 1 | 0.34 | 0.25 | -0.07 | -0.02 | -0.14 | 0.00 | -0.08 |
| (0.00) | (0.00) | (0.00) | (0.02) | (0.00) | (0.81) | (0.00) | ||
| EXPERTISE | 1 | 0.15 | -0.01 | -0.03 | -0.07 | 0.01 | -0.08 | |
| (0.00) | (0.57) | (0.00) | (0.00) | (0.29) | (0.00) | |||
| AUDIT_TENURE | 1 | -0.04 | -0.06 | -0.24 | -0.01 | -0.03 | ||
| (0.00) | (0.00) | (0.00) | (0.45) | (0.00) | ||||
| OPINION | 1 | 0.04 | 0.06 | 0.04 | -0.04 | |||
| (0.00) | (0.00) | (0.00) | (0.00) | |||||
| ICW | 1 | 0.05 | 0.02 | 0.00 | ||||
| (0.00) | (0.04) | (0.88) | ||||||
| AUDITCHANGE | 1 | 0.01 | 0.01 | |||||
| (0.41) | (0.17) | |||||||
| CEOTURN | 1 | -0.32 | ||||||
| (0.00) | ||||||||
| CEO TENURE | 1 | |||||||
Notes: The sample size is 12,366. All variables are defined in Appendix 1. Figures in parentheses are p-values.
Regression Results
It was conducted a regression analysis using the regression model (1) to examine whether CEO pensions additionally impact auditors’ decision making, and especially in going-concern opinions, after controlling for various factors that might affect the audit process.
Table 3 presents the multivariate analysis results. The coefficient for CEO Leverage is statistically positive at the 5% significance level, implying that auditors give negative goingconcern opinions for firms holding higher CEO pensions. These results suggest that auditors recognize CEO pensions as liabilities rather than significantly consider how CEO pensions provide incentives for conservative firm management. The control variables’ regression results are similarly interpreted.
| Table 3 Main Regression |
||
| Variable | Dependent variable: GC | |
| Coefficient Estimate | (χ2-value) | |
| Intercept | -23.152 | (0.095) |
| CEO Leverage | 0.913 | (5.833)** |
| LNAT | -0.487 | (2.537) |
| INVREC | 0.023 | (0.000) |
| LEVERAGE | 2.717 | (4.238)** |
| QUICK | -0.344 | (1.669) |
| FOREIGN | -3.043 | (4.397)** |
| NUMSEG | 0.140 | (0.095) |
| ROA | -2.565 | (1.068) |
| LOSS | 0.758 | (0.591) |
| BIG4 | -1.354 | (1.142) |
| EXPERTISE | 3.603 | (3.357)* |
| AUDIT_TENURE | -0.003 | (0.007) |
| OPINION | 27.434 | (0.134) |
| ICW | 0.430 | (0.118) |
| AUDITCHANGE | -0.973 | (0.982) |
| CEOTURN | 0.969 | (1.270) |
| CEO_TENURE | 0.237 | (4.499)** |
| Industry fixed effect | Yes | |
| N | 12,366 | |
| Adj. R2 | 0.917 | |
Note: Figures in parentheses are Wald chi-square statistics, and N represents the number of firm-year observations. All variables are defined in Appendix 1. All independent variables are measured at the end of the fiscal year of the going-concern opinion. ***, **, and * indicate significance at the 1%, 5%, and 10% levels, respectively.
Propensity Score Matching Analysis
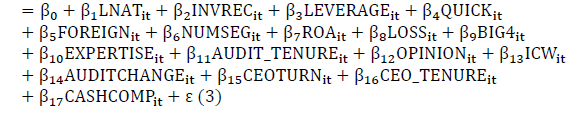
Although it was control for various factors that might affect the audit process in regression model (1), an endogeneity problem may arise if structural differences exist between firms that hold CEO pensions and those that do not. It was reduce this endogeneity problem by using the propensity score matching analysis, as developed by Rosenbaum and Rubin (1983). The first stage of this analysis involves using all the control variables used in model (1) as independent variables, following Li & Prabhala’s (2007) research model; It has used a dummy variable for CEO pensions (Dummy for CEO Pension) as the dependent variable, set to one if the firm provides a pension as part of the CEO’s compensation.
First stage:
Dummy for CEO Pensionit
Next, It has match firms that provide CEO pensions with those that do not by minimizing the difference in propensity scores based on the propensity score from the first stage, but only for the sample in which the difference in propensity scores is not greater than 0.01.
Table 4 illustrates the first- and second-stage regression results. The first stage’s results are interpreted as follows: When firms are larger, they retain more accounts receivables and inventory assets, their leverage ratio is higher, they have more business segments, their auditors belong to Big 4 companies, their auditors have industry expertise, and their auditors’ tenure is longer; these firms are likely to provide CEO pensions. Alternatively, firms with foreign business sales or reported losses, those that have received negative going-concern opinions in the last two years, changed CEOs, or CEOs with longer years of service are less likely to provide CEO pensions. These results are generally consistent with prior studies’ results. The results of the second-stage regression, which uses a sample that matches that used in the first stage, are significantly similar to those in Table 3. The coefficient of CEO Leverage is still statistically positive at the 5% significance level, implying that the empirical results illustrated in Table 3 remain unchanged. This is the case even when considering the systematic differences between firms with CEO pensions and those without with a propensity score matching analysis.
| Table 4 Propensity Score Matching |
||
| Variable | Dependent Variable | |
| 1st Stage: Dummy for CEO Leverage | 2nd Stage: GC | |
| Intercept | -7.343 | -32.329 |
| CEO Leverage | 1.092 | |
| LNAT | 0.601 | -0.079 |
| INVREC | 2.641 | 5.491 |
| LEVERAGE | 0.835 | 4.152 |
| QUICK | -0.180 | -2.021 |
| FOREIGN | -0.319 | -5.459 |
| NUMSEG | 0.413 | 1.620 |
| ROA | -0.011 | -1.550 |
| LOSS | -0.473 | 5.214 |
| BIG4 | 0.476 | 0.631 |
| EXPERTISE | 0.546 | -0.902 |
| AUDIT_TENURE | 0.017 | -0.135 |
| OPINION | -0.649 | 27.277 |
| ICW | -0.171 | 0.430 |
| AUDITCHANGE | -0.125 | -0.620 |
| CEOTURN | -0.535 | 2.206 |
| CEO_TENURE | -0.012 | 0.104 |
| Industry fixed effect | Yes | Yes |
| N | 12,366 | 6,101 |
| Adj. R2 | 0.284 | 0.586 |
Note: Figures in parentheses are Wald chi-square statistics, and N represents the number of firm-year observations. Dummy for inside debt is an indicator variable, with a value equal to 1 if a company has a supplemental executive retirement plan or deferred compensation plan greater than 0, and 0 otherwise. All other variables are defined in Appendix 1. All independent variables are measured at the end of the fiscal year of the going-concern opinion.
Heckman Selection Model
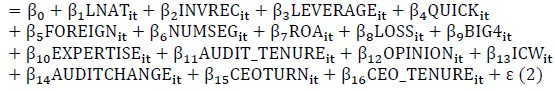
In addition, it was adopting the Heckman (1979) two-stage model to control for the endogeneity of providing CEO pension plans. Specifically, in the first stage, it estimate the following probit regression of choice to provide CEO pensions:
Dummy for CEO Pensionit
Where, Dummy for CEO Pension is equal to one if the firm provides a pension as part of the CEO’s compensation and zero otherwise. Following Larcker & Rusticus (2010) and Lennox, Francis, and Wang (2012) who emphasize that at least one independent variable, which is correlated with the dependent variable in the first-stage model but not with the dependent variable in the second-stage model, It has employ CASHCOMP in the first-stage model. CASHCOMP is CEO’s total cash based compensation calculated as salary plus bonus. Kalyta (2009) finds that CEOs manipulate the level of cash-based compensation to maximize the value of their pension plan. In the second stage, it re-estimate the main regression model (1) with additional control variable, inverse Mill’s ratio (IMR), obtained from the first-stage.
Table 5 presents the first- and second stage regression results. In the first-stage, CASHCOMP is positively correlated with the probability of providing CEO pensions, consistent with Kalyta (2009). The second-stage results remain qualitatively unchanged with the results of Table 3. That is, the coefficient on CEO Leverage is significantly positive, confirming that our main regression results are not contaminated from the endogeneity problem arising from sample selection bias.
| Table 5 Heckman Two Stage Procedure |
||||
| Variables | Dependent variable | |||
| 1st stage: Dummy for Inside Debt | 2nd stage: GC | |||
| Intercept | -3.773 | (88.109)*** | -26.348 | (0.117) |
| CEO Leverage | 0.885 | (4.778)* | ||
| LNAT | 0.349 | (708.572)*** | -0.271 | (0.049) |
| INVREC | 1.636 | (174.411)*** | 1.107 | (0.027) |
| LEVERAGE | 0.453 | (35.002)*** | 3.023 | (1.971) |
| QUICK | -0.102 | (65.185)*** | -0.430 | (0.624) |
| FOREIGN | -0.527 | (67.184)*** | -3.424 | (1.777) |
| NUMSEG | 0.137 | (45.882)*** | 0.246 | (0.111) |
| ROA | -0.019 | (0.010) | -2.634 | (1.108) |
| LOSS | -0.277 | (32.092)*** | 0.578 | (0.171) |
| BIG4 | 0.295 | (29.383)*** | -1.089 | (0.316) |
| EXPERTISE | 0.341 | (30.461)*** | 3.749 | (3.202)* |
| AUDIT_TENURE | 0.009 | (48.018)*** | 0.000 | (0.000) |
| OPINION | -0.397 | (9.842)*** | 27.200 | (0.131) |
| ICW | -0.061 | (0.625) | 0.403 | (0.101) |
| AUDITCHANGE | -0.063 | (0.669) | -1.044 | (0.975) |
| CEOTURN | -0.315 | (47.296)*** | 0.798 | (0.394) |
| CEO_TENURE | -0.008 | (16.073)*** | 0.236 | (4.404)** |
| CASHCOMP | 0.001 | (3.046)* | ||
| IMR | 0.848 | (0.033) | ||
| Industry fixed effect | Yes | Yes | ||
| N | 12,366 | 12,366 | ||
| Adj. R2 | 0.455 | 0.917 | ||
Note: Figures in parentheses are Wald chi-square statistics, and N represents the number of firm-year observations. Dummy for inside debt is an indicator variable, with a value equal to 1 if a company has a supplemental executive retirement plan or deferred compensation plan greater than 0, and 0 otherwise. CASHCOMP is CEO’s cash based compensation (Salary + Bonus). IMR is inverse Mill’s ratio, obtained from the first stage. All other variables are defined in Appendix 1. All independent variables are measured at the end of the fiscal year of the going-concern opinion. ***, **, and * indicate significance at the 1%, 5%, and 10% levels, respectively.
Earnings Management
Prior studies demonstrate that managements retaining higher CEO pensions are likely to be involved in earnings management. For instance, Kalyta (2009) reveals that CEOs conduct upward earnings management three to five years before retirement, as CEO pension amounts are generally determined according to the average compensation received from three to five years before retirement. Kwak & Mo (2017) argue that CEOs holding large pensions and facing bankruptcy manipulate their earnings upward to avoid or delay the bankruptcy. If auditors issue negative going-concern opinions after considering CEO pension amounts as a proxy for earnings management, rather than recognizing the CEO pension as a liability. It cannot argue that auditors reflect CEO pensions in their audit process. Thus, this study controls for the degree of firmspecific earnings management to address the endogeneity problem. It has used the year-industry modified Jones model developed by Kothari et al. (2005) as a proxy for firm-specific earnings management:
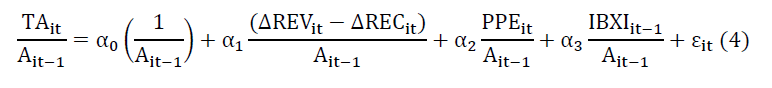
Where:
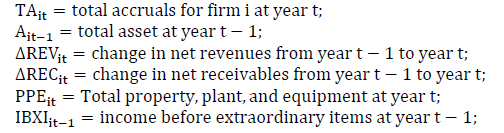
It was used the residual from model (4) to measure the amount of discretionary accruals and calculate the degree of earnings management by returning their absolute values (ABS_DA), add a dummy variable (Horizon problem) to indicate whether CEOs resign from firms within three years from the fiscal year end of each firm-year observation due to the endogeneity problem mentioned by Kalyta (2009). It was examine whether the main results in Table 3 remain unchanged even after adding the above two variables in model (1) as additional control variables. If the auditors recognize the CEO pension as a liability and issue a negative going-concern opinion, then it has obtain a significant coefficient of CEO Leverage even after controlling for earnings management-related variables. Alternatively, if the significance of the coefficient of CEO Leverage disappears, it can infer that the negative going-concern opinion is due to the auditors’ concern about earnings management, rather than a direct consideration of the CEO pension. Table 6 indicates that the coefficient of CEO Leverage is still statistically significantly positive at the 5% level, even after controlling for ABS_DA and Horizon problem. These empirical results support the prior analysis, in that auditors issue more negative going-concern opinions for firms that provide higher CEO pensions because auditors recognize the pensions as a liability rather than due to their concern with earnings management.
| Table 6 Earnings Management |
|||||
| Variable | Dependent Variable: GC | ||||
| Intercept | -27.389 | (0.113) | -22.576 | (0.090) | |
| CEO Leverage | 0.923 | (3.970) ** | 0.947 | (5.815) ** | |
| ABS_DA | -0.780 | (0.005) | |||
| Horizon problem | -0.368 | (0.154) | |||
| LNAT | -0.380 | (1.171) | -0.516 | (2.684) | |
| INVREC | 0.454 | (0.015) | -0.157 | (0.002) | |
| LEVERAGE | 4.480 | (5.081) ** | 2.605 | (3.801) * | |
| QUICK | -0.296 | (0.730) | -0.373 | (1.750) | |
| FOREIGN | -5.154 | (6.573) ** | -2.872 | (3.665) * | |
| NUMSEG | 0.451 | (0.762) | 0.105 | (0.050) | |
| ROA | -3.291 | (1.097) | -2.132 | (0.607) | |
| LOSS | 0.956 | (0.659) | 0.902 | (0.728) | |
| BIG4 | -2.144 | (1.863) | -1.352 | (1.117) | |
| EXPERTISE | 3.188 | (1.917) | 3.576 | (3.167) * | |
| AUDIT_TENURE | -0.030 | (0.324) | 0.000 | (0.000) | |
| OPINION | 30.427 | (0.139) | 27.424 | (0.133) | |
| ICW | 1.353 | (0.692) | 0.632 | (0.220) | |
| AUDITCHANGE | -1.305 | (1.228) | -0.967 | (0.954) | |
| CEOTURN | 1.186 | (1.350) | 0.826 | (0.788) | |
| CEO_TENURE | 0.340 | (3.802) * | 0.229 | (4.053) ** | |
| Industry fixed effect | Yes | Yes | |||
| N | 11,639 | 11,639 | |||
| Adj. R2 | 0.924 | -0.368 | (0.154) | ||
Note: Figures in parentheses are Wald chi-square statistics, and N represents the number of firm-year observations. ABS_DA is the absolute value of discretionary accrual obtained from a modified Jones model. Horizon problem is an indicator variable with a value equal to 1 if the CEO retires within two years from the current fiscal year end, and 0 otherwise. All other variables are defined in Appendix 1. All independent variables are measured at the end of the fiscal year of the going-concern opinion. ***, **, and * indicate significance at the 1%, 5%, and 10% levels, respectively.
Audit Fee and Audit Opinion
Auditors’ independence is an essential feature in determining their going-concern opinion. However, auditors may be reluctant to release negative going-concern opinion to retain clients that pay large audit fees. To alleviate the concerns, it was additionally control for audit fee and audit opinion, respectively.
Specifically, it add logged value of total audit fee (Total fee), audit fee (Audit fee), and non-audit fee (Non-audit fee) to the regression model (1), respectively. Table 7 presents the regression results. It shows that all coefficients of CEO Leverage remain significantly positive even after controlling for such audit fee-related variables.
| Table 7 Audit Fee |
|||||
| Variable | Dependent Variable: GC | ||||
| Intercept | -20.118 | (0.077) | -20.008 | (71.713) | (0.099) |
| CEO Leverage | 0.894 | (5.757)** | 0.881 | (0.371)** | (5.689)** |
| Total fee | -0.350 | (0.375) | |||
| Audit fee | -0.354 | (0.541) | |||
| Non-audit fee | (0.095) | ||||
| LNAT | -0.294 | (0.496) | -0.299 | (0.398) | (2.455) |
| INVREC | 0.862 | (0.065) | 0.963 | (3.437) | (0.006) |
| LEVERAGE | 2.694 | (3.915)** | 2.724 | (1.373)** | (3.755)* |
| QUICK | -0.343 | (1.631) | -0.353 | (0.270) | (1.748) |
| FOREIGN | -3.070 | (4.010)** | -3.114 | (1.543)** | (3.626)* |
| NUMSEG | 0.164 | (0.128) | 0.171 | (0.460) | (0.051) |
| ROA | -2.790 | (1.212) | -2.649 | (2.541) | (0.924) |
| LOSS | 0.594 | (0.360) | 0.609 | (0.993) | (0.476) |
| BIG4 | -1.403 | (1.094) | -1.421 | (1.341) | (1.438) |
| EXPERTISE | 3.520 | (3.226)* | 3.539 | (1.971)* | (3.454)* |
| AUDIT_TENURE | -0.004 | (0.009) | -0.002 | (0.042) | (0.000) |
| OPINION | 28.021 | (0.151) | 27.980 | (71.505) | (0.138) |
| ICW | 0.609 | (0.235) | 0.599 | (1.258) | (0.133) |
| AUDITCHANGE | -1.049 | (1.120) | -1.034 | (0.986) | (0.810) |
| CEOTURN | 1.127 | (1.605) | 1.105 | (0.884) | (1.324) |
| CEO_TENURE | 0.287 | (4.871)** | 0.289 | (0.131)** | (4.356)** |
| Industry fixed effect | Yes | Yes | |||
| N | 12,355 | 12,355 | |||
| Adj. R2 | 0.917 | 0.917 | |||
Note: Figures in parentheses are Wald chi-square statistics, and N represents the number of firm-year observations. Total fee is a logged value of the total audit fee (=audit fee + non-audit fee). Audit fee is a logged value of the audit fee. Non-audit fee is a logged value of the non-audit fee. All other variables are defined in Appendix 1. All independent variables are measured at the end of the fiscal year of the going-concern opinion. ***, **, and * indicate significance at the 1%, 5%, and 10% levels, respectively.
Table 8 shows the regression results additionally controlling for auditors’ opinion. (Audit opinion). Audit opinion is set at 5 for “unqualified opinion,” 4 for “the sum of unqualified and qualified opinions,” 3 for “qualified opinion,” 2 for “adverse opinion,” 1 for “a disclaimer of opinion,” and 0 for “no audit,” with a higher number indicating a better opinion4. The results on Table 7 present that the coefficient on Audit opinion is significantly negative but the coefficient on CEO leverage remains significantly positive, confirming our main regression results on Table 3.
| Table 8 Audit Opinion |
||
| Variable | Dependent Variable: GC | |
| Intercept | 2.257 | (0.005) |
| CEO Leverage | 1.423 | (4.219) ** |
| Audit opinion | -7.745 | (11.441) *** |
| LNAT | -1.031 | (4.239) ** |
| INVREC | -3.706 | (0.550) |
| LEVERAGE | 6.591 | (5.207) ** |
| QUICK | -1.628 | (4.596) ** |
| FOREIGN | -7.803 | (6.370) ** |
| NUMSEG | 1.559 | (3.384) * |
| ROA | -11.399 | (4.421) ** |
| LOSS | -2.773 | (1.793) |
| BIG4 | -1.685 | (0.798) |
| EXPERTISE | 3.691 | (1.235) |
| AUDIT_TENURE | -0.182 | (4.932) ** |
| OPINION | 51.673 | (2.299) |
| ICW | -2.990 | (2.828) * |
| AUDITCHANGE | -3.465 | (3.198) * |
| CEOTURN | 5.352 | (7.880) *** |
| CEO_TENURE | 0.892 | (10.206) *** |
| Industry fixed effect | Yes | |
| N | 12,366 | |
| Adj. R2 | 0.948 | |
Note: Figures in parentheses are Wald chi-square statistics, and N represents the number of firm-year observations. Audit opinion is 5 for “unqualified opinion,” 4 for “unqualified opinion or qualified opinion,” 3 for “qualified opinion,” 2 for “adverse opinion,” 1 for “disclaimer of opinion,” and 0 for “no audit opinion.” All other variables are defined in Appendix 1. All independent variables are measured at the end of the fiscal year of the going-concern opinion. ***, **, and * indicate significance at the 1%, 5%, and 10% levels, respectively.
Conclusion
This study examines whether auditors consider CEO pensions when planning their audit process, especially when making going-concern opinions. It was empirically discover that auditors focus more on the pension’s debt-like characteristics when determining their goingconcern opinions. This study contributes to literature in several ways. First, it expands the research on CEO pensions to include auditors. While recent research has focused on whether various market participants understand how CEO pensions affect CEOs’ decision making, this study reveals that auditors do not significantly consider how CEO pensions affect CEOs’ behavior. It is also add new empirical evidence to auditing literature by introducing the CEO pension as a factor that auditors consider in their audit process.
Acknowledgement
The corresponding author is Nayoung Yoon, Korea Advanced Institute of Science and Technology.
Endnotes
1. CEO pensions are commonly called as “Supplemental Executive Retirement Plans,” or “SERPs.” In addition, Bebchuk & Fried (2004) blame those boards are able to camouflage tremendous amounts of executive compensation by using such retirement pension plans.
2. Bebchuk and Jackson’s (2005) three examples assist with an intuitive understanding of the sizable nature of CEO pensions. First, Henry A. McKinnell, Jr., former Pfizer CEO, received pension benefits of 8.3 billion dollars in 2003, exceeding his total compensation, or the sum of such non-equity-based compensation as salaries and bonuses and equity compensation, from 2001 to 2003. Second, William W. McGuire, former UnitedHealth Group CEO, received 4.5 billion dollars in pension benefits in 2003, or more than three times his total 2003 compensation of one million dollars. Third, Nolan D. Archibald, former Black and Decker CEO, received four million dollars of pension benefits despite having served as CEO for only three years; interestingly, the present value of these pension benefits was 0.65% of the firm’s total equity value.
3. It has focus on going-concern opinions rather than audit fees because the CEO pension issues more closely relate to bankruptcy risk than to misreporting risk. However, even if earnings management has the strongest influence upon both audit fees and opinions, auditors might reflect the fact that CEO pensions motivate CEOs to reduce bankruptcy risk in their audit fees or opinions. Thus, this study additionally controls for audit fees and opinions. Tables 7 and 8 illustrate that the positive relationship between CEO pensions and going-concern opinion are not affected by audit fees or opinions.
4. It has obtained consistent results when the dependent variable is set at 1 for unqualified opinions and 0 otherwise.
| Appendix 1 Variable definitions |
|
| Variables | Definition |
| GC | Indicator variable with a value equal to 1 if an auditor issues a going-concern opinion (GOING_CONCERN in AuditAnalytics), and 0 otherwise |
| CEO Leverage | Relative ratio of the CEO’s debt-to-equity holdings, calculated as the sum of the present value of the CEO’s supplemental executive retirement plan (PENSION_VALUE_TOT in ExecuComp) and the total value of deferred compensation plan (DEFER_BALANCE_TOT in ExecuComp), divided by the total value of the CEO’s stock (SHROWN_EXCL_OPTS*PRCCF in ExecuComp) and option holdings (OPT_UNEX_EXER_VAL+OPTUNEX_UNEXER_VAL in ExecuComp) |
| LNAT | Natural logarithm value of total assets (AT in Compustat) |
| INVREC | Receivables (RECT in Compustat) and inventory (INVT in Compustat) divided by total assets (AT in Compustat) |
| LEVERAGE | Total liability (LT in Compustat) scaled by total assets |
| QUICK | Liquidity, calculated as current assets (ACT in Compustat) minus inventory, scaled by current liabilities (LCT in Compustat) |
| FOREIGN | Indicator variable with a value equal to 1 if foreign sales (SALES in Compustat Segment) are greater than 0, and 0 otherwise. |
| NUMSEG | Natural logarithmic value of the number of business segments (firm observations in Compustat Segment database) |
| ROA | Return on assets, calculated by net income before extraordinary items (IB in Compustat), scaled by total assets |
| LOSS | Indicator variable with a value equal to 1 if net income (NI in Compustat) is less than 0, and 0 otherwise |
| BIG4 | Indicator variable with a value equal to 1 if the auditor is from a Big 4 company (i.e., 1 if the AU in Compustat is one of 4,5,6, and 7), and 0 otherwise |
| EXPERTISE | Auditor’s industry-specialized experience, calculated as the audit firm’s industry market share in a four-digit SIC code industry based on client sales revenue (SALE in Compustat) |
| AUDIT_TENURE | Auditor tenure, calculated as the number of years the auditor has been with the audit company |
| OPINION | Indicator variable with a value equal to 1 if a going-concern opinion was issued during last two years, and 0 otherwise |
| ICW | Indicator variable with a value equal to 1 if an auditor addresses inefficient internal control or material weakness in the internal control system (i.e., if AUOPIC in Compustat is 1), and 0 otherwise |
| AUDITCHANGE | Indicator variable with a value equal to 1 if the auditor changed within the year, and 0 otherwise |
| CEOTURN | Indicator variable with a value equal to 1 if the CEO changed within the year, and 0 otherwise |
| CEO_TENURE | CEO tenure, calculated as the number of years the CEO has been with the company |
References
- Bebchuk, L.A., & Fried, J.M. (2005). Pay without performance: Overview of the issues. Journal of Applied Corporate Finance, 17(4), 8-23.
- Bebchuk, L.A., & Jackson Jr, R.J. (2005). Executive pensions. National Bureau of Economic Research.
- Bedard, J. (1989). Expertise in auditing: Myth or reality? Accounting, Organizations and Society, 14(2), 113-131.
- Bedard, J.C., & Johnstone, K.M. (2004). Earnings manipulation risk, corporate governance risk, and auditors' planning and pricing decisions. The Accounting Review, 79(2), 277-304.
- Bell, T.B., Landsman, W.R., & Shackelford, D. A. (2001). Auditors' perceived business risk and audit fees: Analysis and evidence. Journal of Accounting Research, 39(1), 35-43.
- Brockman, P., Martin, X., & Unlu, E. (2010). Executive compensation and the maturity structure of corporate debt. The Journal of Finance, 65(3), 1123-1161.
- Cassell, C.A., Huang, S.X., Sanchez, J.M., & Stuart, M.D. (2012). Seeking safety: The relation between CEO inside debt holdings and the riskiness of firm investment and financial policies. Journal of Financial Economics, 103(3), 588-610.
- Chen, Y., Gul, F.A., Veeraraghavan, M., & Zolotoy, L. (2015). Executive equity risk-taking incentives and audit pricing. The Accounting Review, 90(6), 2205-2234.
- Coles, J.L., Daniel, N.D., & Naveen, L. (2006). Managerial incentives and risk-taking. Journal of Financial Economics, 79(2), 431-468.
- Davis, L.R., Ricchiute, D.N., & Trompeter, G. (1993). Audit effort, audit fees, and the provision of nonaudit services to audit clients. Accounting Review, 135-150.
- Edmans, A., & Liu, Q. (2010). Inside debt. Review of Finance, 15(1), 75-102.
- Fargher, N., Jiang, A., & Yu, Y. (2014). How do auditors perceive CEO's risk taking incentives? Accounting & Finance, 54(4), 1157-1181.
- Hanlon, M., Rajgopal, S., & Shevlin, T. (2003). Are executive stock options associated with future earnings? Journal of Accounting and Economics, 36(1-3), 3-43.
- Heckman, J. (1979). Sample Selection Bias as a Specification Error. Econometrica, 47 (1).
- Jayaraman, S., & Milbourn, T. (2014). CEO equity incentives and financial misreporting: The role of auditor expertise. The Accounting Review, 90(1), 321-350.
- Jensen, M.C., & Meckling, W.H. (1976). Theory of the firm: Managerial behaviour, agency costs and ownership structure. Journal of Financial Economics, 3(4), 305-360.
- Johnstone, K.M. (2000). Client-acceptance decisions: Simultaneous effects of client business risk, audit risk, auditor business risk, and risk adaptation. Auditing: A Journal of Practice & Theory, 19(1), 1-25.
- Kai, L., & Prabhala, N.R. (2007). Self-selection models in corporate finance. In Handbook of empirical corporate finance. Elsevier.
- Kalyta, P. (2009). Accounting discretion, horizon problem, and CEO retirement benefits. The Accounting Review, 84(5), 1553-1573.
- Kim, Y., Li, H., & Li, S. (2015). CEO equity incentives and audit fees. Contemporary Accounting Research, 32(2), 608-638.
- Kothari, S.P., Leone, A.J., & Wasley, C.E. (2005). Performance matched discretionary accrual measures. Journal of Accounting and Economics, 39(1), 163-197.
- Kwak, B., & Mo, K. (2018). Executive pension, default risk, and earnings management. Asia-Pacific Journal of Accounting & Economics, 25(4), 463-480.
- Lambert, R.A., & Larcker, D.F. (1987). An analysis of the use of accounting and market measures of performance in executive compensation contracts. Journal of Accounting Research, 85-125.
- Larcker, D.F., & Rusticus, T.O. (2010). On the use of instrumental variables in accounting research. Journal of Accounting and Economics, 49(3), 186-205.
- Lennox, C.S., Francis, J.R., & Wang, Z. (2011). Selection models in accounting research. The Accounting Review, 87(2), 589-616.
- Low, A. (2009). Managerial risk-taking behavior and equity-based compensation. Journal of Financial Economics, 92(3), 470-490.
- McConnell, J.J., & Servaes, H. (1990). Additional evidence on equity ownership and corporate value. Journal of Financial Economics, 27(2), 595-612.
- Mock, T.J., & Wright, A. (1993). An exploratory study of auditors' evidential planning judgments. Auditing, 12(2), 39.
- Morck, R., Shleifer, A., & Vishny, R.W. (1988). Management ownership and market valuation: An empirical analysis. Journal of Financial Economics, 20, 293-315.
- Murphy, K.J. (1985). Corporate performance and managerial remuneration: An empirical analysis. Journal of Accounting and Economics, 7(1-3), 11-42.
- O'Keefe, T.B., Simunic, D.A., & Stein, M.T. (1994). The production of audit services: Evidence from a major public accounting firm. Journal of Accounting Research, 241-261.
- Phan, H.V. (2014). Inside debt and mergers and acquisitions. Journal of Financial and Quantitative Analysis, 49 (5-6), 1365-1401.
- Rosenbaum, P.R., & Rubin, D.B. (1983). The central role of the propensity score in observational studies for causal effects. Biometrika, 70(1), 41-55.
- Sun, F., Wu, F., & Li, S.F. (2014). CEO inside debt and audit fees. International Journal of Auditing, 18(1), 2-13.
- Sundaram, R.K., & Yermack, D.L. (2007). Pay me later: Inside debt and its role in managerial compensation. The Journal of Finance, 62(4), 1551-1588.
- Wang, C., Xie, F., & Xin, X. (2013). Managerial ownership of debt and corporate financial reporting.
- Wei, C., & Yermack, D. (2011). Investor reactions to CEOs' inside debt incentives. The Review of Financial Studies, 24(11), 3813-3840.