Research Article: 2018 Vol: 22 Issue: 4
CEO Pension and Selling, General and Administrative Cost Stickiness
Kyoungwon Mo, Chung-Ang University
Kyung Jin Park, Myongji University
YoungJin Kim, Korea Advanced Institute of Science and Technology
Abstract
Using CEO pension as inside debt, we show how inside debt affects cost stickiness. Inside debt was recently recognized as debt-based compensation that increases managers’ risk aversion. More risk adverse managers will reduce cost stickiness if it suits their self-interest. We empirically find that inside debt decreases cost stickiness, which implies that cost stickiness is mainly driven by overconfident CEOs’ intentions to benefit them. Our results show that inside debt can mitigate the agency problem in cost stickiness.
Keywords
CEO Pension, Cost stickiness, Agency problem, Inside Debt.
Introduction
As a firm has equity-financing and debt-financing, Chief Executive Officer (CEO) compensation also consists of equity-and debt-based components. Stocks and options granted to CEOs are examples of equity-based compensation, which is the subject of many studies and received a lot of attention from researchers. However, debt-based compensation has been less examined. Recently, some researchers are focusing on the Defined Benefit (DB) retirement pension plan as the CEO’s debt-based compensation because it is viewed as unsecured and unfunded liabilities against the firm. The CEO’s debt-based compensation, or “inside debt”, impacts the firm in various ways, primarily by increasing the CEO’s risk aversion, as debt does for creditors. A more risk-averse CEO will lead the firm as a firm with a high debt ratio, as many empirical studies show. Firms with more inside debt file bankruptcy less often (Sundaram & Yermack, 2007), enjoy a lower cost of debt, but embrace a higher cost of equity (Wei & Yermack, 2011; Anantharaman et al., 2013); engage in more diverse activities and less risky activities, such as R&D; and have with lower stock volatility, lower leverage and higher liquidity (Cassell et al., 2012); and adopt more conservative accounting policies (Wang et al., 2017).
In this study, we document one potential path through which inside debt affects the agency problem. Specifically, we examine whether inside debt mitigates the cost stickiness induced by managerial overconfidence. We find that costs to respond differently to sales increases and decrease (Anderson et al., 2003). More exactly, when sales decrease, costs decline by an amount less than that by which costs rise when the sales increase. This phenomenon is termed “cost stickiness” and supported by subsequent research (Anderson et al., 2007; Banker & Chen, 2006; Banker et al., 2014; Chen et al., 2012; Via & Perego, 2014; Kuang et al., 2015).
Among these studies, some argue that this asymmetry in cost behavior arises from the firm’s optimal decision. This can be true when the sales drop is temporary and retaining slack resources is less expensive than reducing the costs immediately and increasing them later. For example, if the cost of breaking the incumbent contact is more expensive than the cost of maintaining slack resources, then it can be optimal to retain the contract and the transitory slack resources despite the sales drop. On the contrary, other researches find that the main reason for the cost stickiness in the agency problem is that self-interested managers seek to build their empires by maintaining slack resources, thereby benefiting themselves. Especially, managerial overconfidence demonstrates a higher degree of cost stickiness (Chen et al., 2013; Kuang et al., 2015), as they positively posit that the sales drop is temporary.
As prior studies find mixed results for the reasons for cost stickiness, to determine the dominant reason, we introduce inside debt into cost stickiness analysis. Since an increase in inside debt has similar effects to those of an increase in the debt ratio, the manager will be more risk averse. We hypothesize that cost stickiness arises primarily from the manager’s self-interest, or agency problem; in this case, a more risk adverse manager will choose more conservative policies. This will lead the manager to reduce cost stickiness and lower costs as sales fall.
Using a U.S. sample from 2006 to 2015, we empirically show that the existence of inside debt decreases the cost stickiness, with both Anderson et al. (2007) and Homburg & Nasev’s (2008) cost-stickiness models. Additional tests using an alternative measure of CEO overconfidence and institutional monitoring as a manager-disciplining factor also confirm our hypotheses and main results.
Our study contributes to the cost stickiness literature, as we add supporting evidence for agency problem as a driving factor in cost stickiness. Existing cost-stickiness studies have not yet reached a conclusion as to whether to view the cost stickiness phenomenon as benefiting the firm and shareholder, or only the managers. Our study provides an additional result to clarify and better understand cost stickiness.
Our study also contributes to inside debt studies. Compared to CEOs’ equity-based compensation, fewer studies exist on debt-based compensation. Using CEO pension as inside debt, we examine how inside debt affects manager’s behavior related to costs, especially cost stickiness. Our results of inside debt’s significant association with cost stickiness shed light on inside debt’s additional impact on corporation which has been unexplored so far. Although Im et al. (2018) examine the relationship between CEO inside debt holdings and asymmetric cost behavior, our paper uses different and various cost behavior models.
Theory And Hypothesis
Cost Stickiness
Since Anderson et al. (2003) argued the empirical existence of cost stickiness, a large stream of literature documented why this asymmetric phenomenon happens. The reasons mentioned in this stream of literature can primarily be divided into the economic and agency factors (Chen et al., 2012; Kuang et al., 2015). The economic factor as a driver of cost stickiness indicates that the managers maintain corporate costs, even if sales decrease because it is considered optimal to retain the costs rather than reducing them. This interpretation can be valid if the sales drop is expected to be temporary and adjusting the costs downward and recovering the cutback is expensive, and/or this decision maximizes firm value (Abel & Eberly, 1994). In contrast, the agency factor as a driver of cost stickiness implies that maintaining slack resources for a sales drop benefits the manager, not the firm and especially benefits the manager’s intention of empire building. These self-interested managers pursue their private interests by refraining from cutbacks in size such as in the labor force or resources. Thus, the extent of cost stickiness in this case can be considered as the degree of agency problem between managers and shareholders. Prior studies already show that the level of the Sales, General and Administrative (SG&A) cost stickiness was reduced and the SG&A cost approached the optimal level from the shareholders’ viewpoint. Various studies find evidence of the agency factor in cost stickiness, either empirically or through case analyses (Banker & Chen, 2006; Chen et al., 2012; Balakrishnan & Gruca, 2008; Cohen et al., 2008; Diervnck et al., 2012; Kama & Weiss, 2013; Roychowdhury, 2006). Interdisciplinary studies combined with psychology theory also find that overconfident CEOs tend to enlarge the degree of cost stickiness or deviate from the optimal cost level (Chen et al., 2013; Kuang et al., 2015). This cost stickiness as an agency problem is prominent in overconfident CEOs, as they delude themselves that the sales drop will be temporary.
In summary, the economic factor as a driver of cost stickiness aims to enhance firm value, whereas the agency factor as a driver of cost stickiness worsens firm value. Controversies remain concerning whether cost stickiness harms shareholders or not. We introduce CEO pensions in order to clarify the dominant factor and the net effect of cost stickiness on firm.
CEO Pension
According to agency theory, CEO compensation is supposed to have a structure similar to the debt-to-equity ratio of the firm he or she manages. This theoretical justification for a similarity in the debt-to-equity ratio between CEO compensation and the firm stems from the ideal alignment of both sides’ interests. This alignment enables an alignment between the manager’s incentives and those of shareholders and debt holders based on the firm’s financial structure (Jensen & Meckling, 1976; Edmans & Liu, 2011). An extensive literature documents equity-based CEO compensation (Murphy, 1985; Lambert & Larcker, 1987; Morck et al., 1988; McConnell & Servaes, 1990; Hanlon et al., 2003; Coles et al., 2006; Yan & Zhang, 2009; Brockman et al., 2010) but there are relatively fewer studies of debt-based CEO compensation, as there are differences in the specific characteristics between the firm’s debt and debt-based compensation.
Regarding debt-based compensation, recent studies suggest CEO pensions as an adequate example. Indeed, financial statement record CEO pensions as liabilities at the point when the future payment is determined and these liabilities are removed when the actual payment is implemented. Because future payments of CEO pensions are determined periodically, CEO pensions carry features similar to the firm’s debt (Kwak & Mo, 2017). Furthermore, empirical studies show that firms with more CEO pensions behave similarly to firms with a higher debt ratio. As with higher-debt-ratio firms, higher-CEO-pension firms behave more conservatively; they also have lower bankruptcy risk (Sundaram & Yermack, 2007); a lower cost of debt and higher cost of equity (Wei & Yermack, 2011; Anantharaman et al., 2013), less risky behaviors, such as lower volatility in stock returns, R&D expenditures and leverage ratio; a higher degree of diversification and liquidity (Cassell et al., 2012); fewer mergers and acquisitions activities which may lead to higher default risk (Phan, 2014); more conservative accounting policies (Wang et al., 2017); less participation in earnings management (He, 2015); and less engagement in tax shelter transactions, which may lead to higher volatility in cash flows (Chi et al., 2017).
Hypothesis Development
In this study, we intend to relate cost stickiness and CEO pensions to investigate whether cost stickiness benefits only managers at the sacrifice of shareholders, or affects shareholders positively by increasing firm value, in net effect.
As noted above, the CEO compensation structure affects the conservatism of managers’ corporate decisions. For example, Bruggen & Zehnder (2014) observe that managers with only equity-based compensation incurred greater SG&A cost stickiness. They interpreted this result as a supporting evidence for the positive (or economic) factor of cost stickiness, as fully equitybased compensation should lead managers to faithfully serve the shareholders for his/her identical financial structure.
Similarly, CEO pensions can correspond to an increase in liabilities, and can then be expected to lead to a higher default risk, and thereby increase managers’ risk aversion. If cost stickiness arises mainly from the manager’s good intention of enhancing firm value, then the increased default risk will induce the manager to raise cost stickiness, as higher cost stickiness in this case is expected to improve firm value and lower the default risk. In short, the economic factor of cost stickiness predicts a positive association between CEO pensions and cost stickiness. On the contrary, if cost stickiness is due primarily to the manager’s self-interest, then a manager with increased risk aversion will be more conservative and pessimistic about the firm’s future performance. This will lead the manager to adopt a more conservative accounting policy and provides him/her with less incentive to retain slack resources if sales drop. This will reduce cost stickiness. In short, the agency factor of cost stickiness implies a negative association between CEO pensions and cost stickiness. In this way, we can determine whether the cost stickiness benefits or harms shareholders using CEO pensions.
We formally state our hypothesis as the following two contradictory statements:
H1: If the economic factor exceeds the agency factor, CEO pensions have a positive relation with SG&A cost stickiness.
H2: If the agency factor exceeds the economic factor, CEO pensions have a negative relation with SG&A cost stickiness.
Research Methodology
Data
To examine the impact of CEO risk averseness caused by CEO pensions on cost stickiness, we extract SG&A cost and firm characteristics data from COMPUSTAT and CEO pension’s data from ExecuComp databases. Combining these two databases generates 12,714 firm-year observations ranging from 2006 to 2015, after excluding financial firms with Standard Industrial Classification (SIC) codes 6000-6999. Our sample period starts from 2006 because the Securities and Exchange Commission (SEC) forced the U.S.-listed firms to announce the information about CEO pension plans from 2006. Since then, ExecuComp has provided the electronic pensions data.
Cost Stickiness Specification
We estimate cost stickiness using two specification models devised by Anderson et al. (2007) and Homburg & Nasev (2008).
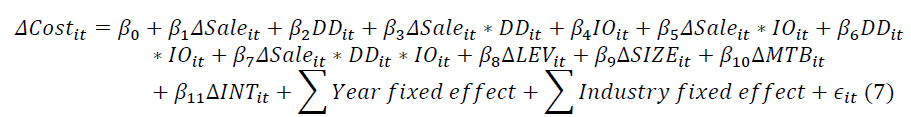
First, we follow Anderson et al.’s (2007) time-series regression model, as follows.

Where,
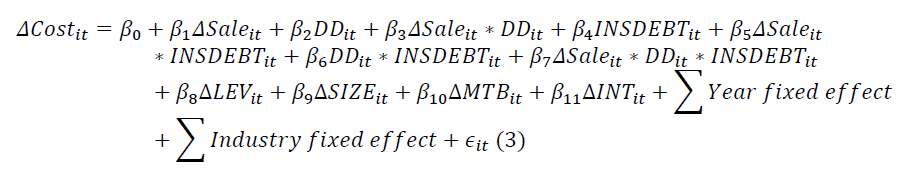
ΔCosti,t: natural logarithm of change (Costi,t/Costi,t–1) in the cost elements of firm i in year t relative to year t–1.
ΔSalei,t: natural logarithm of change (Salei,t/Salei,t–1) in the sales of firm i in year t relative to year t–1.
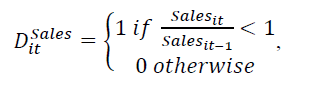
DDi,t: 1 if sales decrease (Salei,t<Salei,t–1) and 0 otherwise.
In this equation, β1 captures change in costs in response to a change in sales, and we expect a positive value; as sales increase (decrease) will lead to a rise (fall) in costs. However, if a difference in the extent of change exists according to whether it is an increase or decrease in sales, or the asymmetric cost stickiness, as prior studies observe, β3 will have a significantly positive value. In other words, β3 measures the degree of cost stickiness. Second, we alternatively employ Homburg & Nasev’s (2008) cost stickiness model, in which they define cost stickiness as follows:

Where:
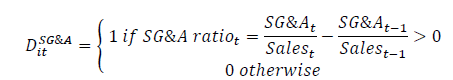
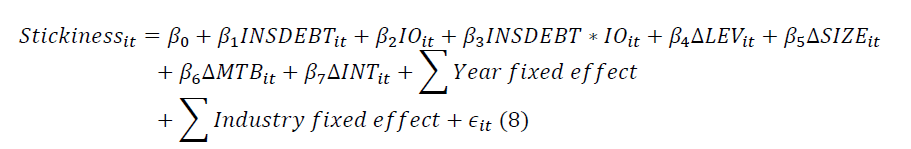
In this model, a positive value of Stickiness measures the degree of cost stickiness. This method, based on the conditional cost-to-sales ratio (SG&A ratio), differs from Anderson et al. (2007) model in that it can estimate cost stickiness for each firm-year level.
CEO risk averseness specification
Following the prior literature (Sundaram & Yermack, 2007; Campbell et al., 2011; Cassell et al., 2012; Wang et al., 2017; Phan, 2014), we calculate the level of CEO risk aversion induced by CEO pensions in three steps. First, we calculate CEO leverage as the ratio of CEO pensions to equity-based compensation. The amount of CEO pension is the sum of the present values of the CEO pension and deferred compensation reported in ExecuComp. The CEO’s equity-based compensation is calculated by adding the total value of options-based and stockbased compensations. Second, we measure the ratio of CEO leverage to firm leverage as the firm’s total debt-to-equity ratio. Finally, we create a dummy variable (INSDEBT) that takes the value of 1 if the ratio of CEO leverage to firm leverage is greater than 1 and 0 otherwise. CEOs whose INSDEBT=1 are classified as risk averse.
Main regression model
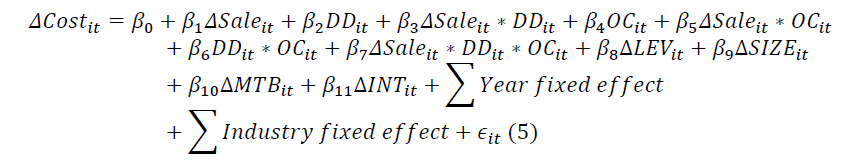
To examine the impact of CEO pensions on cost stickiness, we use regression analyses with modifications to the cost stickiness models mentioned above. First, we modify Anderson et al.’s (2007) cost stickiness model by including INSDEBT and interact it with the other independent variables.
In this model, since a negative coefficient on 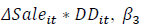 implies cost-stickiness,
a positive coefficient on
implies cost-stickiness,
a positive coefficient on  implies that CEO risk aversion
reduces cost-stickiness, supporting the agency factor over the economic factor of cost stickiness
(H2). In contrast, a negative β7 value supports the economic factor over the agency factor of
cost stickiness (H1). Following prior studies (Anderson et al., 2003; Chen et al., 2012; Chen et
al., 2013; Wang et al., 2017; Bruggen & Zehnder, 2014; Kuang et al., 2015), we control for the
one-year change in leverage
implies that CEO risk aversion
reduces cost-stickiness, supporting the agency factor over the economic factor of cost stickiness
(H2). In contrast, a negative β7 value supports the economic factor over the agency factor of
cost stickiness (H1). Following prior studies (Anderson et al., 2003; Chen et al., 2012; Chen et
al., 2013; Wang et al., 2017; Bruggen & Zehnder, 2014; Kuang et al., 2015), we control for the
one-year change in leverage  firm size
  market-to-book ratio
  and
inventory turnover
and
inventory turnover  We convert the control variables to the natural logarithm value to
be normally standardized.
We convert the control variables to the natural logarithm value to
be normally standardized.
Second, by using Stickiness obtained from Homburg & Nasev’s (2008) model as the dependent variable, we develop the following ordinary least square (OLS) regression model:
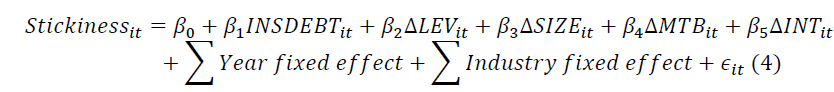
If the economic factor surpasses managers’ self-interest intention in cost stickiness, CEO
risk aversion will increase the cost stickiness as hypothesized in H1, and thus the coefficient
on 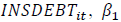 will be positive. However, if the agency factor dominates the economic
factor in cost stickiness, CEO risk aversion will reduce cost stickiness as hypothesized in H2,
leading to a negative β1 value. We include the four control variables, the one-year change in
leverage
will be positive. However, if the agency factor dominates the economic
factor in cost stickiness, CEO risk aversion will reduce cost stickiness as hypothesized in H2,
leading to a negative β1 value. We include the four control variables, the one-year change in
leverage  firm size
  market-to-book ratio
  and inventory turnover
  in this equation as in the modification of Anderson et al.’s (2007) cost stickiness model
above.
in this equation as in the modification of Anderson et al.’s (2007) cost stickiness model
above.
Additionally, to alleviate concerns about the year dependencies in our hypothesized relationship, we computed Fama-MacBeth coefficients for a more robust analysis. The Fama- MacBeth analysis is less influenced by a potential spurious time trend. Finally, we winsorized all continuous variables at the top and bottom 1% to eliminate the impact of outliers.
Results
Descriptive Statistics
Table 1 presents the summary statistics for the dependent and independent variables in the final sample of 12,714 firm-years. The mean of Stickiness is 0.012 with high frequency of zero observations as it is defined. The means of ΔCost and ΔSale are 0.063 and 0.059, respectively. The positive means of ΔCost and ΔSale imply that our sample firms’ costs and sales generally increase during our sample period. Our main independent variable of interest, INSDEBT, has a mean of 0.266, implying that, on average, 26.6% of our sample firms provide CEO pensions large enough to induce risk aversion within the CEO. However, it is low compared to the ratios reported by Sundaram & Yermack (2007) and Bebchuk & Jackson Jr. (2005), possibly because the sample from the ExecuComp database includes S&P 1500 companies, and is smaller than those used in these previous studies are. The summary statistics of the other variables are generally similar to those in the prior literature mentioned above.
| Table 1 Descriptive Statistics |
|||||
| Variables | Mean | Median | S.D. | Q1 | Q3 |
| Stickiness | 0.012 | 0 | 0.289 | 0 | 0 |
| ∆Cost | 0.063 | 0.058 | 0.158 | -0.013 | 0.135 |
| ∆Sale | 0.059 | 0.061 | 0.194 | -0.018 | 0.146 |
| INSDEBT | 0.266 | 0 | 0.442 | 0 | 1 |
| ∆LEV | -0.039 | -0.002 | 0.399 | -0.188 | 0.15 |
| ∆SIZE | 0.069 | 0.05 | 0.2 | -0.024 | 0.136 |
| ∆MTB | -0.018 | 0.008 | 0.434 | -0.23 | 0.214 |
| ∆INT | 0.011 | -0.001 | 0.191 | -0.076 | 0.082 |
Correlation
Table 2 presents the Pearson (upper-right triangle) and Spearman (lower-left triangle) correlations among the dependent and independent variables in the final sample of 12,714 firmyears.
| Table 2 Correlation Matrix |
|||||||||
| Variables | 1 | 2 | 3 | 4 | 5 | 6 | 7 | 8 | |
| 1 | Stickiness | 0 | 0.011 | -0.094 | -0.015 | -0.032 | -0.049 | -0.009 | 0.066 |
| 0 | -0.232 | 0 | -0.1 | 0 | 0 | -0.315 | 0 | ||
| 2 | ∆Cost | -0.347 | 0 | 0.695 | -0.087 | -0.08 | 0.495 | -0.096 | -0.187 |
| 0 | 0 | 0 | 0 | 0 | 0 | 0 | 0 | ||
| 3 | ∆Sale | -0.668 | 0.719 | 0 | -0.074 | -0.024 | 0.551 | -0.065 | -0.441 |
| 0 | 0 | 0 | 0 | -0.007 | 0 | 0 | 0 | ||
| 4 | INSDEBT | 0.015 | -0.091 | -0.09 | 0 | 0.034 | -0.083 | 0.007 | -0.013 |
| -0.096 | 0 | 0 | 0 | 0 | 0 | -0.455 | -0.141 | ||
| 5 | ∆LEV | -0.009 | -0.065 | -0.031 | 0.029 | 0 | -0.079 | -0.192 | -0.056 |
| -0.285 | 0 | 0 | -0.001 | 0 | 0 | 0 | 0 | ||
| 6 | ∆SIZE | -0.36 | 0.501 | 0.574 | -0.075 | -0.065 | 0 | -0.101 | 0.485 |
| 0 | 0 | 0 | 0 | 0 | 0 | 0 | 0 | ||
| 7 | ∆MTB | -0.014 | -0.078 | -0.043 | 0.001 | -0.102 | -0.058 | 0 | -0.047 |
| -0.124 | 0 | 0 | -0.907 | 0 | 0 | 0 | 0 | ||
| 8 | ∆INT | 0.337 | -0.209 | -0.404 | -0.004 | -0.029 | 0.385 | -0.033 | 0 |
| 0 | 0 | 0 | -0.688 | -0.001 | 0 | 0 | 0 | ||
Note: This table presents the Pearson (upper-right triangle) and Spearman (down-left triangle) correlations among the dependent/independent variables in the final sample of 12,714 firm-years. The numbers in parentheses represents p-values.
In this Table 2, especially the correlation between CEO’s risk aversion (INSDEBT) and Stickiness draws our attention. However, we see different signs between the Pearson and Spearman correlation coefficients of these two variables. The correlation coefficient between INSDEBT and Stickiness is significantly negative according to Pearson’s method, while it is significantly positive according to Spearman’s method. This mixed result may arise from each correlation coefficient method’s defects. The Pearson method might be vulnerable to outlier’s effects, while the Spearman method may ignore the not exceedingly, but still extant, differences among observations that should be considered. This result rather requires more deliberate and carefully designed statistical analysis in this empirical research. Not to ignore the extant difference among observations, in the multivariate regression analysis, we do not replace the original value with the rank-dependent values as in the Spearman coefficient, and to control for the extreme outliers’ effect, we winsorize at the one percent level as mentioned before.
Regression Analysis
Table 3 displays our main regression results using the modified Anderson et al. (2007) model. Our empirical analysis uses various models, all of which indicate the existence of cost stickiness, as we see in the significantly negative coefficient of ΔSale*DD. Looking at the impact of CEO’s inside debt or CEO pensions, we observe a substantial difference in the coefficient of ΔSale*DD between models (3) and (4). The coefficient of ΔSale*DD is -0.086 for the sample with CEO pensions (model (3)) and -0.213 for the sample without CEO pensions (model (4)). This implies a potential difference in the extent of cost stickiness according to whether CEO pensions exist or not. The result in model (5) confirms our hypothesis. As expected, the coefficient of ΔSale*DD*INSDEBT has a significant value; we therefore observe that CEO pensions are significantly correlated with cost stickiness. The significant positive value of this coefficient supports H2, or the agency factor of cost stickiness, as this means that CEO pensions reduce cost stickiness. This indicates that the agency factor exceeds the economic factor in SG&A cost stickiness.
| Table 3 The Impact Of Ceo Pension On Sg & A Cost Stickiness |
|||||
| Dependent variable = ∆Cost | |||||
| Baseline Model | Baseline Model | INSDEBT = 1 | INSDEBT = 0 | Pooling Model | |
| Independent variable | (1) | (2) | (3) | (4) | (5) |
| Intercept | -0.012 | -0.009 | -0.008 | -0.008 | -0.010 |
| (-0.63) | (-0.50) | (-0.29) | (-0.33) | (-0.53) | |
| ∆Sale | 0.620*** | 0.526*** | 0.387*** | 0.543*** | 0.539*** |
| (68.77) | (20.07) | (6.59) | (18.28) | (20.33) | |
| DD | -0.022*** | -0.023*** | -0.027*** | -0.022*** | -0.022*** |
| (-7.20) | (-7.64) | (-5.38) | (-6.09) | (-6.26) | |
| ∆Sale*DD | -0.232*** | -0.199*** | -0.086*** | -0.213*** | -0.211*** |
| (-15.35) | (-13.20) | (-2.91) | (-11.89) | (-12.50) | |
| INSDEBT | 0.004 | ||||
| (0.94) | |||||
| ∆Sale*INSDEBT | -0.096*** | ||||
| (-4.08) | |||||
| DD*INSDEBT | -0.006 | ||||
| (-0.95) | |||||
| ∆Sale*DD*INSDEBT | 0.103*** | ||||
| (2.96) | |||||
| ∆LEV | -0.024*** | -0.012** | -0.026*** | -0.024*** | |
| (-9.23) | (-2.08) | (-8.66) | (-9.07) | ||
| ∆SIZE | 0.121*** | 0.162*** | 0.114*** | 0.119*** | |
| (4.73) | (2.80) | (3.93) | (4.66) | ||
| ∆MTB | -0.021*** | 0.001 | -0.026*** | -0.021*** | |
| (-7.89) | (0.23) | (-8.36) | (-7.82) | ||
| ∆INT | -0.019 | -0.055 | -0.015 | -0.018 | |
| (-0.74) | (-0.99) | (-0.54) | (-0.73) | ||
| Year-fixed effect | Yes | Yes | Yes | Yes | Yes |
| Industry-fixed effect | Yes | Yes | Yes | Yes | Yes |
| Adj. R2 | 0.505 | 0.524 | 0.453 | 0.536 | 0.524 |
| F-value | [186.28] *** | [189.76] *** | [537.56] *** | [146.74] *** | [180.65] *** |
| N | 12,714 | 12,714 | 3,388 | 9,326 | 12,714 |
Note: This table reports the regression results of the impact of CEO pensions on cost stickiness according to Anderson et al.’s (2007) model using 12,714 firm-year observations for 2006-2015. The t-statistics are reported in parentheses. ***, **, and * indicate statistical significance at the 1%, 5%, and 10% level, respectively.
Table 4 shows empirical results using the alternative cost stickiness measure of Homburg & Nasev (2008). Both the OLS and Fama-MacBeth methods provide significantly negative coefficients, implying that CEO pensions decrease SG&A cost stickiness. This result also supports H2, or the agency factor of cost stickiness, and is consistent with the results in Table 3.
| Table 4 Alternative Measure Of Sg & A Stickiness |
||
| Independent variable | Dependent variable: Stickiness | |
| OLS | Fama-MacBeth | |
| (1) | (2) | |
| Intercept | 0.007 | 0.018 |
| (0.15) | (1.06) | |
| INSDEBT | -0.016*** | -0.015* |
| (-2.67) | (-1.93) | |
| ∆LEV | -0.023*** | -0.015 |
| (-3.33) | (-1.00) | |
| ∆SIZE | -0.178*** | -0.169* |
| (-11.50) | (-2.18) | |
| ∆MTB | -0.003 | 0.000 |
| (-0.40) | (0.07) | |
| ∆INT | 0.198*** | 0.198** |
| (12.21) | (2.37) | |
| Year-fixed effect | Yes | No |
| Industry-fixed effect | Yes | Yes |
| Adj. R2 | 0.015 | |
| F-value | [3.65] *** | |
| N | 12,714 | 12,714 |
Note: This table reports the regression results of the impact of CEO pensions on cost stickiness according to Homburg & Nasev’s (2008) model. The t-statistics are reported in parentheses. ***, **, and * indicate statistical significance at the 1%, 5%, and 10% level, respectively.Additional tests
Overconfident CEO
We additionally analyzed the impact of overconfident CEO on cost stickiness. As we noted above, overconfident CEOs assume that a sales drop will be temporary, so they tend to increase the extent of cost stickiness further from the optimal level. Consistent with the previous results in support of the agency factor over the economic factor of cost stickiness, we expect overconfident CEO to increase cost stickiness, and we expect CEO pensions to decrease this increase in cost stickiness induced by CEOs’ overconfidence. This is consistent with H2, and the contrary result would support H1.
We measure CEO overconfidence following Campbell et al. (2011). They measured CEO optimism based on CEOs’ stock options holding (Malmendier & Tate, 2005). Their study views CEOs as optimistic if more than 100 percent of the stock options holdings is in the money. The 100 percent cut-off determines the CEO overconfidence dummy variable (OC); we use this variable to construct regression models based on the two cost stickiness models mentioned above to examine the associations among CEO pensions, CEO overconfidence, and cost stickiness.
Similar to equation (3), a negative β3 captures the extent of cost stickiness and a β7 negative indicates that CEO overconfidence increases cost stickiness. For the impact of CEO pensions, we divide the sample into two groups: one with inside debt and the other without it. We expect β7 to be significantly negative for the sample without inside debt and a non-negative value for the sample with inside debt. This implies that without inside debt, overconfident CEO will increase cost stickiness, but CEO pensions can restrict overconfident CEOs’ desire to deviate further from the optimal level of cost stickiness.
Panel A of Table 5 reports the analysis with CEO overconfidence and inside debt together with the first cost-stickiness model. As expected, the coefficient of ΔSale*DD, β3 or , is significantly negative for all three samples, confirming the existence of cost-stickiness. More importantly, we see a significantly negative coefficient of ΔSale*DD*OC, β7 or for the total sample and the sample without inside debt, but an insignificantly positive coefficient for the sample with inside debt. This is consistent with our prediction and the previous results, as this implies that overconfident CEOs, who have a higher tendency for agency problems, raise coststickiness, which arises more from the agency factor as our previous results indicate. However, CEO pensions can mitigate the association between CEO overconfidence and cost-stickiness. Thus, CEO pensions can limit the deviation from the optimal cost-stickiness level and the agency cost.
We performed a similar analysis concerning CEO overconfidence using the second coststickiness model with the following equation:
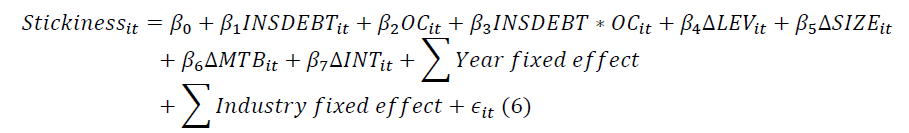
In this equation, we expect a negative value for β3, as CEO pensions decrease coststickiness, and a positive value for β2, as we expect CEO overconfidence to raise cost-stickiness.
We anticipate a negative value for β3, as we expect inside debt to mitigate the association between CEO overconfidence and cost-stickiness.
Panel B of Table 5a & b shows that the results are consistent with our expectations. The significantly positive coefficients of OC and negative coefficients of INSDEBT*OC together support the agency factor of cost-stickiness over the economic factor.
| Table 5a CEO Overconfidence |
|||
| Panel A: CEO Overconfidence with Anderson et al.’s (2007) cost-stickiness model | |||
| Independent variable | Dependent variable = ∆Cost | ||
| Baseline model | INSDEBT = 1 | INSDEBT = 0 | |
| (1) | (2) | (3) | |
| Intercept | 0.003 | -0.023 | 0.020 |
| (0.17) | (-0.77) | (0.78) | |
| ∆Sale | 0.439*** | 0.442*** | 0.421*** |
| (12.21) | (5.95) | (10.13) | |
| DD | -0.021 | -0.028*** | -0.021*** |
| (-5.29) | (-4.14) | (-4.13) | |
| ∆Sale*DD | -0.172*** | -0.072* | -0.188*** |
| (-8.28) | (-1.80) | (-7.59) | |
| OC | 0.008 | 0.009 | 0.008 |
| (1.60) | (0.95) | (1.43) | |
| ∆Sale*OC | 0.062*** | 0.035 | 0.055** |
| (2.78) | (0.61) | (2.19) | |
| DD*OC | 0.001 | -0.002 | 0.001 |
| (0.09) | (-0.08) | (0.08) | |
| ∆Sale*DD*OC | -0.187*** | 0.003 | -0.218*** |
| (-3.40) | (0.02) | (-3.46) | |
| ∆LEV | -0.027*** | 0.002 | -0.032*** |
| (-8.19) | (0.24) | (-8.57) | |
| ∆SIZE | 0.174*** | 0.053 | 0.210*** |
| (5.02) | (0.72) | (5.29) | |
| ∆MTB | -0.025*** | 0.005 | -0.031*** |
| (-7.36) | (0.66) | (-7.94) | |
| ∆INT | -0.088*** | 0.045 | -0.132*** |
| (-2.63) | (0.65) | (-3.42) | |
| Year-fixed effect | Yes | Yes | Yes |
| Industry-fixed effect | Yes | Yes | Yes |
| Adj. R2 | 0.529 | 0.414 | 0.554 |
| F-value | [119.99] *** | [23.65] *** | [97.75] *** |
| N | 8,171 | 2,245 | 5,926 |
| Table 5b CEO Overconfidence |
||
| Panel B: CEO Overconfidence with Homburg & Nasev’s (2008) cost-stickiness model | ||
| Dependent variable: Stickiness | ||
| Independent variable | (1) | (2) |
| Intercept | 0.030*** | 0.031*** |
| (4.13) | (4.29) | |
| INSDEBT | -0.004*** | |
| (-3.55) | ||
| OC | 0.002** | 0.002* |
| (2.06) | (1.91) | |
| INSDEBT*OC | -0.004** | |
| (-2.18) | ||
| ∆LEV | -0.002* | -0.002 |
| (-1.94) | (-1.30) | |
| ∆SIZE | -0.082*** | -0.081*** |
| (-29.66) | (-28.99) | |
| ∆MTB | -0.001 | 0.000 |
| (-0.57) | (0.06) | |
| ∆INT | 0.091*** | 0.091*** |
| (32.23) | (32.22) | |
| Year-fixed effect | Yes | Yes |
| Industry-fixed effect | Yes | Yes |
| Adj. R2 | 0.153 | 0.157 |
| F-value | [21.82] *** | [21.83] *** |
| N | 8,171 | 8,171 |
Note: This table reports the regression results of the impact of CEO pensions on the association between CEO overconfidence and cost stickiness. The t-statistics are reported in parentheses. ***, **, and * indicate statistical significance at the 1%, 5%, and 10% level, respectively.
Institutional Monitoring
For a further analysis, we also examine the associations among institutional monitoring, CEO pensions, and cost-stickiness. Qualitatively and quantitatively, a significant existence of institutional investors can function as active monitors for shareholders (Brickley et al., 1988; Almazan et al., 2005; Chen et al., 2007; Ferreira & Matos, 2008). The institutional monitoring literature shows that institutional investments differ, and that long-term institutional investors are more active and effective in monitoring the firm for the shareholders’ benefit (Chen et al., 2007; Yan & Zhang, 2009; Chung et al., 2015). Following this stream of literature, we also divided Institutional Ownership (IO) into short- and long-term institutional ownership (SIO and LIO). As a proxy for institutional monitoring, we calculate IO as the number of shares held by institutions at the year-end divided by the total number of shares outstanding for stock i. Further, to define SIO and LIO, we focus on portfolio turnover following Yan and Zhang (2009). We compute the quarterly portfolio turnover as
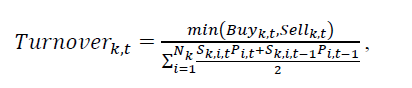
here,  are the aggregate purchases and sales by investor k for quarter t;
  are the share prices for stock i at the end of quarters t - 1 and t, respectively; and
  are the number of shares of stock i held by investor k at the
end of quarters t-1 and t, respectively. Institutional ownership with higher portfolio turnover can be classified as short-term institutional ownership (SIO), and ownership with lower turnover can
be classified as long-term institutional ownership (LIO). We set terciles as criteria dividing SIO
and LIO. More specifically, we define the stock ownership in the top tercile of portfolio turnover
as SIO, and the ownership in the bottom tercile of portfolio turnover as LIO.
are the number of shares of stock i held by investor k at the
end of quarters t-1 and t, respectively. Institutional ownership with higher portfolio turnover can be classified as short-term institutional ownership (SIO), and ownership with lower turnover can
be classified as long-term institutional ownership (LIO). We set terciles as criteria dividing SIO
and LIO. More specifically, we define the stock ownership in the top tercile of portfolio turnover
as SIO, and the ownership in the bottom tercile of portfolio turnover as LIO.
With these measures, we examine the associations among institutional ownership, CEO insider debt, and cost-stickiness. We employ the two cost-stickiness models for this analysis as well. We modify Anderson et al.’s (2007) cost-stickiness model to reach this equation.
With this equation, we perform analyses using IO, SIO, and LIO. Since long-term
institutional investors have a long-term investment horizon, we expect that they will more
actively monitor the firm to benefit shareholders and try to mitigate the CEO’s agency problems.
Consistent with the previous hypothesis and results, we expect LIO to reduce cost-stickiness
since cost-stickiness is mainly driven by the agency factor. Hence, for the LIO model, we expect
the coefficient of  to be significantly positive for the entire sample.
We further hypothesize that CEO pensions function to mitigate the agency problem, but under
the existence of LIO, there remains little to reduce in the cost-stickiness, as LIO would already
narrow the deviation from the optimal cost-stickiness level. Hence, we expect β7 not to be
significantly positive for the sample with insider debt and that it will be significantly positive for
the sample without insider debt.
to be significantly positive for the entire sample.
We further hypothesize that CEO pensions function to mitigate the agency problem, but under
the existence of LIO, there remains little to reduce in the cost-stickiness, as LIO would already
narrow the deviation from the optimal cost-stickiness level. Hence, we expect β7 not to be
significantly positive for the sample with insider debt and that it will be significantly positive for
the sample without insider debt.
We consider that the impact of SIO will focus only on short-term profit and selling the
stock within a short horizon, and they will thus less actively monitor managers and not align with
the shareholder’s view. Then, we expect that SIO will increase cost-stickiness, so the coefficient
of  should be significantly negative for the entire sample and for the
sample without insider debt. This implies that SIO does not mitigate the agency problem. In this
case, the existence of CEO pensions can help reduce this agency cost. Thus, for the sample with
insider debt, we expect that β7 will not to be significantly negative, as SIO would not worsen
the agency cost of cost-stickiness in the presence of CEO insider debt.
should be significantly negative for the entire sample and for the
sample without insider debt. This implies that SIO does not mitigate the agency problem. In this
case, the existence of CEO pensions can help reduce this agency cost. Thus, for the sample with
insider debt, we expect that β7 will not to be significantly negative, as SIO would not worsen
the agency cost of cost-stickiness in the presence of CEO insider debt.
Panel A of Table 6 demonstrates our anticipated results using Anderson et al.’s (2007) coststickiness model. When IO is not decomposed into SIO and LIO, the direction and significance are not clear. However, for the SIO and LIO analyses, we can confirm that β7 follows our prediction, consistent with our hypothesis and previous results.
| Table 6a Institutional Monitoring |
||||||||||||
| Panel A: Institutional Monitoring with Anderson et al.’s (2007) cost-stickiness model | ||||||||||||
| Dependent variable = ∆Cost | ||||||||||||
| Baseline model | INSDEBT = 1 |
INSDEBT = 0 |
Baseline model | INSDEBT = 1 |
INSDEBT = 0 |
Baseline model | INSDEBT = 1 |
INSDEBT = 0 |
||||
| Independent variable | (1) | (2) | (3) | (4) | (5) | (6) | (7) | (8) | (9) | |||
| Intercept | -0.033* | -0.054 | -0.021 | -0.013 | -0.019 | -0.008 | -0.008 | -0.010 | -0.004 | |||
| (-1.73) | (-1.74) | (-0.83) | (-0.75) | (-0.75) | (-0.33) | (-0.41) | (-0.37) | (-0.17) | ||||
| ∆Sale | 0.570*** | 0.477*** | 0.555** | 0.538*** | 0.363*** | 0.555*** | 0.577*** | 0.299*** | 0.587*** | |||
| (11.44) | (3.26) | (10.13) | (15.65) | (4.17) | (14.45) | (16.01) | (3.03) | (14.70) | ||||
| DD | -0.018 | -0.041 | -0.013 | -0.013* | -0.035*** | -0.005 | -0.035*** | -0.029 | -0.040*** | |||
| (-1.18) | (-1.37) | (-0.72) | (-1.95) | (-2.95) | (-0.57) | (-3.90) | (-1.56) | (-3.82) | ||||
| ∆Sale*DD | -0.216*** | -0.760*** | -0.105 | -0.101*** | -0.138* | -0.076* | -0.296*** | -0.046 | -0.309*** | |||
| (-3.02) | (-3.98) | (-1.31) | (-2.93) | (-1.91) | (-1.87) | (-7.09) | (-0.44) | (-6.56) | ||||
| IO | 0.037*** | 0.045** | 0.033*** | |||||||||
| (3.62) | (2.06) | (2.85) | ||||||||||
| ∆Sale*IO | -0.009 | -0.158 | 0.030 | |||||||||
| (-0.20) | (-1.13) | (0.60) | ||||||||||
| DD*IO | -0.004 | 0.015 | -0.009 | |||||||||
| (-0.24) | (0.44) | (-0.45) | ||||||||||
| ∆Sale*DD*IO | 0.023 | 0.784*** | -0.127 | |||||||||
| (0.28) | (3.69) | (-1.38) | ||||||||||
| SIO | 0.041** | 0.031 | 0.044*** | |||||||||
| (3.30) | (1.25) | (3.01) | ||||||||||
| ∆Sale*SIO | 0.060 | -0.046 | 0.055 | |||||||||
| (1.12) | (-0.34) | (0.90) | ||||||||||
| DD*SIO | -0.030 | 0.025 | -0.056** | |||||||||
| (-1.38) | (0.62) | (-2.14) | ||||||||||
| ∆Sale*DD*SIO | -0.259*** | 0.245 | -0.390*** | |||||||||
| (-2.70) | (1.20) | (-3.46) | ||||||||||
| LIO | -0.018 | -0.022 | -0.025 | |||||||||
| (-0.89) | (-0.54) | (-1.03) | ||||||||||
| ∆Sale*LIO | -0.067 | 0.338 | -0.033 | |||||||||
| (-0.68) | (1.19) | (-0.30) | ||||||||||
| DD*LIO | 0.052 | 0.009 | 0.074* | |||||||||
| (1.57) | (0.14) | (1.92) | ||||||||||
| ∆Sale*DD*LIO | 0.444*** | -0.127 | 0.449** | |||||||||
| (2.63) | (-0.31) | (2.33) | ||||||||||
| ∆LEV | -0.021*** | -0.011* | -0.022*** | -0.022*** | -0.011* | -0.023*** | -0.022*** | -0.011* | -0.023*** | |||
| (-7.47) | (-1.73) | (-6.88) | (-7.66) | (-1.83) | (-7.01) | (-7.60) | (-1.76) | (-7.03) | ||||
| ∆FSize | 0.078*** | 0.177** | 0.071** | 0.071** | 0.161** | 0.068** | 0.075*** | 0.140** | 0.069** | |||
| (2.78) | (2.50) | (2.31) | (2.53) | (2.18) | (2.21) | (2.69) | (1.98) | (2.25) | ||||
| ∆MTB | -0.019*** | -0.001 | -0.023*** | -0.019*** | 0.000 | -0.023*** | -0.020*** | -0.001 | -0.024*** | |||
| (-6.64) | (-0.09) | (-6.88) | (-6.83) | (-0.07) | (-7.16) | (-6.99) | (-0.11) | (-7.24) | ||||
| ∆INT | 0.021 | -0.086 | 0.023 | 0.026 | -0.070 | 0.026 | 0.025 | -0.049 | 0.029 | |||
| (0.77) | (-1.25) | (0.78) | (0.97) | (-0.98) | (0.85) | (0.94) | (-0.71) | (0.96) | ||||
| Year-fixed effect | Yes | Yes | Yes | Yes | Yes | Yes | Yes | Yes | Yes | |||
| Industry-fixed effect | Yes | Yes | Yes | Yes | Yes | Yes | Yes | Yes | Yes | |||
| Adj. R2 | 0.523 | 0.435 | 0.541 | 0.524 | 0.432 | 0.541 | 0.523 | 0.432 | 0.539 | |||
| F-value | [158.95] | [33.75] | [124.05] *** | [159.46] *** | [33.36] *** | [124.48] *** | [158.45] *** | [33.32] *** | [123.44] | |||
| N | 11,080 | 3,024 | 8,056 | 11,080 | 3,024 | 8,056 | 11,080 | 3,024 | 8,056 | |||
| Table 6b Institutional Monitoring Panel B: Institutional Monitoring with Homburg & Nasev’s (2008) cost-stickiness model |
||||||||||
| Dependent variable: Stickiness | ||||||||||
| ndependent variable | -1 | -2 | -3 | -4 | -5 | -6 | ||||
| Intercept | -0.011 | -0.009 | -0.019 | -0.025 | 0.025 | 0.03 | ||||
| (-0.22) | (-0.16) | (-0.37) | (-0.49) | -0.48 | -0.58 | |||||
| INSDEBT | -0.005 | 0.021 | -0.029 | |||||||
| (-0.12) | -1.44 | (-1.34) | ||||||||
| IO | 0.024 | 0.028 | ||||||||
| -1.36 | -1.45 | |||||||||
| INSDEBT*IO | -0.015 | |||||||||
| (-0.35) | ||||||||||
| SIO | 0.145*** | 0.168*** | ||||||||
| -6.67 | -6.95 | |||||||||
| INSDEBT*SIO | -0.126 | |||||||||
| (-2.61) | ||||||||||
| LIO | -0.099*** | -0.099*** | ||||||||
| (-2.78) | (-2.52) | |||||||||
| INSDEBT*LIO | 0.053 | |||||||||
| -0.67 | ||||||||||
| ∆LEV | -0.031*** | -0.031*** | -0.032*** | -0.031*** | -0.032*** | -0.032*** | ||||
| (-3.81) | (-3.75) | (-3.91) | (-3.80) | (-3.96) | (-3.89) | |||||
| ∆SIZE | -0.188 | -0.192*** | -0.206 | -0.21 | -0.192 | -0.195 | ||||
| (-10.25) | (-10.45) | (-11.14) | (-11.31) | (-10.45) | (-10.60) | |||||
| ∆MTB | -0.005 | -0.005 | -0.004 | -0.004 | -0.006 | -0.006 | ||||
| (-0.59) | (-0.58) | (-0.53) | (-0.50) | (-0.71) | (-0.70) | |||||
| ∆INT | 0.205*** | 0.206*** | 0.213*** | 0.214*** | 0.209*** | 0.210*** | ||||
| -10.64 | -10.73 | -11.08 | -11.14 | -10.83 | -10.9 | |||||
| Year-fixed effect | Yes | Yes | Yes | Yes | Yes | Yes | ||||
| Industry-fixed effect | Yes | Yes | Yes | Yes | Yes | Yes | ||||
| Adj. R2 | 0.013 | 0.014 | 0.017 | 0.018 | 0.014 | 0.014 | ||||
| F-value | [3.11] *** | [3.12] *** | [3.72] *** | [3.77] *** | [3.20] *** | [3.18] *** | ||||
| N | 11,080 | 11,080 | 11,080 | 11,080 | 11,080 | 11,080 | ||||
Note: This table reports the regression results of the impact of CEO pensions on the association between institutional monitoring and cost stickiness. The t-statistics are reported in parentheses. ***, **, and * indicate statistical significance at the 1%, 5%, and 10% level, respectively
We perform the institutional monitoring analysis using Homburg & Nasev’s (2008) coststickiness model as well using the following equation to investigate the associations among institutional monitoring, CEO pensions, and cost-stickiness:
As in the previous IO analysis with Anderson et al.’s (2007) model, we expect LIO to reduce cost-stickiness, and as LIO would already reduce the agency costs in cost-stickiness, insider debt will not affect anything. Thus, we expect the coefficient of LIO, β2 or, to be significantly negative, while the coefficient of INSDEBT*LIO, β3 or should show no significance. In contrast, we expect SIO to worsen the agency problem; hence, it will increase cost-stickiness, and insider debt will mitigate this agency problem induced by SIO. Thus, the coefficient of SIO, or β2, will be significantly positive, while the coefficient of INSDEBT*SIO, or β3, will be significantly negative. We do not predict any directions for the coefficients using IO because IO includes the two conflicting undecomposed elements, SIO and LIO.
Panel B of Table 6 shows institutional monitoring analysis results using Homburg & Nasev’s (2008) model. The coefficients of SIO and LIO are consistent with our predictions and support our hypothesis
Conclusion
CEO debt-based compensation, such as a CEO pension plan can make CEO's decisions the same as those of creditors. In other words, it can serve as an incentive to select risk-averse and conservative management policies (Sundaram & Yermack, 2007; Wei & Yermack, 2011; Anantharaman et al., 2013; Wang et al., 2017). This suggests that debt-based compensation may solve the agency problem of creditors and managers because it attempts to mitigate shareholders’ and managers' agency problems with equity-based compensation such as stock options. We proved the hypothesis with the phenomenon of cost stickiness.
Cost stickiness can occur in a more optimal way to maintain existing costs, despite reduced sales. To address agency problems arising from managerial overconfidence, providing CEO pensions can encourage conservative views about the future to reduce cost stickiness. Our results show that CEO pensions induced CEOs to make risk averse choices and suppress the choice of increasing cost stickiness due to managerial overconfidence because they are pensioned according to the future state of the company rather than the current state of the company. Our study not only presents additional results to help solve the controversy in the existing cost stickiness literature, but also suggests that inside debt can affect managers' behavior related to cost, which can be a means to solve the agency problem among creditors and managers.
Acknowledgement
The corresponding author is Kyung Jin Park, Myongji University.
References
- Abel, A. B., & Eberly, J. C. (1997). An exact solution for the investment and value of a firm facing uncertainty, adjustment costs, and irreversibility. Journal of Economic Dynamics and Control, 21(4-5), 831-852.
- Almazan, A., Hartzell, J. C., & Starks, L. T. (2005). Active institutional shareholders and costs of monitoring: Evidence from executive compensation. Financial Management, 34(4), 5-34.
- Anantharaman, D., Fang, V. W., & Gong, G. (2013). Inside debt and the design of corporate debt contracts. Management Science, 60(5), 1260-1280.
- Anderson, M. C., Banker, R. D., & Janakiraman, S. N. (2003). Are selling, general, and administrative costs “sticky”?. Journal of Accounting Research, 41(1), 47-63.
- Anderson, M., Banker, R., Huang, R., & Janakiraman, S. (2007). Cost behavior and fundamental analysis of SG&A costs. Journal of Accounting, Auditing & Finance, 22(1), 1-28.
- Balakrishnan, R., & Gruca, T. S. (2008). Cost stickiness and core competency: A note. Contemporary Accounting Research, 25(4), 993-1006.
- Banker, R. D., & Chen, L. (2006). Predicting earnings using a model based on cost variability and cost stickiness. The Accounting Review, 81(2), 285-307.
- Banker, R. D., Byzalov, D., Ciftci, M., & Mashruwala, R. (2014). The moderating effect of prior sales changes on asymmetric cost behavior. Journal of Management Accounting Research, 26(2), 221-242.
- Bebchuk, L. A., & Jackson Jr, R. J. (2005). Executive pensions. National Bureau of Economic Research.
- Brickley, J. A., Lease, R. C., & Smith Jr, C. W. (1988). Ownership structure and voting on antitakeover amendments. Journal of Financial Economics, 20, 267-291.
- Brockman, P., Martin, X., & Unlu, E. (2010). Executive compensation and the maturity structure of corporate debt. The Journal of Finance, 65(3), 1123-1161.
- Brüggen, A., & Zehnder, J. O. (2014). SG&A cost stickiness and equity-based executive compensation: does empire building matter?. Journal of Management Control, 25(3-4), 169-192.
- Campbell, T. C., Gallmeyer, M., Johnson, S. A., Rutherford, J., & Stanley, B. W. (2011). CEO optimism and forced turnover. Journal of Financial Economics, 101(3), 695-712.
- Cassell, C. A., Huang, S. X., Sanchez, J. M., & Stuart, M. D. (2012). Seeking safety: The relation between CEO inside debt holdings and the riskiness of firm investment and financial policies. Journal of Financial Economics, 103(3), 588-610.
- Chen, C. X., Lu, H., & Sougiannis, T. (2012). The agency problem, corporate governance, and the asymmetrical behavior of selling, general, and administrative costs. Contemporary Accounting Research, 29(1), 252-282.
- Chen, C., Gores, T., & Nasev, J. (2013). Managerial overconfidence and cost stickiness.
- Chen, F., Yee, K. K., & Yoo, Y. K. (2007). Did adoption of forward-looking valuation methods improve valuation accuracy in shareholder litigation?. Journal of Accounting, Auditing & Finance, 22(4), 573-598.
- Chi, S., Huang, S. X., & Sanchez, J. M. (2017). CEO inside debt incentives and corporate tax sheltering. Journal of Accounting Research, 55(4), 837-876.
- Chung, C. Y., Liu, C., Wang, K., & Zykaj, B. B. (2015). Institutional monitoring: Evidence from the F‐score. Journal of Business Finance & Accounting, 42(7-8), 885-914.
- Cohen, D. A., Dey, A., & Lys, T. Z. (2008). Real and accrual-based earnings management in the pre-and post-Sarbanes-Oxley periods. The Accounting Review, 83(3), 757-787.
- Coles, J. L., Daniel, N. D., & Naveen, L. (2006). Managerial incentives and risk-taking. Journal of Financial Economics, 79(2), 431-468.
- Dalla Via, N., & Perego, P. (2014). Sticky cost behaviour: evidence from small and medium sized companies. Accounting & Finance, 54(3), 753-778.
- Dierynck, B., Landsman, W. R., & Renders, A. (2012). Do managerial incentives drive cost behavior? Evidence about the role of the zero earnings benchmark for labor cost behavior in private Belgian firms. The Accounting Review, 87(4), 1219-1246.
- Edmans, A. Q., Liu, 2011. Inside Debt. Review of Finance, 15, 75-102.
- Ferreira, M. A., & Matos, P. (2008). The colors of investors’ money: The role of institutional investors around the world. Journal of Financial Economics, 88(3), 499-533.
- Foley, M., & Lee, C. F. Inside debt, firm risk and investment decision.
- Hanlon, M., Rajgopal, S., & Shevlin, T. (2003). Are executive stock options associated with future earnings?. Journal of Accounting and Economics, 36(1-3), 3-43.
- He, G. (2015). The effect of CEO inside debt holdings on financial reporting quality. Review of Accounting Studies, 20(1), 501-536.
- Im, H. K., Choi, S., & Hwang, I. (2018). CEO Inside Debt and Asymmetric Cost Behavior.
- Jensen, M. C., & Meckling, W. H. (1976). Theory of the firm: Managerial behavior, agency costs and ownership structure. Journal of Financial Economics, 3(4), 305-360.
- Kama, I., & Weiss, D. (2013). Do earnings targets and managerial incentives affect sticky costs?. Journal of Accounting Research, 51(1), 201-224.
- Kuang, Y. F., Mohan, A., & Qin, B. (2015). CEO Overconfidence and Cost Stickiness.
- Kwak, B., & Mo, K. (2018). Executive pension, default risk, and earnings management. Asia-Pacific Journal of Accounting & Economics, 25(3-4), 463-480.
- Lambert, R. A., & Larcker, D. F. (1987). Executive compensation effects of large corporate acquisitions. Journal of Accounting and Public Policy, 6(4), 231-243.
- Low, A. (2009). Managerial risk-taking behavior and equity-based compensation. Journal of Financial Economics, 92(3), 470-490.
- Malmendier, U., & Tate, G. (2005). CEO overconfidence and corporate investment. The Journal of Finance, 60(6), 2661-2700.
- McConnell, J. J., & Servaes, H. (1990). Additional evidence on equity ownership and corporate value. Journal of Financial Economics, 27(2), 595-612.
- Morck, R., Shleifer, A., & Vishny, R. W. (1988). Management ownership and market valuation: An empirical analysis. Journal of Financial Economics, 20, 293-315.
- Murphy, K. J. (1985). Corporate performance and managerial remuneration: An empirical analysis. Journal of Accounting and Economics, 7(1-3), 11-42.
- Phan, H. V. (2014). Inside debt and mergers and acquisitions. Journal of Financial and Quantitative Analysis, 49(5-6), 1365-1401.
- Roychowdhury, S. (2006). Earnings management through real activities manipulation. Journal of Accounting and Economics, 42(3), 335-370.
- Sundaram, R. K., & Yermack, D. L. (2007). Pay me later: Inside debt and its role in managerial compensation. The Journal of Finance, 62(4), 1551-1588.
- Wei, C., & Yermack, D. (2011). Investor reactions to CEOs' inside debt incentives. The Review of Financial Studies, 24(11), 3813-3840.
- Yan, X., & Zhang, Z. (2007). Institutional investors and equity returns: Are short-term institutions better informed?. The Review of Financial Studies, 22(2), 893-924.