Research Article: 2022 Vol: 14 Issue: 5
Corporate social responsibility (CSR) and trade credit for optimum cost of funds towards a sustainable business model: The strategic link: a case study of energy sector related companies
Sarojkant Singh, ICFAI University
Raja Ghosh, ICFAI University
Cedric Goubert, ICFAI University
Citation Information: Singh, S., Ghosh, R., & Goubert, C. (2022). Corporate social responsibility (csr) and trade credit for optimum cost of funds towards a sustainable business model: The strategic link: A case study of energy sector related companies. Business Studies Journal, 14(5), 1-14.
Abstract
Proportion of renewables has been increasing overtime in the business portfolio of energy sector companies. This is primarily aimed at attaining sustainability goals. This article aims to provide evidence how corporate social responsibility (CSR) and trade credit can be leveraged for optimizing financing cost and thus assist in achieving such sustainability goals. Many studies show that strategic optimum CSR lowers the cost of equity and debt. Further, studies also show that CSR is correlated to trade credit. This research aims to test these hypotheses and provide evidence towards the existing body of research. A systematic, cross-functional literature review in fields of sustainability, CSR, triple bottom line and financing cost is carried out. 19 listed companies are studied in the energy sector i.e., 8 Global energy companies, 3 Indian oil sector companies, 3 power sector companies and 5 EPC companies in energy sector. The business portfolio and performance of these companies are studied to analyze the growth in renewables in their business portfolio. The proportion of CSR done in these organizations is studied thorough their annual reports and data analysis is done to understand the impact of CSR on trade credit in these companies.
Keywords
CSR, Sustainability, Trade Credit, Strategy, Renewables, Energy.
JEL Code
M140.
Introduction
Dell’s chief responsibility officer named as Trisa Thompson, once said that “Completely regardless of the global political environment, corporations will continue the march toward sustainable production because it makes sense and is a business necessity”. Quite a large quantity of concerns disburses abundant of resources as well as time on CSR activities to fascinate investors those having socially answerable, and at the same time the company’s virtuous image and better branding, and then intended attentiveness along the potential employees as well as customers. After that the CSR speculation can have two-fold strategic advantage: At first show their obligation to the improvement of public society, & surroundings then next the advancement of concern’s recital with socially accountable assets.
There is a gradual shift from fossil fuels towards renewable energy as is evident from the study of current business portfolio of 8 global companies. This is further strengthened by observing the business investments in pipeline for the 11 Indian companies. We have studied the annual accounts of these companies and analyzed data from S&P Capital IQ to analyze the trend of trade credit and quality/amount of CSR spending. We have studied 8 (eight) global companies viz: Total, Shell, Chevron, BP, Equinor, Eni, Exxon Mobil, Petrobras to see their shift in business portfolio towards renewables.
We also see the future business plans for investment in renewables in these companies. Oil and gas companies are shown in the Table 1.
| Table 1 Oil and Gas Companies | |||
| Oil and Gas Companies | Power and steel | EPC | Global Companies |
| Oil India, GAIL, Reliance | NTPC, Coal India, sail | L and T, KEC, ISGEC, MBE, Tata Project | Total, Shell, Chevron, BP, Equinor, Eni, Exxon Mobil, Petrobras |
Literature Review
Vaidy researches Indian manufacturing firms and shows that firms which are profitable extend and receive less trade credit. The author correlates inventory management and trade credit, and that firms with access to bank credit offer less credit to their customers. The author however does not include CSR as a factor in his research. Xu et al. (2020) shows that suppliers willingness to extend credit is linked to CSR in US firms. The authors also refer studies where CSR lowering cost of equity and debt, is shown. Zhang et al. (2020) also enforces that supplier willingness to pay increases for socially responsible firms where CSR activity is more. The authors also show that during crisis this firm utilizes less of this trade credit. Shou et al. (2020) shows a nonlinear U-shaped relationship of CSR and trade credit for SMME firms in China. Arcuri & Pisani (2021) show that trade credit is more prevalent in green MEs than non-green MEs. The authors also show that trade credit is a more sustainable source of financing than bank credit.
In Former investigation capitulated that an oversized quantity along the proof taking place the conglomerate needs for “doing sensible good to the society, stakeholders and therefore the setting is nice for business” (language change). Company’s CSR concert is straight away connected through a company’s money indicators, such as, CSR advances company’s act (Statman & Glushkov, 2009; Wu & Shen, 2013), minimizes concern’s risk (Lee et al., 2009), decreases monetary value of asset (El Ghoul et al., 2011; Sharfman & Fernando, 2008), and will increase overall Financial standing of companies (Attig et al., 2013; Prommin et al., 2014). However, the literature cited on top displays that CSR can play a vital role of significant part to enhance provision along the sources of finance. Generally, the literature among corporate finance indicate that communally accountable companies got higher ingress towards fund and finance (Cheng et al., 2014) and small risk of customary in debt service (Boubaker et al., 2020; Sun & Cui, 2014). Previous investigation additionally shows a company can have higher Corporate Social Responsibility spends and higher quality CSR attract each debt, Goss & Roberts (2011) and equality, El Ghoul et al. (2011) finance. In case of debt aspect, the long-term debt that can be taken into account as a major utensil for debt finance. Therefore, earlier analysis indicates the positive CSR act decreases price of their loan. Typically, a concern additionally utilized trade credit as a strategic tool as Accounts Payable increases the finance together through a debt. During this Trade credit could be very important supply of capital for a company along minimum value, evading extended measures, and keeping spare fluidness. Usually, companies further purchase taking place along credit then extend their returns and supply assets chance with little otherwise financially anxious companies (McMillan & Woodruff, 1999). Thus, the company trust could be a vital part that needs company to increase the trade credit capability (Wu et al., 2014). Certainly, stronger association among vendor as well as provider develops mutual trust. Curiously, about current investigation originate that communally accountable companies guarantee higher communications along with their investors (Deng et al., 2013; Cheng et al., 2014). Therefore, proof cited directly above illustrates that companies have active CSR strategies with higher admittance related among finance and improved connection with investors. Hence, the company additionally utilized provider aspect through trade credit and then increases its fluidity. While distinction, companies additionally build up mutual trust of their investors (stockholders, communal, consumers, etc). On preliminary review of the company finance literature, we tend to see a scarcity to be examined and then study the effect of CSR taking place through trade credit (debtors as well as creditors aspect of it). This paper exposed that we tend towards try and fill up this space. Historically, companies provide trade credit throughout the stable market condition. Corporations will expand their total trade credit for higher CSR routine. The literature among corporate finance indicated that if CSR expenses are made Noble produces just like the advancement of the people or surroundings, hence it should raise the company price as a result of “Doing sensible is nice for Business” (Adhikari, 2016). Moreover, 2 thus the meta-analyses are connected along with CSR and concern act and also then allied with this conception. During initial investigation of its kind, (Margolis & Walsh, 2003) analysis that literature taking place through CSR and concern routine of its past thirty years, from the year 1972 to 2002. Thus, completely inspect about 127 studies then get report along fifty-four studies indicate that a positive connotation among CSR and its act. Then second time, they examine 214 studies and then get the total CSR includes a positive connotation through company routine. From a broad perspective, we tend to all recognize that as per the risk-return trade-off theory, investors wish to acquire a most revenue along the specified level of company likelihood. A companies’ communal act additionally decreases the likelihood money of monetary of economic risk together with enhanced company financial act, Herremans et al. (1993) Moreover, A current investigation demonstrated that enhanced CSR includes positive effect taking place through company price as a result of CSR act decreases additional risk-taking as well as risk dodging (Harjoto & Laksmana, 2018). Within the similar way, Cai et al. (2019) noticed company surroundings obligation rendezvous reciprocally associative to company’s risk. CSR engagement additionally plays a crucial role to decrease the individual risk (Lee et al., 2009) and the stock worth crash risk (Kim et al., 2014). Previous investigates have recognized many items with proof for CSR connotation along the price of assets (Goss & Roberts, 2011; Sharfman & Fernando, 2008; Kempf & Osthoff, 2007). Employing giant instance folks companies, El Ghoul et al. (2011) notice about companies that have higher CSR routine reveal inexpensive fairness finance.
Furthermore a rise in CSR act advances the company’s credit rating; then implies extra cost-effective investment is on the market (Attig et al., 2013; Prommin et al., 2014). Subsequently, the cited studies indicate that companies have higher CSR recital cut back the company’s value of fairness as well as the price of investment and then also advance its trustworthiness. Subsequent the distinguished proof can have a tendency to conclude that CSR includes an important connotation along many companies monetary ascribes (such as company performance, value of assets, imminence, individual imminence, credit rating, stock worth crash imminence, value of fairness etc). Nevertheless, connection among CSR as well as trade credit continues to be in such matter that related with business analysis. During this research paper, attempt to examine the effect of CSR along with the availability and inquire the sides of trade credit for optimum value of funds towards a property business model with specific thrust and study on a sample frame of designated energy sector connected corporations. Trade credit may be a monetary tool for a commercial available for provider through the client. Ng et al. (1999) show that, typically, trade credit can arrange to the customer and then the provider can provide terms that permit a deferred imbursement. After that Trade credit extended (that is account receivables) thus, principally destined to push company’s sales by allocating capital finance (McMillan & Woodruff, 1999) each of sellers and clients can utilize trade credit with scale back dealings prices. For the last 20 years, educational investigators have revealed that the relationship among bank credit as well as trade credit.4 One more investigation directed on 625 small as well as Medium Enterprises (MEs) demonstrate that the higher handiness along bank loans and also advances the trade credit (both receivables and liabilities) (Tsuruta, 2015). In additionally, highlighted that the association among bank loans as well as trade liabilities is commendatory among minor firms. Many current articles, as well as (Boubaker et al., 2019; Attig et al., 2013; Prommin et al., 2014), associated (Sun & Cui, 2014) counsel along with CSR-oriented Works can have higher approche to finance because of better credit rating. Similarly, Goss & Roberts (2011) expressed that positive CSR recital is active to obtaining a loan at inexpensive charges. Again, suggested higher CSR recital will increase the company’s trustworthiness.
Kleine & von Hauff (2009) provide the triple bottom line and CSR linkage (Lu et al., 2019) study the framework for linking CSR for energy utilities and sustainability development. Manish et al. (2006) provide a framework to assess sustainability analysis.
Hypothesis Taken for the Study
In this article we test the following hypotheses:
H1: Company’s CSR performance has no relation with trade credit extended to clients.
H2: Company’s CSR performance has no relation with the trade credit received from its suppliers.
H3: Company’s CSR performance has no relation with the Net Cash flows.
We measure CSR performance with the parameters CSR/Turnover and CSR/Net Profit.
Source of Data and Actual Study
Data of 3 years from FY 2017-18 to FY 2019-20 is taken from S&P Capital IQ, Annual Accounts of 19 companies, Energy Intelligence (2016) and Energy Business Review (2016). The following variables are analyzed:
CSR/Turnover, CSR/Net Profit, AR Ratio i.e [Net Credit / Avg. Accounts Receivables], Account Receivables (days outstanding), Account payables (days outstanding).
Research Methodology
To establish the relationship between CSR and trade credit for energy companies, we first collate the data for last 3 years for CSR, Turnover, Net profit, Accounts Receivables (AR) ratio, AR days outstanding and Accounts Payable (AP) day’s outstanding, net cash flow.
We then take the average values for each of the variables over these 3 years for the 11 Indian companies.
Through a regression analysis we analyze the relationship between the dependent variables viz, AR ratio, AR days outstanding, AP days outstanding and independent variable CSR/Turnover and CSR/Net profit.
Data Analysis and Results
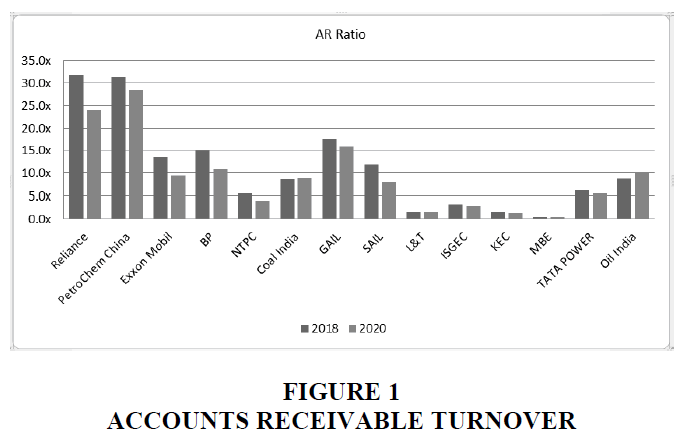
We first observe the AR Ratio for these companies. We see a gradual decreasing trend. Accounts receivable turnover is shown in the Figure 1.
Oil and gas Majors -30.3% over the period versus -12.3% for Indian firms (-25.6% if Oil India is excluded).
Trade Credit & CSR
AR Ratio=Net Credit Sales/Avg. Account Receivables i.e., a decrease in this ratio implies Net Credit Sales extended is decreasing or Average account receivables is increasing. A decrease in this variable implies that the energy companies are extending more credit to the clients than the rate at which they are receiving credit from the suppliers. In other words, they are paying creditors off faster and collecting later from clients, thus, increasing their working capital needs.
We run a regression analysis to analyze this further.
Note: We reject the Oil India data from this, as it is an aberration, also the data for the AR outstanding and AP outstanding is not available for Oil India.
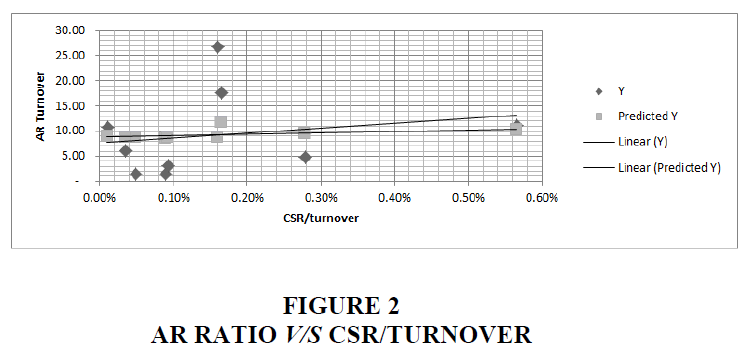
We see that the p-value of 0.03 indicates the relationship is statistically significant, and also indicates a relationship between AR ratio and CSR/ turnover. A similar regression of AR ratio and CSR/Net profit does not provide a statistically significant result. This indicates that Net credit extended is more correlated to turnover than net profit i.e as company’s turnover grows, companies extend more trade credit to its customers, rather than when net profit increases. This is in support of the evidence provided by Vaidya.
The CSR spending to Turnover ratio is constant for most companies just like the trade credit extended. The data also shows that most companies extend more credit than they receive. Except for Reliance, all companies have extended more credit than they have received. The above Table 2 shows the Regression Result AR ratio over time. AR Ratio V/s CSR/Turnover are shown in the Figure 2.
| Table 2 Regression Result AR Ratio Over Time | ||||||||
| Co- efficients | Standard Error | t state | P-value | Lower 95% | Upper 95% | Lower 95.0% | Upper 95.0% | |
| Intercept | 8.525377 | 3.430117 | 2.485448 | 0.037789 | 0.615513 | 16.43524 | 0.615513 | 16.43524 |
| X- Variable 1 | 313.2051 | 906.3758 | 0.345558 | 0.738586 | -1776.9 | 2403.311 | -1776.9 | 2403.311 |
H1: Company’s CSR performance has no relation with trade credit extended to clients.
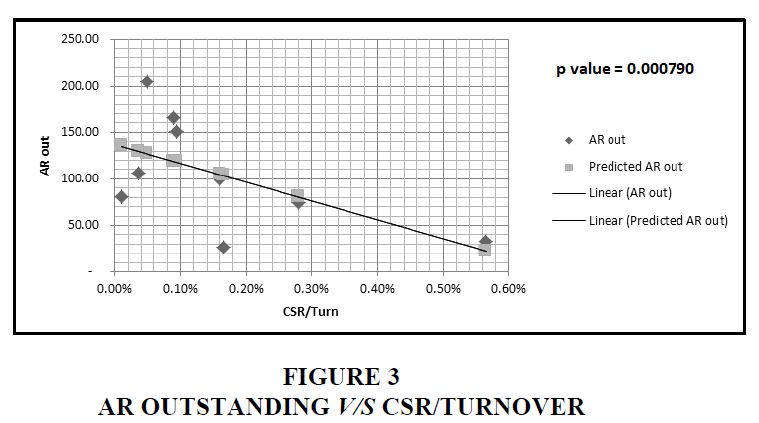
We reject the null hypothesis as the p-value indicates a statistically significant result. This proves that trade credit extended to clients is very much related to the CSR performance. Furthermore, we also see that as the CSR performance measured by CSR/Turnover increases, the AR outstanding’s decreases i.e., with CSR performance clients are ready to pay the dues earlier, thus reducing cost of capital. AR outstanding days V/s CSR/turnover is shown in the Table 3. AR Outstanding V/s CSR/Turnover is shown in the Figure 3.
| Table 3 AR Outstanding Days V/S CSR/Turnove | ||||||||
| Coefficients | Standard Error | t Stat | P-value | Lower 95% | Upper 95% | Lower 95.0% | Upper 95.0% | |
| Intercept | 137.3161 | 24.38839 | 5.63039 | 0.00079 | 79.64676 | 194.9855 | 79.64676 | 194.9855 |
| CSR/Turn | -20234.8 | 10643.48 | -1.90115 | 0.099039 | -45402.7 | 4932.996 | -45402.7 | 4932.996 |
H2: Company’s CSR performance has no relation with the trade credit extended to its suppliers.
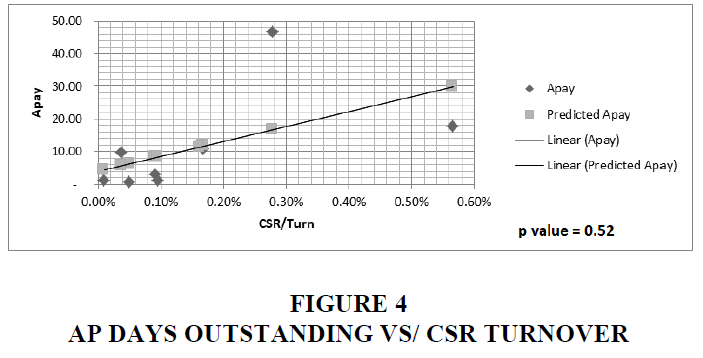
We then do a regression analysis of CSR/ turnover and AP days outstanding are shown in the Figure 4 and find the following
The results show that as CSR performance increases, the AP days outstanding increases, ie suppliers will extend more trade credit. However, the results are not statistically significant indicating that we cannot reject the null hypothesis. Thus, although we see a trend towards the CSR performance enabling more trade credit from suppliers there is no conclusive proof and further research is required. CSR Turnover by AP days outstanding is shown in the Table 4.
| Table 4 CSR Turnover by AP Days Outstanding | ||||||||
| Coefficients | Standard Error | t Stat | P-value | Lower 95% | Upper 95% | Lower 95.0% | Upper 95.0% | |
| Intercept | 4.115177 | 6.077503 | 0.677116 | 0.520074 | -10.2558 | 18.48619 | -10.2558 | 18.48619 |
| CSR/Turn | 4556.917 | 2652.319 | 1.718088 | 0.129477 | -1714.82 | 10828.66 | -1714.82 | 10828.66 |
H3: Company’s CSR performance has no relation with the Net Cash flows.
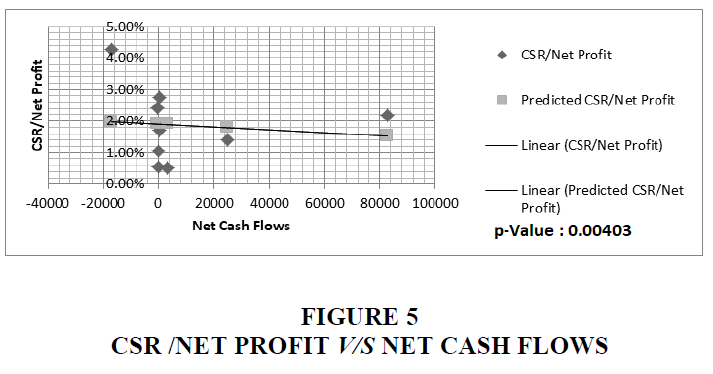
We see that the results are statistically significant and we can reject the null hypothesis indicating that CSR/Net profit is highly correlated to Net cashflows, further we see that as net cash flows increase tendency for CSR performance decreases. However, we had seen that CSR/ Net profit was not statistically significant for AR ratio, rather CSR/Turnover was more important. CSR/ Net Profit V/s Net cashflows are shown in Table 5. CSR/ Net Profit V/s Net cashflows are shown in Figure 5. A regression with this variable shows:
| Table 5 CSR/ Net Profit V/S Net Cash Flows | ||||||||
| Coefficients | Standard Error | t Stat | P-value | Lower 95% | Upper 95% | Lower 95.0% | Upper 95.0% | |
| Intercept | 0.019098 | 0.004547 | 4.199932 | 0.004036 | 0.008346 | 0.029851 | 0.008346 | 0.029851 |
| Average | -4.7E-08 | 1.54E-07 | -0.30142 | 0.771851 | -4.1E-07 | 3.19E-07 | -4.1E-07 | 3.19E-07 |
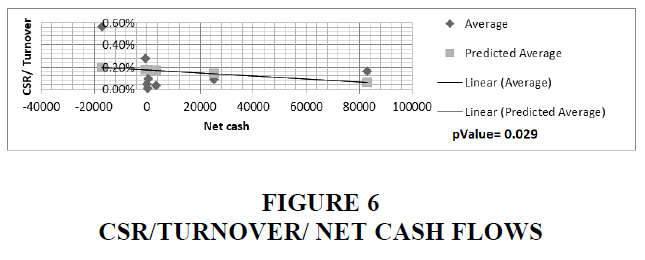
A statistically significant result with p-value of 0.029, but not as strong as CSR/ net profit. We can thus derive that cash flows have an impact on CSR performance. An increase in cash flows and Net profit tend to make companies do less CSR, though it helps them improve their working capital needs and this is a deterrent to the business goals. Further research to understand this is required. CSR/ turnover V/s Net cash flows are shown in the Table 6. CSR/ turnover V/s Net cash flows are shown in the Figure 6.
| Table 6 CSR/ Turnover V/S Net Cash Flows | ||||||||
| Coefficients | Standard Error | t Stat | P-value | Lower 95% | Upper 95% | Lower 95.0% | Upper 95.0% | |
| Intercept | 0.001755 | 0.000642 | 2.735305 | 0.029115 | 0.000238 | 0.003272 | 0.000238 | 0.003272 |
| Average | -1.4E-08 | 2.18E-08 | -0.62093 | 0.55432 | -6.5E-08 | 3.8E-08 | -6.5E-08 | 3.8E-08 |
Energy Companies and Portfolio of Renewables
The energy companies shifting portfolio towards renewables is a distinct sustainability business model renovation step. That transition plays an integral part in their CSR strategy as companies are predictable to inscription social as well as environment problems. A recent decision belongs to the Netherlands court is ordering Shell to reduce its CO2 emissions by 45% compared to 2019 levels by 2030. In addition, the verdict said “The Shell group is responsible for its own CO2 emissions and those of its suppliers”.
Largest oil and gas companies in the world, ranked by reserves, Source: Energy Intelligence (2016), Energy Business Review (2016), and companies’ websites.
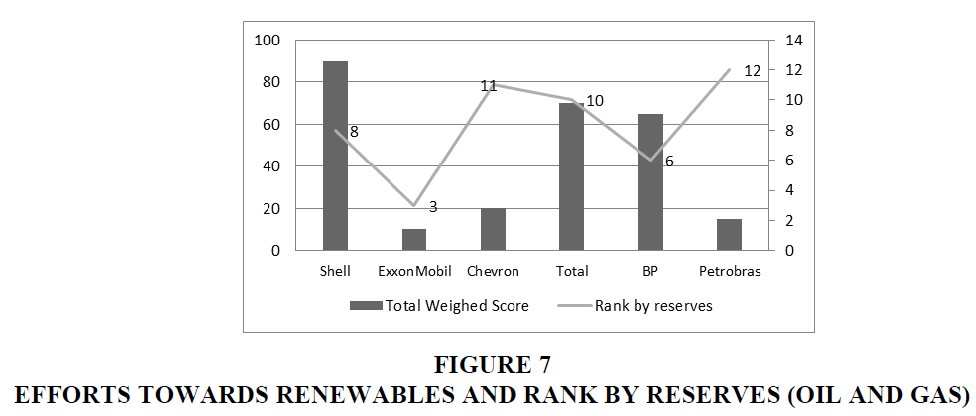
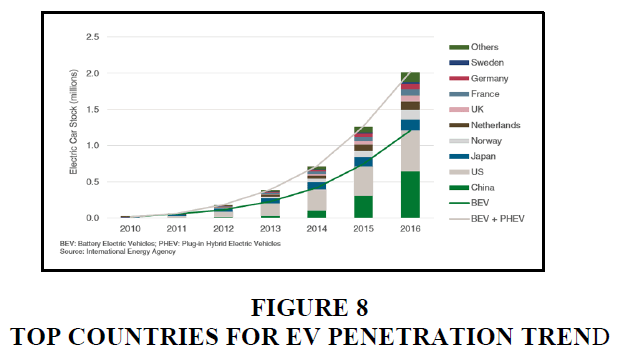
The Figure 7 Efforts towards renewables and rank by reserves (oil and gas) classifies eight majors Oil and Gas Companies on their efforts towards renewables energies (Hydro, Solar, Wind, Biofuels, Carbon Capture, Geothermal and Energy Storage/EV Charging). The Criteria utilized have a dual nature. Qualitative (no activity: 0, activity: 1) & Quantitative e.g., billion $ for capital investments. A weighing factor has been applied to highlight actual spending. We observe two main patterns; firstly, all the firms, except ExxonMobil, have announced a renewable strategy in wind and solar sectors. Secondly, none of the eight oil majors decided investing further on Geothermal. Biofuel and Energy Storage is well represented and we illustrate the correlation of market trend for electrical vehicles Shows that Renewable Leaders and Laggards between Oil Major (Source: Energy Strategy Reviews 26 (2019) 100370) are shown in the Table 7.
| Table 7 Shows that Renewable Leaders and Laggards Between Oil Major (Source: Energy Strategy Reviews 26 (2019) 100370) | |||||||||
| Assessment criteria | Weights | Shell | ExxonMobil | Chevron | Total | BP | Eni | Petrobras | Equinor |
| Hydro | 5% | 0 | 0 | 0 | 1 | 0 | 0 | 1 | 0 |
| Solar | 5% | 1 | 0 | 1 | 1 | 1 | 1 | 1 | 1 |
| Wind | 5% | 1 | 0 | 1 | 1 | 1 | 1 | 1 | 1 |
| Biofuels | 5% | 1 | 1 | 0 | 1 | 1 | 1 | 0 | 0 |
| Carbon Capture | 5% | 1 | 1 | 1 | 1 | 1 | 1 | 0 | 1 |
| Geothermal | 5% | 0 | 0 | 0 | 0 | 0 | 0 | 0 | 0 |
| Energy Storage/EV Charging | 5% | 1 | 0 | 0 | 1 | 1 | 0 | 0 | 1 |
| Explicit Renewable Strategy/ Renewable Capital Allocation | 5% | 1 | 0 | 0 | 1 | 1 | 1 | 0 | 1 |
| Capital Investment into Renewable (Billion $ per year) | 50% | 1 | 0 | 0 | 0.5 | 0.5 | 0.3 | 0 | 0.5 |
| Dedicated Renewable team | 5% | 1 | 0 | 0 | 1 | 1 | 1 | 0 | 1 |
| Renewable Venture Capital Arm | 5% | 1 | 0 | 1 | 1 | 1 | 1 | 0 | 1 |
| Total Score | 100% | 9 | 2 | 4 | 9.5 | 8.5 | 7.3 | 3 | 7.5 |
| Total Weighed Score | 90% | 10% | 20% | 70% | 65% | 50% | 15% | 60% | |
Three companies out of the eight oil majors score above 60% (Shell, Total and BP) while three of them are below 25% (Chevron, ExxonMobil and Petrobras). When combining efforts towards renewables and rank by reserves, we would expect to see a correlation with the laggards and the amount of proven reserve. The assumption is validated for Exxon Mobil, which ranks at the third place. However, we could expect greater efforts from Chevron and Petrobras scoring at the 11th and 12th place at the ranking respectively. The financial might partially explain the observation. With a revenue 2015 of 268.9 US$ billion, ExxonMobil has shown a net income 16.15 US$ billion for the same year. Among the six firms been analyzed in Figure 7 Efforts towards renewables and rank by reserves (oil and gas), Chevron and Petrobras have the lowest revenue with 129.9 and 100.7 US$ billion as well as net income with -0.5 and -4.84 US$ billion respectively. Top countries for EV penetration trend are shown in the Figure 8.
The strategy in renewable described in Figure 1 (2016) can be linked with oil and gas reserves as per Figure 7. The financials substantiate this observation. Exxon has strong top and bottom line but trend is negative over the period and considering reserves among the top three, the company remained cautious to make an important strategic shift towards renewables. Shell while having less reserves, solid income with a very positive trend over 2015-2016 has chosen to invest massively into Renewable. Finally, Chevron and Petrobras would certainly have invested more into green using only the reserves factor however their financials did not allow them to do so. Among the eight companies as per figure, Exxon Mobile, Chevron and Petrobras are the only ones that did not even have an explicit renewable strategy. Exxon Mobile and Petrobras the only two that did not set-up a Venture Capital structure to invest in renewable. Annual Net Income is shown in the Table 8.
| Table 8 Annual Net Income | ||||||
| Annual Net Income (US$ billion) | 2013 | 2014 | 2015 | 2016 | 2015 vs 2014 | 2016 vs 2015 |
| Exxon | $32,580.00 | $32,520.00 | $16,150.00 | $7,840.00 | -50.34% | -51.46% |
| Shell | $16,371.00 | $14,874.00 | $1,939.00 | $4,575.00 | -86.96% | 135.95% |
| Chevron | $21,423.00 | $19,241.00 | $4,587.00 | ($497.00) | -76.16% | -110.83% |
| Petrobras | $11.09 | ($7.37) | ($8.45) | ($4.84) | 14.65% | -42.72% |
Solar Investment Plans of Indian Companies
The following investment announcements in the Indian company illustrate the intent to move towards a sustainable business model.
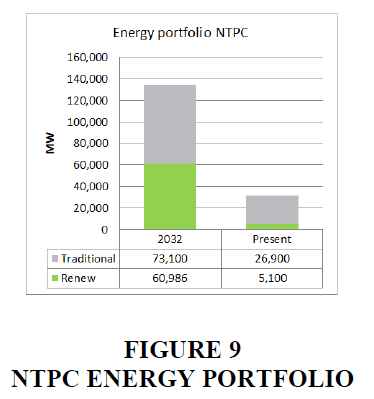
In case of NTPC strategies to produce overall assets expenses of Rs1 trillion among 2019 and 2024 to become a 130 GW power manufacturer by 2032. Hence, it around 4GW power renewable sources, typically solar, and also strategies to improve at minimum 5GW power solar sources in two years. After that it will attain at minimum 1GW power of effective solar plans as part of its plan having power of 32GW hygienic energy selection by 2032.
Present National Thermal Power Corporation energy portfolio having power of 66 GW of installed capacity of which only 8% is renewables. So, by 2032 it will be 41% of their energy portfolio. NTPC Energy Portfolio is shown in the Figure 9.
Coal India Ltd (CIL)to utilize power by solar source as a different source of energy subalternate manner then the overall volume of mounted roof topmost at CCL-872.5 kWp, ECL-197 kWp, BCCL-6 kWp, Coal India Office, HO, Kolkata-160 kWp, WCL-1097 kWp, CMPDIL HQ and others-500 kWp. Today they have 4.35 MW installed capacity of solar power (India). By 2040 the company plans to generate 20 GW of energy through solar (PTI)
During renewable energy areas, CMD, Oil India spoken in AGM that overall mounted volume of OIL erect at 188.10 MW power during March 31, containing of 174.10 MW power through wind projects in the same way solar projects of 14 MW, thus the overall returns of Rs 138 crore was produced from these resources during 2019-20.
GAIL plans to have 1 GW of renewable energy in its portfolio with a plan to spend INR 4000 crs. (PTI) The company has put a Rs 1,000-crore bet on setting up two each for producing ethanol and Compressed Biogas (CBG) from municipal waste.
Limitations of this Study
The data for only last 3 years was analyzed. Only 19 firms were analyzed in the study. A much larger research frame would have been more desirable. Also, the effect of inventory days outstanding was not factored into the study. The solar portfolio and revenue analysis for EPC companies in order to observe the portfolio shift was not carried out in the study. The causality of CSR performance to trade credit was not researched this may be investigated further.
Scope for future Research
Further research on relationship between trade credits extended by suppliers can be taken up with a larger dataset. Also effect of working capital needs on CSR performance may be studied w.r.t sustainable financing goals. An empirical study in this area will provide a good scope for further research. An analysis of stock prices and meeting sustainable energy goals may be studied. Analysis of shift of portfolio towards renewables for EPC companies will be another area of future research. The causality of CSR performance to trade credit was not researched this may be investigated further.
Conclusion
Energy companies are extending more credit to the clients than what they are receiving from the suppliers. We also found that CSR performance w.r.t turnover that that to net profit is more strongly related to AR outstanding day’s i.e. As turnover increases more trade credit is extended to clients. The trade credit extended to clients is negatively correlated to CSR performance and hence, as CSR performance increases, the clients will be willing to pay earlier, thus reducing working capital financing. We did not find a statistically significant relationship between trade credits extended by suppliers though, a trend showing availability of credit was found. We found a statistically significant relationship between net cash flow and CSR performance. It was observed that with an increase in net cash flows there is a tendency to limit CSR performance. This is an indication that if the compliance of CSR expenditure is removed, there may be a tendency to limit CSR, due to the lack of knowledge that CSR expenditure has a positive impact on working capital and thus reducing cost of capital. The awareness about the effect of CSR taking place through trade credit also working capital needs to be increased.
A distinct shift towards renewables is visible, but the companies with larger oil reserves though claiming to move towards renewables are not aggressive in meeting the goals. Also we found that Indian companies are more open in publishing their CSR spending and most of the public sector companies outperform their budgeted targets, whereas global energy companies do not explicitly publish these spending. It is also seen that the quality of CSR disclosures of Indian Firms is in most cases much better than many global firms. Hence, our study shows that CSR impacts the achievement of business sustainability growth in a multi-dimensional manner.
References
Adhikari, B.K. (2016). Causal effect of analyst following on corporate social responsibility. Journal of Corporate Finance, 41, 201-216.
Indexed at, Google Scholar, Cross Ref
Arcuri, M.C., & Pisani, R. (2021). Is Trade Credit a Sustainable Resource for Medium-Sized Italian Green Companies?. Sustainability, 13(5), 2872.
Indexed at, Google Scholar, Cross Ref
Attig, N., El Ghoul, S., Guedhami, O., & Suh, J. (2013). Corporate social responsibility and credit ratings. Journal of Business Ethics, 117(4), 679-694.
Indexed at, Google Scholar, Cross Ref
Boubaker, S., Cellier, A., Manita, R., & Saeed, A. (2020). Does corporate social responsibility reduce financial distress risk?. Economic Modelling, 91, 835-851.
Indexed at, Google Scholar, Cross Ref
Boubaker, S., Chourou, L., Haddar, M., & Hamza, T. (2019). Does employee welfare affect corporate debt maturity?. European Management Journal, 37(5), 674-686.
Indexed at, Google Scholar, Cross Ref
Cai, W., Lee, E., Xu, A.L., & Zeng, C.C. (2019). Does corporate social responsibility disclosure reduce the information disadvantage of foreign investors?. Journal of International Accounting, Auditing and Taxation, 34, 12-29.
Indexed at, Google Scholar, Cross Ref
Cheng, B., Ioannou, I., & Serafeim, G. (2014). Corporate social responsibility and access to finance. Strategic Management Journal, 35(1), 1-23.
Indexed at, Google Scholar, Cross Ref
Deng, X., Kang, J.K., & Low, B.S. (2013). Corporate social responsibility and stakeholder value maximization: Evidence from mergers. Journal of Financial Economics, 110(1), 87-109.
Indexed at, Google Scholar, Cross Ref
El Ghoul, S., Guedhami, O., Kwok, C.C., & Mishra, D.R. (2011). Does corporate social responsibility affect the cost of capital?. Journal of Banking & Finance, 35(9), 2388-2406.
Indexed at, Google Scholar, Cross Ref
Goss, A., & Roberts, G.S. (2011). The impact of corporate social responsibility on the cost of bank loans. Journal of Banking & Finance, 35(7), 1794-1810.
Indexed at, Google Scholar, Cross Ref
Harjoto, M., & Laksmana, I. (2018). The impact of corporate social responsibility on risk taking and firm value. Journal of Business Ethics, 151(2), 353-373.
Indexed at, Google Scholar, Cross Ref
Herremans, I.M., Akathaporn, P., & McInnes, M. (1993). An investigation of corporate social responsibility reputation and economic performance. Accounting, Organizations and Society, 18(7-8), 587-604.
Indexed at, Google Scholar, Cross Ref
Kempf, A., & Osthoff, P. (2007). The effect of socially responsible investing on portfolio performance. European Financial Management, 13(5), 908-922.
Indexed at, Google Scholar, Cross Ref
Kim, Y., Li, H., & Li, S. (2014). Corporate social responsibility and stock price crash risk. Journal of Banking & Finance, 43, 1-13.
Indexed at, Google Scholar, Cross Ref
Kleine, A., & Von Hauff, M. (2009). Sustainability-driven implementation of corporate social responsibility: Application of the integrative sustainability triangle. Journal of Business Ethics, 85(3), 517-533.
Indexed at, Google Scholar, Cross Ref
Lee, D.D., Faff, R.W., & Langfield-Smith, K. (2009). Revisiting the vexing question: Does superior corporate social performance lead to improved financial performance?. Australian Journal of Management, 34(1), 21-49.
Indexed at, Google Scholar, Cross Ref
Lu, J., Ren, L., Yao, S., Qiao, J., Strielkowski, W., & Streimikis, J. (2019). Comparative review of corporate social responsibility of energy utilities and sustainable energy development trends in the Baltic states. Energies, 12(18), 3417.
Indexed at, Google Scholar, Cross Ref
Manish, S., Pillai, I.R., & Banerjee, R. (2006). Sustainability analysis of renewables for climate change mitigation. Energy for Sustainable Development, 10(4), 25-36.
Indexed at, Google Scholar, Cross Ref
Margolis, J.D., & Walsh, J.P. (2003). Misery loves companies: Rethinking social initiatives by business. Administrative Science Quarterly, 48(2), 268-305.
Indexed at, Google Scholar, Cross Ref
McMillan, J., & Woodruff, C. (1999). Interfirm relationships and informal credit in Vietnam. The Quarterly Journal of Economics, 114(4), 1285-1320.
Indexed at, Google Scholar, Cross Ref
Ng, C.K., Smith, J.K., & Smith, R.L. (1999). Evidence on the determinants of credit terms used in interfirm trade. The journal of finance, 54(3), 1109-1129.
Indexed at, Google Scholar, Cross Ref
Prommin, P., Jumreornvong, S., & Jiraporn, P. (2014). The effect of corporate governance on stock liquidity: The case of Thailand. International Review of Economics & Finance, 32, 132-142.
Indexed at, Google Scholar, Cross Ref
Sharfman, M.P., & Fernando, C.S. (2008). Environmental risk management and the cost of capital. Strategic Management Journal, 29(6), 569-592.
Indexed at, Google Scholar, Cross Ref
Shou, Y., Shao, J., Wang, W., & Lai, K.H. (2020). The impact of corporate social responsibility on trade credit: Evidence from Chinese small and medium-sized manufacturing enterprises. International Journal of Production Economics, 230, 107809.
Indexed at, Google Scholar, Cross Ref
Statman, M., & Glushkov, D. (2009). The wages of social responsibility. Financial Analysts Journal, 65(4), 33-46.
Sun, W., & Cui, K. (2014). Linking corporate social responsibility to firm default risk. European Management Journal, 32(2), 275-287.
Indexed at, Google Scholar, Cross Ref
Tsuruta, D. (2015). Bank loan availability and trade credit for small businesses during the financial crisis. The Quarterly Review of Economics and Finance, 55, 40-52.
Indexed at, Google Scholar, Cross Ref
Wu, M.W., & Shen, C.H. (2013). Corporate social responsibility in the banking industry: Motives and financial performance. Journal of Banking & Finance, 37(9), 3529-3547.
Indexed at, Google Scholar, Cross Ref
Wu, W., Firth, M., & Rui, O.M. (2014). Trust and the provision of trade credit. Journal of Banking & Finance, 39, 146-159.
Indexed at, Google Scholar, Cross Ref
Xu, H., Wu, J., & Dao, M. (2020). Corporate social responsibility and trade credit. Review of Quantitative Finance and Accounting, 54(4), 1389-1416.
Indexed at, Google Scholar, Cross Ref
Zhang, Y., Lara, J.M.G., & Tribo, J.A. (2020). Unpacking the black box of trade credit to socially responsible customers. Journal of Banking & Finance, 119, 105908.
Indexed at, Google Scholar, Cross Ref
Received: 03-Sep-2022, Manuscript No. BSJ-22-12589; Editor assigned: 05-Sep-2022, PreQC No. BSJ-22-12589(PQ); Reviewed: 19-Sep-2022, QC No. BSJ-22-12589; Revised: 21-Sep-2022, Manuscript No. BSJ-22-12589(R); Published: 28-Sep-2022
