Research Article: 2021 Vol: 25 Issue: 2
Default In The US Peer-To-Peer Market With Covid-19 Pandemic Update: An Empirical Analysis From Lending Club Platform
Nguyen Thi Tuong Anh, Foreign Trade University, Vietnam
Pham Thi My Hanh, Foreign Trade University, Vietnam
Vu Thi Le Thu, JA Vietnam Co.Ltd
Citation Information: Nguyen Thi Tuong Anh, Pham Thi My Hanh, Vu Thi Le Thu. (2021). Default In The Us Peer-To-Peer Market With Covid-19 Pandemic Update: An Empirical Analysis From Lending Club Platform. International Journal of Entrepreneurship, 25(7), 1-19.
Abstract
The Covid 19 Pandemic has rapidly accelerated the structural shift toward fully digital solutions, hence uplifting demand for virtual financial services such as digital lending services. This paper aims to predict the probability of loan defaults in the US Peer-to-Peer lending market through utilizing the dataset of Lending Club, the biggest US P2P lending platform, which covers 1,137,850 loans within the period from Q1 2017 to Q3 2020. A logistic regression model is developed to consolidate strong evidence of Borrowers characteristics, Loan characteristics and Credit Characteristics on the likelihood of defaulted loans. More importantly, the impact of Covid-19 pandemic presence is found visible for the performance of the defaulted loans in this P2P market
Keywords
P2P Market, Lending Club, Covid-19.
JEL
G41, G51, G23
Introduction
Peer-to-peer lending (P2P lending), also referred to as “debt crowdfunding” or “marketplace lending,” is an online marketplace where individuals can lend money to or borrow from other individuals without the intervention of different financial intermediaries. (Zhao, Ge, Liu, Wang, Chen, & Zhang, 2017). This new lending model has been rapidly gaining market share in consumer lending over the last decade worldwide. The global P2P lending market has shown extraordinary growth rates since 2013 and grew at around 25% during 2014-2019 (The Cambridge Center for Alternative Finance-CCAF) meanwhile the U.S. Treasury (2016) expects the market to be worth around $90 billion in 2020. Being a new way of facilitating money without the intermediation of a financial institution, P2P lending development is remarkable, both in terms of the number of loans, amount of loans and the number of lenders and borrowers in the market.
The COVID-19 pandemic, which began in China in 2019 and spread to almost all countries in the world with more than 172 million infected cases and nealy 3,700 deaths up to early of June 2021 (https://www.worldometers, 2021) resulted in crisis not only in the global health system but also in international financial and economy (Masoud and Bohra, 2020; O. P..Putri et al., 2021). However, the pandemic has also offered opportunities for the fintech sector as fintech business models are better suited to meet the new requirements of social distancing and remote work, giving an important advantage to those financial intermediaries with good ICT infrastructure and a higher share of IT-skilled employees (IMF, 2020). The pandemic has rapidly accelerated the structural shift toward fully digital solutions, hence uplifting demand for virtual financial services such as digital lending services. Under Covid 19 pandemic, on the one hand, demand for digital lending services has been developed due to liquidity pressures among firms and households and the widespread use of government guaranteed lending programs. On the other hand, due to economic difficulties during the pandemic, the probability of having loan default in the market may also be higher.
This paper aims to explore the determinants of default loans in the P2P lending market by investigating the case of Lending Club performance. Moreover, the paper seeks the impacts of Covid-19 pandemic on the probability of having loan default in this lending platform.
Background of Peer-To-Peer Lending
Conceptual Framework of P2P Lending
The concept of P2P lending
Peer-to-peer (P2P) platforms are online marketplaces bringing together borrowers and lenders/investors, and offering quick, low cost, technology driven solutions (Derayah Financial, 2017). More concretely, it is a crowd funding type that allows individuals and institutional investors to provide debt financing to a consumer (natural person) or business borrower (legal entity) in the form of a loan agreement that includes the obligation to repay the loan amount including interest if any (p2pmarketdata.com, 2021). P2P platforms employ innovative credit modeling and underwriting for lending, incorporating a variety of data sets (beyond credit scores) to target a wide set of potential customers, benefiting even those borrowers rejected by the traditional bank credit scoring system. For investors, P2P platforms offer automated loan selection features, where predefined criteria can be set by investors for loans they intend to purchase. This model has gained popularity amongst borrowers in the US, UK and other developed and developing markets worldwide due to their lower cost structure and simplified application process.
The Ecosystem of P2P Lending
Figure 1 below represents the basic model of P2P platform operation with three players: Investors, Debtors and P2P platform. The function and operation of each member will be explained in more detail as follows:

Figure 1 Basic Model of P2p Platform Operation
Lenders (Investors) in peer-to-peer lending can be both private individuals and institutional investors. Everyone who fulfils objective criteria like nationality, legal age,…. can normally invest in P2P loans. The reward received by investors in P2P lending is interest payments that depend on the borrower’s risk of default and the term of the loan.
Borrowers (Debtors) in this model can be both businesses and private individuals, who cannot formally access the loan through the traditional banking system. They must pass a credit rating system that defines whether it is possible to borrow and on what terms.
P2P lending platforms enable interactions between the demand side (borrowers) and supply side (lenders) of the funding process. To generate a well-functioning marketplace, the two most essential roles of platforms are to enlist borrowers and lenders and to set the rules and terms of engagement between the two sides. Aside from market-making, other primary functions of P2P platforms also comprehend loan processing and activities contributing to building a community. In essence, the main sources of income for platforms in peer-to-peer lending are origination fees charged to the borrower, repayment fees charged to the lender, and/or other fees like loan part trading fees and late fees.
Platforms in P2P lending generally operate with lower operating costs compared to conventional credit institutions, which enables them to offer attractive conditions for both lenders and borrowers by transferring these lower costs across both the supply and demand side. Thus, in the best-case scenario lenders are offered attractive returns compared to other savings and investment products and borrowers are provided an easier access to capital, more competitive interest rates, and a more expeditious process compared to similar products offered by traditional banks. In addition, according to Cummins et al., (2019), in the P2P lending, lenders are attracted by risk diversification, lower transaction costs, and access to market, while borrowers are attracted by transparency and, in some cases, the promise of non-collateralized loans.
On peer-to-peer lending sites, borrowers complete an online application and provide information about themselves. The credit reports of borrowers are then used to assign a loan grade using a proprietary scoring system. The loan grade sets a range of possible interest rates. If the loan application is approved, the peer to peer lending platform typically obtains a credit report on the applicant. Self-reported information from a borrower is also compared with the borrower’s credit report. Normally, P2P lending companies use FICO scores as a baseline for screening out loan applicants below a given score. Moreover, they also rely on additional selfreported information that traditionally are not reported to credit bureaus to evaluate the borrowers. Some documentation requested by the platforms are typical from what a loan officer would request at a bank, such as payslips as proof of income. However, peer-to-peer lending companies may also require less conventional information, such as college major or length of study in the case of student loans.
Literature Review
Determinants of Borrowers’ Loan Default
Peer-to-peer lending is a risky business because of the asymmetric information between lenders and borrowers. Borrowers are supposed to have more information than lenders about their ability to pay the debt. To reduce the risk, platforms always ask borrowers to provide as much personal information as possible. These attributes help explain not only the funding success (Lee; Lee, 2012; Yum, et al. 2012; Lin et al. 2013; Gonzales; Loureuro, 2014; Zhang; Liu, 2012) but also identify the determinants of loan default in the P2P model. This topic has attracted more attention from researchers recently as this model has grown rapidly all over the world. Researchers may work on data from Prosper and Lending Club in the US (Emekter, R.; Tu, Y.; Jirasakuldech, B.; Lu, M, 2015, Carmichael, D., 2018, Serrano-Cinca, C.; Gutiérrez- Nieto, B.; López-Palacios, L. , 2015, Polena, Michal; Regner, Tobias, 2016) or in other countries like Carlos Eduardo Canfield Rivera (2017) in Mexico, M.Gao and J.Yen (2021) in China, Asta Gaigaliene, dovydas Cesnys (2018) in Lithuania.
Serrano-Cinca, C.; Gutiérrez-Nieto, B.; López-Palacios, L. , (2015) find out that the higher the interest rate is, the higher the probability of default is. The study also confirms that the grade assigned by the P2P lending company is the best default predictor. Loan characteristics such as loan purpose, loan amount; borrower characteristics like annual income, current housing situation, credit history, public records and borrower indebtedness are related to default. However, other common drivers in default studies, such as length of employment, are not significant with default.
Sharing the same point, Polena, Michal; Regner, Tobias (2016) work on the data set consisting of 70,673 loan observations from Lending Club with four loan risk classes and test the significance of the default determining variables within each loan risk class. Moreover, they also see the positive correlation of the debt-to-income ratio, inquiries in the past 6 months and a loan intended for a small business and negative correlation of annual income and credit card as loan purposes with the default rate.
Beside credit grade, which is confirmed in many studies, Emekter, R.; Tu, Y.; Jirasakuldech, B.; Lu, M, (2015) affirm new determinants in P2P default such as debt-to-income ratio, FICO score and revolving line utilization. Loans with lower credit grade and longer duration are associated with a high mortality rate. They also find that higher interest rates charged on the high-risk borrowers are not enough to compensate for higher probability of the loan default.
Other countries also witness the tremendous development of the P2P model together with high risk of loan default. In China, M.Gao and J.Yen (2021) point out that bond yield, which reflects the liquidity level of the market, is the major reason for P2P platforms’ failure and the style factors like the interest rate and ownership, the timing factors like loan maturity and bond yield, and the selectivity factors like popularity are found to be even more significant.
With a unique dataset provided by Prestadero, the largest on-line lending platform with national presence in Mexico, Carlos Eduardo Canfield Rivera (2017) explores the effect of credit scores and other variables related to loan and borrower´s traits, in determining default behavior in P2P lending. The author finds that loan quality, payment-to-income ratio and refinancing on the same platform are positively associated with default behavior. Gender is also mentioned in the research as one of the determinants of loan default.
Studying about a less developed market like Lithuania, Gaigggaliene, Dovydas Cesnys (2018) show a series of determinants that can affect the probability of loan defaults in P2P model such as age, gender, education, marital status besides widely known factors like credit grade or purpose of the loan or loan period.
Having investigated the prior research, we find out the research gap for this study and the research question will be as follows “What are the determinants of loan default in P2P model in the US from 2017 to 2020?”
From the above research question, we build our own model with the following 4 groups of independent variables: Borrowers Characteristics, Loan Characteristics, Credit Characteristics, and Covid-19 pandemic presence, in which:
1. Borrowers Characteristics includes: Annual income; Employee length; Home ownership; Verification status
2. Loan Characteristics includes: Loan amount; Interest rate; Purpose; Loan grade
3. Credit Characteristics includes: Debt to Income; FICO score; Inquiries; Public records; Open credit line; Credit history; Revolving balance
4. Covid-19 pandemic presence
Impacts of Abnormal Events on the Financial Market
Financial market is extremely sensitive and can respond to any event that happens in the economy. The responsiveness of the market is even more significant and may result in dominoeffects if the event is abnormal like SARS disease in 2003, H1N1 disease, MER disease, Terrorist, Flood or most recently Covid-19.
Yongbok Cho.Dowan Kim (2020) study the impacts of A(H1N1), MERS-CoV, COVID-19 on Stock Price Volatilities of Airline Industry in Korea by employing Difference -in-Difference method and conclude that investors about airline stocks or pre investors interested in airline stocks recognize that airline stocks are risky categories compared to other stocks. When novel influenza(A(H1N1)) and the Middle East Respiratory Syndrome Coronavirus (MERSC, MERSCov) had previously occurred, airline stock price volatilities controlled KOSPI index volatility as stock markets are of statistical significance after early and middle term. However, when the COVID-19 has occurred, airline stock price volatilities controlling KOSPI index volatility as stock market volatility are significant after the middle period. Therefore, the COVID-19 results may have been attributed to some of the previous learning processes for infectious diseases.
With the same interest, Chen et.al (2018) also study the impact of SARS on Asian stock market by using Difference -in-Difference method and find out that the S.A.R.S epidemic weakened the long-run relationship between China and the four markets. Therefore, stockholders and policy makers should be concerned about the influence of catastrophic epidemic diseases on the financial integration of the stock market in Asia.
Working on the other object, which is territorism, Imane El Ouadghiria and Jonathan Peillexb (2018) discuss public attention to Islamic territorism and its impact on the stock market, also by using difference-in-difference analysis. The results indicate that US public attention to Islamic terrorism negatively affects US Islamic indices, suggesting that investors may make amalgams between terrorism and Islamic finance.
Bin and Landry (2013) work on another abnormal event, which is flood to find the impact of the event on real estate market and detect that there is no market risk premium for the presence in a flood zone, but find significant price differentials after major flooding events, amounting to a 5.7% decrease after Hurricane Fran and 8.8% decrease after Hurricane Floyd in the US. Results from a separate model that examines more recent data covering a period without significant storm-related flood impacts indicate a significant risk premium ranging between 6.0% and 20.2% for homes sold in the flood zone, but this effect is diminishing over time, essentially disappearing about 5 or 6 years after Hurricane Floyd.
Inspiring from these work as well as there is no research on the impact of Covid-19 on the probability of loan default in P2P market, the authors find out the research gap in the topic that induce a research question as follows “Can Covid-19 increases the probability of loan default in US P2P market?”
Methodology
Regression Model
This research mainly follows the approaches from Carmichael (2014), Emekter et al. (2015) and Li et al. (2016) in utilizing logistic regressions in order to assess the determinants of loan performance for P2P loans and calculate the probabilities of default. As highlighted in Thomas (2010), the advantages of logistic regressions are of good capabilities for predictions and a high accuracy. Additionally, Hosmer & Lemeshow (2013) reaffirms that, under a logistic regression, the likelihood of an event depending on different variables is estimated, and independent variables can be categorical or metric whereas dependent variables are dichotomous or multinomial.
In this study, we apply the binary logistic regression in order to estimate the default determinants of P2P loans and test whether credit characteristics, borrower characteristics, as well as loan characteristics are relevant and significant factors for predicting the default probability. In estimating the P2P loan performance, only two outcomes are possible – ‘default’ and ‘fully paid’ (respectively ‘1’ or ‘0’), hence, the dependent variable is dichotomous and a binary logistic regression is operated.
For the binary model, y and x are defined as:
P (y =1|x) = P(y =1| x1, x2, … , xn) (1)
In this study, we assign a 1 to defaulted loans and a 0 to non-defaulted loans. More concretely, y =0 is the dependent variable that shows the successful repayment of a loan; y = 1 is, respectively, the response, and therefore defined as loan default; x is set as the full set of explanatory variables. All explanatory variables and the related probabilities are summarized in variable d:
 (2)
(2)
β0 is constant, β1 to βk are the regression coefficients, regressing on 4 groups of variables: Borrowers Characteristics, Loan Characteristics, Credit Characteristics, and Covid-19 pandemic presence.
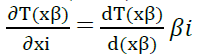
In order to convert the result of Equation (2) to a calculation of the probability of default that is between 0 and 1, the transformation function (T) in Equation (3) is needed:
 (3)
(3)
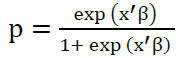
Therefore, the logistic function with the transformation included can be expressed as:
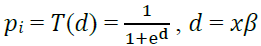 (4)
(4)
To estimate the linearity in the non-linear logistic model, the Maximum Likelihood Estimation (MLE) is used.
 (5)
(5)
Equation (5) gives the effect of every variable x on the probability of default, namely the log Odds.
In order to ensure that the binary logistic regression is applicable in this case, some assumptions need to be fulfilled. Firstly, all observations are independent from others. Secondly, since there are only two possible outcomes ‘default’ and ‘fully paid’ in the empirical model, which are mutually exclusive and exhaustive, hence the assumption of a dichotomous dependent variable is satisfied. Thirdly, though logistic regression does not assume linearity between independent and dependent variables, it assumes linearity between the independent variables and the log odds. This is met as all variables were transformed to an ordinal level. Lastly, the Maximum Likelihood Method needs at a high amount of cases for each parameter, which is fully met in this empirical study.
Coefficients in a binary logistic regression cannot be interpreted as direct and linear influential factors on probabilities. The algebraic sign in estimation results gives a first guess about the direction in which a coefficient pushes the calculated probability. In this study, a positive coefficient shows an increase in the probability of loan success and a negative coefficient witnesses a decrease in the probability of loan success. The relationship between independent and dependent variables can further be described using the Odds ratio/relative risk. With the Odds ratio, the probability for an event (in this case ‘loan default’) is set in relation to the probability that this event does not occur (in this case ‘loan success’). Szumilas (2010) defines the odds ratio as “a measure of association between an exposure and an outcome. The odds ratio represents the odds that an outcome will occur given a particular exposure, compared to the odds of the outcome occurring in the absence of that exposure” (Bewik, Cheek & Ball, 2005; Szumilas, 2010).
The Odds ratio is expressed with the Exp(β), referring to the inverse value of the logarithm function ln β, indicating how much the probability of full loan payment changes by adding one more unit of the corresponding coefficient (ceteris paribus). Odds ratio for the logit model is:
 (6)
(6)
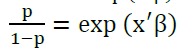 (7)
(7)
 (8)
(8)
P represents the probability of loan default. The odds ratio or relative risk is  and
measures the probability that y=1 relative to the probability that y=0. For each dummy variable,
it is categorized into two groups: the reference group and the comparative group. In estimation,
when compared to the reference group, an odds ratio of more than 1 implies that the comparative
group is more likely to be risky, while a value of less than 1 indicates a smaller likelihood.
Statistical significance is indicated for the 1%, 5% and 10% levels.
and
measures the probability that y=1 relative to the probability that y=0. For each dummy variable,
it is categorized into two groups: the reference group and the comparative group. In estimation,
when compared to the reference group, an odds ratio of more than 1 implies that the comparative
group is more likely to be risky, while a value of less than 1 indicates a smaller likelihood.
Statistical significance is indicated for the 1%, 5% and 10% levels.
Variables
Dependent variable
The dependent variable in the econometric model is “Defaulted loans”, which is defined as a status in which no more repayments of the credit from the borrower are incurred. Lending Club indicated “Default” as no payment has not been made for 121 days or more. In this research, “defaulted loans” is set as y = 1, and “non-defaulted loans” is y = 0, as already explained in the regression model.
Explanatory variables
The explanatory variables in this research has been categorized into 3 main groups: Borrowers Characteristics; Loan Characteristics; and Credit Characteristics. The research also concerns the recent changes in the P2P market under the impacts of Covid 19 Pandemic by integrating the variable Covid-19 Pandemic presence in the model.
Among the variables measuring Borrowers Characteristics, Lending Club focuses on Annual incomes; Employment lengths, Home ownerships and Verification status of the annual incomes of borrowers. These are self-reported variables that are entered by the borrowers themselves when registering at Lending Club or applying for funding. Loan Characteristics are measured under 4 dimensions: Loan amount, Interest rate, Purpose and Loan grade. Borrowers at Lending Club are required to provide detailed information about themselves and their credit history. Afterwards, Lending Club uses this information to assess the likelihood of borrowers’ default and assign him or her an appropriate interest rate with a given grade class. It is generally assumed that the better the grade the more likely is the borrower to repay his or her debt. Finally, to observe the credit characteristics, 8 variables are explored: Debt to Income; FICO score; Delinquencies; Inquiries; Public records; Open credit line; The credit history; Revolving balance; and Revolving line utilization. Table 1 below depicts the definitions of the variables investigated under this research.
| Table 1 Variables Used in this Study | |
| Variable | Definition |
| Y | Defaulted loans |
| Borrowers Characteristics | |
| Annual income | The self-reported annual income provided by the borrower during registration. |
| Employee length | Employment length in years. Possible values are between 0 and 10 where 0 means less than one year and 10 means ten or more years. |
| Home ownership | Equals 1 if a borrower owns a house or hasa mortgage if not the value 0 |
| Verification status | Equals 1 if the annual income and employment length of the borrower have been verified |
| Loan Characteristics | |
| Loan amount | The amount of money that the borrower was able to borrow |
| Interest rate | Interest Rate on the loan |
| Purpose | A category provided by the borrower for the loan request. |
| Loan grade | Created by Lendingclub to access the credit risk of the loan offer, including values from A to G. |
| Credit Characteristics | |
| Debt to Income | Debt - to - income ratio, indicating monthly payments on the total debt obligations, excluding mortgage, divided by self-reported monthly income. |
| FICO score | Computed by the fair Issac Corporation and can be found on the credit file of the borrower. |
| Delinquencies | When the borrower has been late with a payment for more than 30 days |
| Inquiries | The number of inquiries in the past 6 months (excluding auto and mortgage inquiries). |
| Public records | Report bankruptcies, tax liens, civil judgment of borrowers between 7 to 10 years |
| Open credit line | The number of open credit lines in the borrower's credit file. |
| Credit history | Issued date - earliest credit line |
| Revolving balance | Total credit revolving balance |
| Covid-19 pandemic | The presence of Covid-19 pandemic in the studied period. It is a category variable that equals 1 if issue date after 01 April 2020, the milestone for Covid-19 pandemic in the US. |
Data
Data Source
The empirical study uses data from Lending Club, the biggest US P2P lending company. The sample analyzed contains 1,137,850 loans, from Q1 2017 to Q3 2020. All the data are released online by Lending Club and compiled from Lending Club’s website. After having been collected, the data were cleaned and analyzed in Python. The binary logistic regression is utilized as the estimation tool in this research.
Data Description
Table 2 below shows data description for continuous variables in the regression model
| Table 2 Data Description for Continuous Variables | ||||||||
| Variable | Count | Mean | SD | Min | 25% | 50% | 75% | Max |
| Revolving balance | 104,778 | 15,588.19 | 17,238.09 | - | 4,987.25 | 10,328.00 | 19,455.75 | 103,254.00 |
| Public records | 104,778 | 0.11 | 0.31 | 0 | - | - | - | 1.00 |
| Open credit line | 104,778 | 11.89 | 5.75 | 3.00 | 8.00 | 11.00 | 15.00 | 31.00 |
| Loan amount | 104,778 | 13,097.00 | 9,409.23 | 1,100.00 | 6,000.00 | 10,000.00 | 18,000.00 | 40,000.00 |
| Annual income | 104,778 | 86,213.63 | 53,187.95 | 20,000.00 | 50,000.00 | 72,000.00 | 103,200.00 | 325,000.00 |
Delinquencies |
104,778 | 0.23 | 0.64 | - | - | - | - | 4.00 |
| Debt to Income | 104,778 | 19.05 | 9.87 | 1.29 | 11.89 | 18.04 | 25.18 | 53.16 |
FICO score |
104,778 | 709.14 | 36.72 | 660.00 | 680.00 | 700.00 | 730.00 | 810.00 |
Inquiries |
104,778 | 0.52 | 0.77 | - | - | - | 1.00 | 3.00 |
| Credit history | 104,778 | 15.76 | 7.29 | 4.00 | 11.00 | 14.00 | 19.00 | 39.00 |
Table 3 reveals how the loans are distributed among the different variables of interest and gives the distributions of defaulted loans by sub-grades.
| Table 3 Data Description for Category Variables | ||||
| Variable | Total Loan | Defaulted Loan | Ratio defaulted to total loan |
Ratio in total defaulted loan |
| Employment Length | ||||
| < 1 years | 12,564 | 4,856 | 38.65% | 11.59% |
| 1 year | 8,114 | 3,406 | 41.98% | 8.13% |
| 2 years | 10,046 | 4,183 | 41.64% | 9.99% |
| 3 years | 8,585 | 3,543 | 41.27% | 8.46% |
| 4 years | 6,800 | 2,827 | 41.57% | 6.75% |
| 5 years | 7,359 | 3,055 | 41.51% | 7.29% |
| 6 years | 4,940 | 2,040 | 41.30% | 4.87% |
| 7 years | 3,997 | 1,722 | 43.08% | 4.11% |
| 8 years | 3,642 | 1,541 | 42.31% | 3.68% |
| 9 years | 2,790 | 1,166 | 41.79% | 2.78% |
| 10+ years | 33,633 | 13,553 | 40.30% | 32.35% |
| Home Ownership | ||||
| 0 | 41,416 | 18,572 | 44.84% | 42.08% |
| 1 | 63,362 | 25,568 | 40.35% | 57.92% |
| Verification Status | ||||
| 0 53,610 |
25,284 | 47.16% | 57.28% | |
| 1 | 51,168 | 18,856 | 36.85% | 42.72% |
| Purpose | ||||
| Debt consolidation | 53,565 | 22,701 | 42.38% | 51.43% |
| Home improvement | 8,830 | 4,245 | 48.07% | 9.62% |
| Medical expenses | 1,639 | 728 | 44.42% | 1.65% |
| Major purchase | 2,698 | 1,156 | 42.85% | 2.62% |
| Other | 7,731 | 3,050 | 39.45% | 6.91% |
| Moving and relocation | 983 | 449 | 45.68% | 1.02% |
| Business | 1,004 | 441 | 43.92% | 1.00% |
| Vacation | 1,068 | 323 | 30.24% | 0.73% |
| Car financing | 1,258 | 474 | 37.68% | 1.07% |
| Credit card refinancing | 24,951 | 10,251 | 41.08% | 23.22% |
| Home buying | 971 | 285 | 29.35% | 0.65% |
| Green loan | 67 | 37 | 55.22% | 0.08% |
| Grade | ||||
| A | 45,545 | 20,682 | 45.41% | 46.86% |
| B | 26,097 | 10,498 | 40.23% | 23.78% |
| C | 20,693 | 8,859 | 42.81% | 20.07% |
| D | 11,547 | 3,756 | 32.53% | 8.51% |
| E | 875 | 337 | 38.51% | 0.76% |
| F | 6 | 1 | 16.67% | 0.00% |
| G | 15 | 7 | 46.47% | 0.02% |
Concerning the employment length, a large number stem from 10+ years of employment (33,633 loans), however, 7 years length in employment takes up the largest ratio in total defaulted loans (43.08%). The percentage of defaulted loans with 10+ years of employment in total defaulted loans for the employment length category is 32.35%, which is highest in the range. Out of 44,140 defaulted loans in total, homeowners have the higher defaulted loans (57.92%) compared with non-home owners (42.08%). If the annual income and employment length of the borrower have been verified, the default rate is lower (42.72%) compared to that of the other. In terms of loan purpose, debt consolidation constitutes the largest proportion in total defaulted loans and also combined with the highest default ratio (51.43%). Regarding credit grade, most issued loans fit to credit grade A (45,545 loans). Interestingly, 45.41% of the loans get defaulted, which also confirms grade A has the worst loan performance. One of the possible explanations for the big ratio of grade A in the total defaulted rate is about the moral hazard of the grade A borrowers’ commitments that make the loans overdue. Another possible explanation for this departs from the abnormal event of Covid 19 pandemic that might affect the loan performance. The pandemic poses difficulties and risks for the whole society, and probably induce a borrower with a good credit history to get the bigger the loan, heading to the higher risk of being defaulted. Therefore, it is adequate to take a closer look at the frequency distribution by credit grade to examine this abnormal point.
As can be seen from Table 4, conventional trends for defaulted loans would be found for credit grade without Covid-19 pandemic: most issued loans fit to grade A but this grade takes up the smallest ratio defaulted to total loan; while grade D and grade E take up the large ratios in total defaulted loan, reaffirming that the lower the grade, the higher the chances that the loans get defaulted. However, under Covid-19 pandemic, no loans for low grades E, F, G, and most of the issued loans for grade A and also grade A have the largest ratio in total defaulted loan. All things considered, the abnormal trend of credit grade performance during the pandemic would lead to the peculiar tendency of grades in Table 3.
| Table 4 Frequency Distribution by Credit Grade | ||||||||
| Grade | Without Covid-19 Pandemic Presence | With Covid-19 Pandemic Presence | ||||||
| Total Loan | Defaulted Loan | Ratio defaulted to total loan |
Ratio in total defaulted loan | Total Loan | Defaulted Loan | Ratio defaulted to total loan |
Ratio in total defaulted loan | |
| A | 25,938 | 2,563 | 9.88% | 18.23% | 18,705 | 18,059 | 96.55% | 60.75% |
| B | 18,247 | 3,395 | 18.61% | 24.14% | 7,280 | 7,041 | 96.72% | 23.68% |
| C | 15,435 | 4,208 | 27.26% | 29.92% | 4,713 | 4,549 | 96.52% | 15.30% |
| D | 10,900 | 3,552 | 32.59% | 25.26% | 91 | 80 | 87.91% | 0.27% |
| E | 875 | 337 | 38.51% | 2.40% | 0 | 0 | 0 | 0 |
| F | 6 | 1 | 16.67% | 0.01% | 0 | 0 | 0 | 0 |
| G | 15 | 7 | 46.67% | 0.05% | 0 | 0 | 0 | 0 |
Empirical Results and Discussion
Empirical Results
The Table below exhibits the independent-samples t-test to compare the means between two groups (Default=0 and Default=1) in the same continuous, independent variables. Among Lending Club borrowers, considering their revolving balance, loan amount, annual income, delinquencies, debt to Income, FICO score, inquiries, credit history, there were statistically significant differences between the means of the defaulted group and those of the non-defaulted group. However, considering the public record and open credit line variables, there were no statistically significant differences. In other words, we fail to reject the null hypothesis that there are no differences in public record and open credit line between defaulted and non-defaulted loans, respectively in Lending Club before Covid-19 Pandemic starts.
With Covid-19 Pandemic presence, along with public record and open credit line, revolving balance and credit history are also found statistically insignificant differences between defaulted and non-defaulted loans in Lending Club platform. Detailed information can be seen from Table 6 below:
In the next step, we apply binary logistic regression, a well-established technique in evaluating the probability of occurrence of a default. With the aim of analyzing the predictive capability of the variables, odd-ratio logistic regression models have been performed.
The overall model evaluation is justified by using Likelihood ratio test, which is used to test the null hypothesis that any subset of the β's is equal to 0. Then a p-value is computed, indicating the significance of the variables. The likelihood chi square equals 51,794.61 with corresponding p-value=0.000, suggesting the strong significance of the variables in the model.
The values of goodness-of-fit statistics of the model are reported using Pseudo R-square. The value of Pseudo R-square is 0.4621 and indicates that the model accounts for 46.21% of the variation between the two groups of default and non-default loans. In other words, the model was fit to the data well.
Discussion
About Determinants of Loan Default
Regarding the borrower characteristics, “Annual Income”, “Home Ownership” are statistically significant at the 1% significance level. However, the coefficients for “Verification Status” several levels of “Employment Length” are statistically insignificant.
For Annual Income, the odd-ratio of this variable is approximately 1 (0.999), meaning that when the borrower's income increases by 1 dollar, the probability of getting defaulted compared to becoming fully paid is 0.999 times greater. It is evident that as income increases, the likelihood of a loan becoming a default status is lower than that of a fully paid person. However, this difference is almost no different, perhaps because the income here only increased by 1 dollar.
Employment length is a qualitative variable with 11 different levels as analyzed in the description, in which the group of borrowers with less than one year of working experience is the reference group. Only two categories: “Employee length_9 years” and “Employee length_10+ years” are found statistically significant. The odd-ratio ratio is less than 1 which means that the borrowers have more years of employment, the lower the likelihood of their loans becoming the default status. For example, the odd-ratio of the “employee length = 9” variable (those with 9 years of work experience) is 0.859, which means that the probability of their debt becoming the default status is 0.859 times higher or 14.1% lower than that of people with less than 1 year of experience. The logic of this explanation is based on the idea that the longer they work, the higher their income will be, therefore the less risky their loans are.
Home Ownership is also a quantitative variable with two property groups that determine whether the borrower owns a home or collateral for the loan, of which the group does not own the home, or the mortgage is the reference group. The variable Odd-ratio of the variable is 0.684, which means that borrowers who have a home or collateral have a probability of turning their loans to Default status by 0.684 times the probability of turning a loan into the Default status of a group of people at 1% of significance.
Concerning about the loan characteristics, including loan amount, purpose and loan grade in the result table. In general, ‘the loan amount’ and all the different ‘loan grades’ except grade G are significant and positively related with the chance of loan default. However, the conclusion for the ‘purpose’ of the loan is ambiguous with some statistically insignificant findings.
The positive and significant coefficient for loan amount reveals that when the loan increases by 1 dollar, the probability of that loan becoming default status is as that of the probability of a fully paid loan because its odd-ratio is approximately 1.
The second variable in this group is the loan purpose variable, which has 12 dummy variables for each dummy variable as one purpose, where the purpose for business loan is the reference variable. There are five loan purposes that are not statistically significant in the model: Home buying; Home improvement; Major purchase; Green loan; Other loan. From Table 7, borrowers that got a loan for a car loan purpose have 0.779 times more defaulted than borrowers that got a business loan. This seems logical as doing businesses often face many difficulties rather than managing a car loan. On the contrary, the credit card refinancing purpose has an oddratio greater than 1 compared to the reference group. This proves that these loans are riskier than loans for business purposes.
The last variable related to the loan characteristics is ‘the loan grade’. Having grade A as the reference group, the regression results indicate that, except grade G, all the loan grades produce positive and significant coefficients. Additionally, the odd-ratio increases with the loan grade. For example, loans with a loan grade B have a 1.443 times or 44.3% higher of default probability than loans with a loan grade A. While loans with a loan grade F have a 2.545 times or 154.5% higher of probability of loan default than A graded loans. This means that loans with a higher credit grade have a higher loan default probability as well as a higher credit risk. As a result, The LendingClub succeeds in assigning the loan grades to loans with different risks. With this loan grade, The LendingClub is able to transfer information about the credibility of the borrower towards the lender and so decreases the asymmetric information between the two parties.
The last category of determinants is the credit characteristics. Overall, most of the credit variables have a significant impact on loan default except “Open credit line” and “Credit history”.
The first variable that comes from the credit characteristics is the “Debt to Income”. For this variable, the coefficient is expected to be positive. A high “Debt to Income” means that the borrower has a low income or a lot of debt. Both imply that the borrower will have more difficulties to repay the loan than a borrower with a lower “Debt to Income”. In this finding, a borrower with a one standard deviation higher “Debt to Income” ratio will have a 1.005 times higher chance of loan default.
The second variable under investigation is ‘FICO score’. The regression results depict an interesting point of research while witnessing a positive and significant coefficient. This implies that a one standard deviation increase in the FICO score of a borrower leads to a 0.996 time in default probability in comparison with fully paid. In other words, higher FICO score borrowers stand less risk of getting defaulted, which is consistent with the finding for the loan grade presented above.
The next variables that can be found on the credit characteristics of the borrower are interest rate, the number of ‘delinquencies' in the past two years and the ‘inquiries ’in the past six months. For both variables, we detect a positive relation with the probability of loan default. If one standard deviation increases in the delinquencies, the probability of a debt becoming a default status is 0.945 times greater or 5.5% smaller than the probability of a debt with a full paid status, while this number for an inquiry increase of 1.033. Similarly, if one standard deviation increases in the interest rate, the probability of a debt becoming a default status is 1.052 times greater or 5.2% higher than that of a full paid status.
The following variable, ‘public records’, has a positive relationship with the probability of loan default. A one standard deviation increase in the number of public records leads to a probability of loan default higher than probability of loan fully paid is 0.925 times, referring that the defaulted loans are of a higher probability for non-public records borrowers than the other, partly explained because public records borrowers are aware of their behavior to avoid worsening their records so that the probability would be lower.
The last significant variable is ‘the revolving balance’ with a significant coefficient. The higher the revolving balance of a borrower the more credit the borrower can withdraw. This increases his repayment capacity. The regression results show that a standard deviation increase in the revolving balance increases the likelihood of loan default with 0.999 times, which means that a borrower bears a lower risk for being defaulted. However, the difference in probabilities of the two chances is diminutive.
About Impacts of Abnormal Events on the Financial Market
The Covid-19 coronavirus crisis is generating unprecedented strain on individuals, businesses, markets, governments and societies. For the globe, the year of 2020 was a year of health and geopolitical crisis that spilled over into financial markets and the world economy. Therefore, scrutinizing the impact of Covid-19 on enhancing or lowering the possibility of defaulted loans in the financial market in general, especially in the fintech market in particular, is adequate and crucial for investigating. According to the data of CCAF, World Bank and World Economic Forum, in 2020, the worldwide P2P market has shrunk under Covid-19 pandemic with a decrease of 8% in P2P Consumer Lending; an increase of 4% in P2P Business Lending but a downturn of 11% in P2P Property Lending.
In this research, from Table 7, the impact of Covid-19 Pandemic is found to have a positive relationship with the probability of loan default. By the same manner, we detect a significant evidence of covid-19 pandemic presence on the defaulted loans of the borrowers in Lending Club platform. The odd-ratio of Covid-19 epidemic occurrence variable is still approximately 198, indicating that for a unit increase in the presence of the pandemic, the probability of having a default status increases by 198 unit or or 98% higher than that of a non-defaulted loan. This finding also confirms the negative impacts of the epidemic on the performance of P2P market, and support for the argument that digital lending transaction values contracted globally as a result of Covid-19 proposed by Cambridge Centre for Alternative Finance (CCAF), World Bank and World Economic Forum (2020) as indicated before.
To sum up, all the estimation results analyzed in Binary Logistic Regression in Table 7 are in line with the t-test implication illustrated in Table 5 and Table 6, reaffirming the impacts of Covid 19 Pandemic on the performance of lenders and borrowers on Lending Club platform.
| Table 5 T-Test for Continuous Variables without Covid-19 Pandemic Presence | |||||||
| Variable | Default = 0 | Default = 1 | T-test |
P-value |
|||
| N | Mean | N | Mean | ||||
| Revolving balance | 59,578 | 14,951.18 | 14,411 | 15,518.81 | -3.74 | 0.00*** | |
| Public records | 59,578 | 0.12 | 14,411 | 0.12 | 0.44 | 0.66 | |
| Open credit line | 59,578 | 11.69 | 14,411 | 11.62 | 1.30 | 0.19 | |
| Loan amount | 59,578 | 12,817.39 | 14,411 | 14,686.77 | -20.78 | 0.00*** | |
| Annual income | 59,578 | 86,365.93 | 14,411 | 80,720.21 | 11.98 | 0.00*** | |
| Delinquencies | 59,578 | 0.23 | 14,411 | 0.24 | -2.49 | 0.01** | |
| Debt to Income | 59,578 | 18.22 | 14,411 | 20.25 | -21.38 | 0.00*** | |
| FICO score | 59,578 | 709.83 | 14,411 | 696.14 | 46.13 | 0.00*** | |
| Inquiries | 59,578 | 0.55 | 14,411 | 0.61 | -8.25 | 0.00*** | |
| Credit history | 59,578 | 15.53 | 14,411 | 14.68 | 12.56 | 0.00*** | |
| Table 6 T-Test for Continuous Variables with Covid-19 Pandemic Presence | ||||||
Variable |
Default = 0 | Default = 1 | T-test | P-value | ||
| N | Mean | N | Mean | |||
| Revolving balance | 1,060 | 16,147.74 | 29,729 | 16,878.47 | -1.18 | 0.24 |
| Public records | 1,060 | 0.09 | 29,729 | 0.09 | 0.25 | 0.81 |
| Open credit line | 1,060 | 12.18 | 29,729 | 12.39 | -1.21 | 0.23 |
| Loan amount | 1,060 | 11,959.13 | 29,729 | 12,927.29 | -3.24 | 0.00*** |
| Annual income | 1,060 | 98,162.15 | 29,729 | 88,145.27 | 5.44 | 0.00*** |
| Delinquencies | 1,060 | 0.19 | 29,729 | 0.22 | -1.76 | 0.08* |
| Debt to Income | 1,060 | 17.39 | 29,729 | 20.20 | -9.54 | 0.00*** |
| FICO score | 1,060 | 721.83 | 29,729 | 713.61 | 6.89 | 0.00*** |
| Inquiries | 1,060 | 0.56 | 29,729 | 0.42 | 5.88 | 0.00*** |
| Credit history | 1,060 | 17.02 | 29,729 | 16.69 | 1.53 | 0.13 |
| Table 7 Binary Logistic Regression Results | |||||
| Predictors | Coefficient estimate | Standard error | P-value | Odd-ratio | Ratio of probability changes |
| Annual income | 0.00 | 0.00 | 0.00*** | 0.999 | -0,1% |
| Home_ownership | -0.38 | 0.019 | 0.00*** | 0.684 | -31.6% |
| Verification_status | 0.00 | 0.019 | 0.998 | 1.000 | 0% |
| Employee length_< 1 year | 0.24 | 0.039 | 0.00*** | 1.277 | 27.7% |
| Employee length_2 years | -0.01 | 0.039 | 0.89 | 0.995 | -0.5% |
| Employee length_3 years | -0.03 | 0.042 | 0.51 | 0.973 | -2.7% |
| Employee length_4 years | -0.02 | 0.044 | 0.73 | 0.985 | -1.5% |
| Employee length_5 years | 0.01 | 0.042 | 0.86 | 1.007 | 0.7% |
| Employee length_6 years | -0.05 | 0.051 | 0.36 | 0.955 | -4.5% |
| Employee length_7 years | -0.07 | 0.053 | 0.21 | 0.936 | -6.4% |
| Employee length_8 years | -0.04 | 0.057 | 0.46 | 0.959 | -4.1% |
| Employee length_9 years | -0.15 | 0.065 | 0.02** | 0.859 | -14.1% |
| Employee length_10+ years | -0.10 | 0.03 | 0.00*** | 0.903 | -9.7% |
| Loan amount | 0.00 | 0.00 | 0.00*** | 1.000 | 0% |
| Purpose_Car financing | -0.25 | 0.072 | 0.00*** | 0.779 | -22.1% |
| Purpose_Credit card refinancing | 0.09 |
nan |
0.00*** |
1.091 |
9.1% |
| Purpose_Debt consolidation | 0.00 | nan | 0.00*** | 0.998 | -0.2% |
| Purpose_Home buying | -0.07 | 4.39E+15 | 0.997 | 0.935 | -6.5% |
| Purpose_Home improvement | -0.02 | 0.058 | 0.75 | 0.981 | -1.9% |
| Purpose_Major purchase | -0.24 | nan | 0.998 | 0.785 | -21.5% |
| Purpose_Green loan | 0.27 | 0.303 | 0.38 | 1.304 | 30.4% |
| Purpose_Medical expenses | 0.10 | 0.046 | 0.04** | 1.100 | 10% |
| Purpose_Other | -0.15 | nan | 0.878 | 0.859 | -14.1% |
| Purpose_Vacation | -0.28 | 0.011 | 0.00*** | 0.758 | -24.2% |
| Grade_B | 0.37 | 0.035 | 0.00*** | 1.443 | 44.3% |
| Grade_C | 0.61 | 0.052 | 0.00*** | 1.834 | 83.4% |
| Grade_D | 0.58 | 0.081 | 0.00*** | 1.795 | 79.5% |
| Grade_E | 0.75 | 0.117 | 0.00*** | 2.111 | 111% |
| Grade_F | 0.93 | 0.541 | 0.08* | 2.545 | 154% |
| Grade_G | -0.33 | 1.108 | 0.76 | 0.717 | -28.3% |
| Debt to Income | 0.00 | 0.001 | 0.00*** | 1.005 | 0.5% |
| FICO score | 0.00 | 0.00 | 0.00*** | 0.996 | -0.4% |
| Delinquencies | -0.06 | 0.011 | 0.00*** | 0.945 | -5.5% |
| Inquiries | 0.03 | 0.011 | 0.00*** | 1.033 | 3.3% |
| Interest rate | 0.05 | 0.005 | 0.00*** | 1.052 | 5.2% |
| Open credit line | 0.00 | 0.002 | 0.16 | 0.998 | -0.2% |
| Public records | -0.08 | 0.029 | 0.01** | 0.925 | -7.5% |
| Revolving balance | 0.00 | 0.00 | 0.00*** | 0.999 | -0.1% |
| Credit history | 0.00 | 0.001 | 0.61 | 0.999 | -0.1% |
| Covid-19 Pandemic | 5.29 | 0.036 | 0.00*** | 198.004 | 98% |
| Overall model evaluation Likelihood ratio test (Likelihood chi square) |
51,794.61 | 0.00*** | |||
| Goodness- of- fit Pseudo R-square |
0.4621 |
||||
| No. observation | 104,741 | ||||
| Note: ** p < .05; *** p < .01 | |||||
Conclusion
Utilizing the data from Lending Club platform in the US within 2017-2020, a logistic regression model is developed to predict the probability of loan defaults, which consolidates the strong evidence of Borrowers characteristics, Loan characteristics and Credit Characteristics. More importantly, the impact of Covid-19 pandemic presence is found visible for the performance of the defaulted loans in the P2P market. The critical implication generated from our findings is that the Covid-Covid19 epidemic created an extremely high probability of loan default in the market. Thus, investors should be more cautious and pay more attention to the borrower’s characteristics in lending through the P2P platform, especially in the Covid time in order to avoid default.
Acknowledgement
This article is an outcome of the project B2019-NTH-01, which is funded by the Vietnam Ministry of Education and Training.
References
- Bewick, V., Cheek, L., Ball, J. (2005). Statistics Review 14: Logistic regression. Critical Care, 9(1), 112-118. Doi: 10.1186/cc3045.5.
- Cambridge Centre for Alternative Finance (CCAF), World Bank and World Economic Forum. (2020). Global COVID-19 FinTech Market Rapid Assessment Study, from:
- https://www.weforum.org/reports/globalCOVID-19-fintech-market-rapid-assessment-study.
- Carmichael, Don. (2014). Modeling Default for Peer-to-Peer Loans. From:https://ssrn.com/abstract=2529240
- Chen, M.P., Lee, C.C. Lin, Y.H. et al. (2018). Did the S.A.R.S epidemic weaken the integration of Asian stock markets? Evidence from smooth time-varying cointegration analysis, Economic Research-Ekonomska Istra?ivanja. 31(1): 908–926. Retrieved from: https://doi.org/10.1080/1331677X.2018.1456354
- Cummins M., Lynn T., Mac an Bhaird C et al. (2019). Addressing Information Asymmetries in Online Peer-to-Peer Lending, Disrupting Finance, Palgrave Studies in Digital Business & Enabling Technologies. Palgrave Pivot, Cham. Retrieved from: https://doi.org/10.1007/978-3-030-02330-0_2
- Derayah Financial. (2017). Concept study_P2P Lending. Retrieved from: https://web.derayah.com/wp-content/uploads/2017/12/concept_study_p2p_lending_17.pdf.
- Emekter, R., Tu, Y., Jirasakuldech et al. (2015). Evaluating credit risk and loan performance in online Peer-to-Peer (P2P) lending. Applied Economics. 47(1), 54-70.
- IMF, (2020). Fintech in Europe: Promises and Threats. IMF Working Paper. WP/20/241. Retrieved from: https://www.imf.org/en/Publications/WP/Issues/2020/11/13/Fintech-in-Europe-Promises-and-Threats -49859
- Li, Z., Yao, X., Wen, Q et al. (2016). Prepayment andDefault of Consumer Loans in Online Lending. Retrieved from:https://pdfs.semanticscholar.org/3da4/23f11ac23bd0c86592970e544f8d00f5ac05.pdf.
- Masoud, N.; Bohra, O.P., (2020). Challenges and Opportunities of Distance Learning During Covid-19 in UAE. Academy of Accounting and Financial Studies Journal. 24(1):1-12.
- Polena 1,M. and Regner, T. (2018). Determinants of Borrowers’ Default in P2P Lending under Consideration of the Loan Risk Class. Games. 9(82). Retrieved from:10.3390/g9040082.
- Polena, M., Tobias, R. (2016). Determinants of borrowers' default in P2P lending under consideration of the loan risk class. Jena Economic Research Papers. No. 2016-023, Friedrich Schiller University Jena, Jena.
- Putri, A., Retsan, A., Andika, H et al. (2021). Antecedents of panic buying behavior during the COVID-19 pandemic. Management Science Letters , 11(6), 1821-1832.
- P2P Marketdata. (2021). Retrieved from: https://p2pmarketdata.com/p2p-lending-explained
- Szumilas, M. (2010). Explaining Odds Ratios. Journal of the Canadian Academy of Child and Adolescent Psychiatry. 19(3), 227-229.
- Serrano-Cinca, C.; Gutiérrez-Nieto, B.; López-Palacios, L. (2015). Determinants of Default in P2P Lending. PLoS ONE. 10: 1–22.
- The LendingClub. (2020). Data Dictionary, from: https://www.lendingclub.com/info/ download-data.action
- Thomas, L.C. (2010). Consumer finance: Challenges for operational research. Journal of the Operational Research Society. 61(1), 41-52.
- Yongbok Cho.Dowan Kim. (2020). Stock Price Volatilities of Airline From Infectious Disease-Before and After A(H1N1), MERS-CoV, COVID-19. Retrieved from: https://doi.org/10.30529/ amsok. 2020.18.5.003.
- Zhang, J.; Liu, P. (2012). Rational Herding in Microloan Markets. Manag. Sci. 58: 892–912.
- Zhao, H., Ge, Y., Liu, Q et al. (2017). P2P Lending Survey: Platforms, Recent advances and Prospects. ACM Transactions on Intelligent Systems and Technology. 8(6). Retrieved from: https://www.worldometers.info/coronavirus/