Research Article: 2021 Vol: 25 Issue: 1S
Developing Fairness Quarterly-Annually Bonuses' Formulation for Employees: The Industrial Relations to Treat Equal Rights
Hesty Prima Rini, University of Pembangunan Nasional "Veteran" East Java
Effnu Subiyanto, Widya Mandala Surabaya Catholic University
Keywords
Quarterly-Annually Bonuses, Employees, Salaries, Welfare, Fairness, Formulation, COGS, Revenue, EBITDA.
Abstract
This research aims to propose designing fairness formulation of quarter-annual bonuses to distribute welfare for employees in cement industries in Indonesia. This is to end the conflict that annually occurred due to the unavailability of fairness formulation of bonuses. The methodology used a literature study approach and bolstered by an empirical case study at the cement industries in Indonesia. Comparison has been presented by analysing total bonuses given to employees in a-11 biggest cement makers worldwide in its published annual reports. The factors are then evaluated by exploratory and descriptive analyses. The findings are that five variables must be appropriately considered as determinant factors for developing a formula of bonuses. The variable is production, revenue, COGS, cash, and EBITDA. This research was first developed for usage in cement sectors in Indonesia, but it can be adapted to other sectors of industries with adequate adjustments. Type of businesses should holdings-like where it presents headquarter and members of groups as operational companies. The formula was prior implemented in the biggest SOEs Cement Holdings in Indonesia and practically useful to end the conflict between employees and the management for a decade since 2008.
Introduction
The designing formula of bonuses for employees in certain generally quarterly and annually is still being severely discussed among the Unions and the Management in Indonesia and might happen also at the global scope. Especially in Indonesia's SOEs, the uncertainty formula is frequently triggering industrial disputes and few of them must be mediated and trial in the office of the Ministry of Human Power.
Different from the rights of the Board of Directors (BODs) and the Board of Commissioners (BOCs), they have the absolute right to claim their tantiems and bonuses that at first had been contracted with the Minister of SOEs. In contrast, the employees represented by its Unions have frequently difficulties to claim its rights equally. Many ways open to disregard the employees' rights such as the management develops several new regulations to measure employees' recent performance that takes yearly time, or suddenly campaigning to update recent data of all employees or many other reasons that generally un-explained to employees in advance.
Indonesia's development in treating employees and workers is quite a contrast comparing than to other side countries that are committing to respect labour rights.
Compare to the recent condition globally, distributing bonuses for employees is quite common in the cement makers worldwide. According to the following Table 1, the Author has chosen eleven world-class cement makers in nine different countries to study and elaborate on the fairness of distributing bonuses to employees, and the amount distributed is surprising. The chosen companies are well known as they are at the world-class level; therefore, they should have finished the traditional-conflict problems that in developing countries still outbreaks without clear or firm solutions.
| Table 1 | |||||||
|---|---|---|---|---|---|---|---|
| KEY FINANCIAL INDICATORS OF 11-THE-BIGGEST CEMENT MAKERS WORLDWIDE 2018 | |||||||
| No | Corporations | Country | 2018 in US$ million | ||||
| Revenue | EBITD A | Net Profit | Employees Benefit | The ratio of Employees Benefits to Profit (%) | |||
| 1 | HeidelbergCement | Germany | 19,693.8 3 |
1,921.99 | 1,401.1 8 |
3,303.23 | 235.75% |
| 2 | Taiwan Cement Corp | Taiwan | 3,361.83 | 472.74 | 352.99 | 774.18 | 219.32% |
| 3 | Cemex | Mexico | 13,531.0 0 |
2,685.00 | 528 | 967 | 183.14% |
| 4 | Buzzi Unicem | Italy | 3,130.81 | 628.9 | 417.04 | 526.48 | 126.24% |
| 5 | China National Building Material Co. Ltd |
China | 31,530.3 2 |
6,100.45 | 1,999.8 4 |
2,468.70 | 123.44% |
| 6 | West Cement China Ltd | China | 851.14 | 379.66 | 166.87 | 62.97 | 37.74% |
| 7 | Taiheiyo Cement Corp | Japan | 8,209.53 | 552.65 | 363.07 | 123.03 | 33.89% |
| 8 | Grasim Industries Ltd | India | 7,634.39 | 1,456.79 | 590.99 | 123.03 | 20.82% |
| 9 | Anhui Conch Cement Co. Ltd | China | 18,486.9 0 |
5,712.30 | 4,417.4 9 |
885.22 | 20.04% |
| 10 | Semen Indonesia | Indonesi a | 2,092.26 | 279.65 | 210.16 | 26.76 | 12.73% |
| 11 | LafargeHolcim | France | 28,444.4 9 |
6,230.32 | 1,780.2 4 |
159.49 | 8.96% |
According to Table 1 and further being charted to Figure 1, it can be seen that the HeidelbergCement is the highest ever paying bonuses to employees in 2018 among the lists. The HeidelbergCement, based in Germany, is currently the fourth-largest cement maker by 121.11 million tons of cement production annually. Total employees' benefit annually to its employees reached 235.75% than the net profit they achieved. In contrast, as the biggest in the recent cement-world for the LafargeHolcim has just given for employees benefits at the smallest amount only 8.96% to the net profit. A complete figure of the total amount of bonuses for employees can be seen in Figure 1.

Figure 1 ANNUALLY TOTAL EMPLOYEES BENEFITS FOR THE BIGGEST SELECTED CEMENT MAKERS IN 2018
The figure, unfortunately, does not consistent because in 2019 the selected corporations in terms of the biggest distributing total employee benefits for employees came to the Cemex. Cemex - a Mexican based - today in the world is the fifth largest cement makers as annual capacity avail to produce 87.09 million tons cement. Table 2 explains the changes a year later in 2019.
| Table 2 | |||||||
|---|---|---|---|---|---|---|---|
| KEY FINANCIAL INDICATORS OF 11-THE-BIGGEST CEMENT MAKERS WORLDWIDE 2019 | |||||||
| No | Corporations | Country | 2018 in US$ million | ||||
| Revenue | EBITDA | Net Profit | Employees Benefit | The ratio of Employees Benefits to Profit (%) |
|||
| 1 | Cemex | Mexico | 13,130.00 | 2,378,00 | 143.00 | 1,138.00 | 795.80% |
| 2 | HeidelbergCement | Germany | 20,539.33 | 1,779.25 | 1,353.24 | 3,472.87 | 256.63% |
| 3 | Taiwan Cement Corp | Taiwan | 4,260.59 | 1,044.49 | 774.33 | 1,060.76 | 136.99% |
| 4 | Buzzi Unicem | Italia | 3,509.96 | 793.31 | 420.47 | 564.81 | 134.33% |
| 5 | China National Building Material Co. Ltd | China | 36,483.96 | 6,877.33 | 2,653.32 | 2,773.64 | 104.53% |
| 6 | Grasim Industries Ltd | India | 9,767.7 | 1,716.07 | 367.71 | 204.67 | 55.66% |
| 7 | West Cement China Ltd | China | 1,043.45 | 443.88 | 259.30 | 78.11 | 30.12% |
| 8 | Taiheiyo Cement Corp | Japan | 8,633.22 | 557.67 | 409.50 | 123.30 | 30.11% |
| 9 | Anhui Conch Cement Co. Ltd | China | 22,608.61 | 6,420.74 | 4,951.48 | 1,072.46 | 21.66% |
| 10 | Semen Indonesia | Indonesia | 2,752.27 | 217.89 | 161.67 | 20.58 | 12.73% |
| 11 | LafargeHolcim | France | 27,673.99 | 6,372.2 | 2,602.53 | 239.23 | 9.19% |
Ironically the unexpected things even happen to Semen Indonesia in Indonesia. The Annual report had been published with a certain amount obliges to be given for employees as annual bonuses 2019 stipulated at the Collective Labor Agreement (PKB) 2019 to 2021, but the funding is in the BODs' custody without adequate explanation. The position of the SOE's Semen Indonesia in this regard fell at the lowest total amount of bonuses to its employees as we can see in Figure 2. It implies not a good industrial relation communication between the Union and Management (Subiyanto, 2020b). This was looking associate and related after the office had the acquisition of the Holcim Indonesia at end of 2018 (Subiyanto, 2020a).

Figure 2 ANNUALLY TOTAL EMPLOYEES BENEFITS FOR THE BIGGEST SELECTED CEMENT MAKERS IN 2019
Engaging at the uncertain trend of employees' benefits of quarterly-annually bonuses delivered to employees for well-known cement makers globally, it can be imagined the worst things certainly happened in the smaller corporations in a local class. The typical-type of industries are generally new entrants that still seeking market-share or the industries at the remote area which are strongly driven by the principal-agents approach. The discriminative treatment of employees is still common in the part of Indonesia's remote islands.
If everyone is disregarding these important issues, then bonuses will be easily being forgotten. It is urgent to be initiated and to be discussed by request or by demand, but first, it requires an adequate model or formulation. If this issue of formulation remains un-developed prior then the discussion will take a longer time even more yearly based on experience in Indonesia, and the result will be unfair enough from the perspective of employees. It is then urgently needed, a fair justice formulation to accommodate and pay its rights equally according to the obligation employees have given.
This research has intentions to build harmony in the industrial relationship between the Unions and the Management to avoid unnecessary future conflicts and disputes due to absenteeism both agreed formulation in advance. The ironic thing generally happened in Indonesia, when annual reports have been published, then the BOD is unwilling to distribute bonuses due to pragmatism considerations and reluctant to explain. The worst thing, the formulation has just being discussed in rush time at the end of the year and finally disappointed for employees and triggering dissatisfaction and conflicts.
The study has been chosen as this issue is relatively new and not many researchers have taken pay attention to make a deeper exploration in the area.
Literature Review
The income of employees is an important aspect of workers' life. The income is divided into basic salary and additional subsidies or compensation. The compensation schemes in every country should vary, but most of them identical. In the case of compensation, wage, or salary; the workers and employees worldwide are united in a common language. All of them are rights.
Blumkin et al., (2020) identified wage as an element that reciprocates to the results or outputs and productivity. They are concerned that wages and or subsidies or bonuses can be a distinctive motivation to drive higher effort and subsequently to increase production. Though the bonus has been applied based on unfairness subjective measure, the achievements still had increased and made better company performance overall (Voubem et al., 2020). Han & Shen (2007) confirmed earlier that in Taiwan's high-tech industries sector, the bonus systems have positive impacts to have relied on the firm performance.
Sheng and Huang (2019) shed a significant correlation between premium wage and business strategy. These are to support Delahaie and Duhautois (2019) that firmly stated profit in a firm or corporate must be shared with employees. There were two methods as a wage-based and, second, as an ‘efficiency wage’ that adds to the base wage and increases total compensation. This is to avoid inequality between managers and staff (Bartling and Siemens, 2011). To keep climate and to maintain spirit and loyalty.
However, the challenge of wage and bonuses for employees is experiencing long term severe debate for a decade. The wage(s) and bonuses based on corporate consideration are associated with the costs. The contrast to the labour’s views that wage(s) are rights, equal treatment, and representing justice or rights. It is not surprising, within the perfect labor markets, the corporate has never invested or accommodated general skills and therefore all costs of generally special training are borne by workers (Acemoglu and Pischke, 1999). Though Ng (2010) warned that decreasing or lowering salary structures have a consequence to increase labour turn over, but it was relatively ignored by generally business leaders. Therefore, in this case, it will be mandatory for government intervention to stabilize and the possibility to increase relatively income structures for labour.
According to Ng (2010), many options could be applied by the government to stabilize income, one of which is by tax credits or universal credits policies. It was done by the United Kingdom (Hirsch, 2017) when the low-wage reached a level shown to be harming jobs, this could seriously undermine society and stability. The UK government then enacted tax-subsidy policies to influence the situation and it was then well managed before too late. The companies had been given tax subsidies and therefore the companies delivered additional income to labour in the form of bonuses or additional others.
In this case, the country that has proven care for its workers' welfare finds in Singapore. Ng and Sim (2012) noted in their paper, Singapore has instead taken steps to raise the status of social workers. The responsible agencies of social service had made implementing salary revisions including bonuses. However, Singapore is also challenged in the problem of expanding the manpower pool, distributing resources to different types of social workers, and addressing issues related to program-based funding. Important to be noted that the terms of wage and salary which is including pension schemes (Linnemann, 2011).
The crucial income structure was airing many researchers worldwide. Lee & Lin (2014) by treating quantitative research employed correlation and regression methods have well explained the nexus of income satisfaction, psychological contract, and job enthusiasm. The research best revealed that all factors observed are significantly correlated, it meant when employees have sensed their income is lower than the market average, they will be having unsatisfactory feelings, make less effort to the organization and feel tired or want to leave the job. Lee & Lin (2014) in conclusion have suggested that every business should conduct an income survey regularly, understand the fairness of the average income in the market, and adjust income mechanisms periodically based on the organization's financial status.
The wage which bonuses inside as generally said income is important as a driver to hold talented employees remain at the offices. According to Baghai et al., (2020), the firms in bankruptcy will lose workers with the highest cognitive and non-cognitive skills. Talent employees are being associated with higher labor costs of financial distress, firms that rely more on talent have more conservative capital structures. McLaren (2017), Turqo & Parteka (2011) are part of researchers who have interested to study labor in terms of high-low skill and talented employees.
Within holdings-type industries; even more, the income is a lot of influenced by other aspects generally we consider. Braunerhjelm & Thulin (2009) have inserted a location factor of multinational corporations as one of the income's structure. The social worker's organization or Union in this case is the first line to vow the consideration to the management (MSW, 2008; Walker, 2016). But the influence of Unions in the case in Cambodia and Indonesia to defend floor wage has so far failed to gain traction (Ford & Gillan, 2017). These are due to the national systems as the two countries made a lot of considerations of national economic, political, and institutional contexts. The factors are the primary drivers of the strategies and priorities of constituent organizations, governments, and industry stakeholders. It worsened due to the absence of robust local and regional coalitions of Unions, and therefore the advocating common and coordinated regional approach to living wages is thus unlikely to gain traction.
But Cambodia and Indonesia are not alone regarding failure to defend the floor wage. China is also experiencing the same (Yano et al., 2010), also in Japan (Hara, 2017), and Sweden (Lombardi et al., 2017). China got problems with the Marginal-Products-Of-Labor (MPL) income gap in the early-reform Chinese economy. The MPL gap was anomalously large for managers in State-Owned Enterprises (SOEs) compared with other categories of labour. The MPL is a source of the unbalance of the floor income to date in China.
In Japan, the problems related to minimum wages also occurred. Every increased minimum wage of 1% causing a 2.8% decline in the formal training of workers. Due to the situation, the minimum wage in the country has relatively stagnant (Hara, 2017). An identical situation in Japan has also happened in Sweden (Lombardi et al., 2018). Surprisingly, un-equal non-linearity in the level of minimum wages has occurred also in the U.S. In this case, the U.S. government has the purpose to protect native workers from competition induced by low-skill immigration (Edo & Rapoport, 2019).
Further potentially to be twisted by problems of the minimum wage will be Thailand (Ketkaew et al., 2019). The country is now entering an aging society while adequate preparations to anticipate retirement were not effective. The result is several elderly living below the poverty threshold during retirement.
To lift the minimum wage is hardly challenging as precarious workers have increased recently worldwide. The precarious workers today popularly are known with the terms of prohire -a short term of professional hired- who encompassed the career of ordinary staffs. Research by Ballafkih et al., (2017) found that the precariat has a diversity of needs, ranging from the need for a higher income to the need for a change in the discourse on self-reliance. This is, however, contradictory to the ideology of downsizing the welfare state, and resulted in the labour market will be insufficient because they meet only a marginal part of the needs of the prohire.
Performance Indicator
There is now come to the most important thing how to measure the performance for every employee fairly and equally. The particular indicators must be set as benchmarking, easily being assessed by employees, same data, same values with as far as possible to avoid distortions, discrimination, and misinterpretations. Wage is a basic part that mandatory and almost all have been ruled and legally counted in every country worldwide. It should not cautious for the wage, but wage is a part of income. This annual income in this research is going to concern which is an additional bonus within.
To determine each employee to be granted amount certain bonus by processing data to make ranking (Kafabih & Budiyanto, 2020). Besides of results given, creativity level can be one of the measurements (Raschshepko, 2016).
A study by MacDiarmid et al., (2018) found that several finance indicators can be used to measure performance fairly. These indicators are revenue, Earnings Before Interest, Tax, Depreciation, and Amortization (EBITDA), cash, and Costs Associated with Goods Sale (COGS). Delen et al., (2013) also strongly agreed to support EBITDA as an imperative factor as one to measure performance indicators.
Zhao (2020) & Subiyanto (2020a) supports that revenue and costs are a strategic factor to identify businesses' performance. Statement of Zhao (2020) has been supported by Selmi & Chaney (2018) in terms of revenue, while Chen et al., (2020) have considered cash as another key. The cash is highly demanded as a reserve for office in anticipating to pay debts.
Besides due to the performance to measure manufacturers, so the production achieved is mandatory as one of the important indicators. Schreiber et al., (2020) have analyzed the Performance Measurement Systems (PMS) as a tool to measure the level of production. Production level is relatively easy to be calculated as to compare target and realization at end of the year.
In general, all factors are not difficult to find, as they should be obtained from the annually published report (Li, 2008).
Methods
The methodology optimized in this research is combining and mixing in literature study approach and bolstered by an empirical case study at the cement industries in Indonesia. Comparison technique has been presented by analysing total bonuses given to employees in a-11 biggest selected cement maker worldwide in its published annual reports. The factors are then evaluated by explorative analyses. The results are then clarified again based on expert judgment (Leontaris et al., 2019; Ong & Chew, 1996).
A literature study has been explored to define which indicators are best to measure performance in a business entity both in practices and a scientific way. There will be three considerations; first, based on financial publicly reports; second, based on operations and productions; and third based on other indicators.
The comparison study is relatively practicable. It establishes to measure in an empirical application. For benchmarking, the 11 biggest cement makers worldwide are meeting to compare one to other corporations.
In the study, we cooperate with several experts to build expert judgment. The experts are professionals in accounting, finance, engineering, operations, and marketing. The goal is to access and evaluate accounting, finance, and taxes. Expert in engineering and technique to give a perspective on how to measure production, operation, and maintenance as well. While an expert in marketing to be utilized to explore activities in marketing for example how important cash factor in the treasury department.
Based on the findings on the annual reports -then by utilizing the technique of descriptive analysis-, a sort of arguments have been developed to build an applied model. Therefore in this research, the methodologies that have been taken are mixed studies combining explorative, descriptive, evaluation, expert judgment, and exploratory. Figure 3 helps to understand the methods taken in this study.

Figure 3 METHODOLOGY TAKEN AND DEVELOPED
This study chooses a period of study in a couple of consecutive years from 2018 to 2019. These are probably not comprehensive in the study, but this is in the practical case and empirical is relevant. We put this short period as a limitation study as difficult to explore longer data.
Start from the annual report, data on employee benefits were taken, collected, and assessed. Several tables, charts were presented, built, and developed to help to understand the figures to get certain bonuses paid and from the end, it begins to develop the best formulation.
Results and Discussion
Designing the best formulation of quarterly-annually bonuses for employees must be considering a business growth perspective. When the corporations are proven to achieve a certain growth compared to a certain time of last year as stipulated by contractual in the Key Performance Indicator (KPI); therefore employees have the right to claim their bonuses. But vice versa, if the growth failed to be achieved or even worsen losses; employees must also understand the situation to claim its bonuses proportionally.
In terms of cement industries, the determinant factors of bonuses that relevant to be considered are the following included in Table 3.
| Table 3 | ||
|---|---|---|
| DETERMINANT FACTORS OF BONUSES | ||
| No | Factors | Weighted Factor (%) |
| 1 | EBITDA (Rp) | 30 |
| 2 | COGS (Rp/T) | 25 |
| 3 | Production (Ton cement annually) | 20 |
| 4 | Revenue (Rp) | 15 |
| 5 | Cash results of sales (Rp) | 10 |
Table 3 was built based on several works of literature previously developed by MacDiarmid et al., (2018); Delen et al., (2013); Zhao (2020); Subiyanto (2020a); Selmi & Chaney (2018); Chen et al., (2020), and Schreiber et al., (2020). These findings tabled in Table 3 are acknowledged as the KPI in general industries, as the main indicators to value manufacture are well treated or the opposite.
Based on expert judgments clarify by FGD the indicators to contribute excellence of the corporate performance is respectively coming from EBITDA (30%), the efficiency of COGS (25%), production (20%), revenue (15%), and cash resulted from sales (10%). It means the bigger EBITDA is a bigger opportunity to make improve the performance of the whole companies, either of production, revenue, or cash. But otherwise, for the COGS, the negative polarity must be seen on the contrary. Due to the COGS is the costs; the smallest costs the better for companies and vice versa.
Further, it is now how to split fairly enough weighted factor of every factor determined between the Operating Companies (Opco) and the Holdings. Following Table 4 is resulted based on the expert judgment that bigger portions percentage has been granted to Opco meaning bigger amounts bonuses primarily designed for production channels as the strategic tools for the Corporations. The Holdings, otherwise obtained smaller, meant the headquarters is not a production channel but producing policies and regulations. But by Table 4 implies, the Holdings is concerning for the revenue (consolidation), and therefore bigger portions of 70% are entitled to Holdings. This is the sole factor that giving major parts for Holdings, as the other four are all benefitting for the Opco.
| Table 4 | |||
|---|---|---|---|
| WEIGHTED EVERY FACTOR TO OPCO AND HOLDINGS | |||
| No | Determinants | Weighted Factor (%) | |
| OPCO | HOLDINGS | ||
| 1 | Production (Ton cement annually) | 70 | 30 |
| 2 | Revenue (Rp) | 30 | 70 |
| 3 | EBITDA (Rp) | 60 | 40 |
| 4 | Cash results of sales (Rp) | 70 | 30 |
| 5 | COGS (Rp/T) | 70 | 30 |
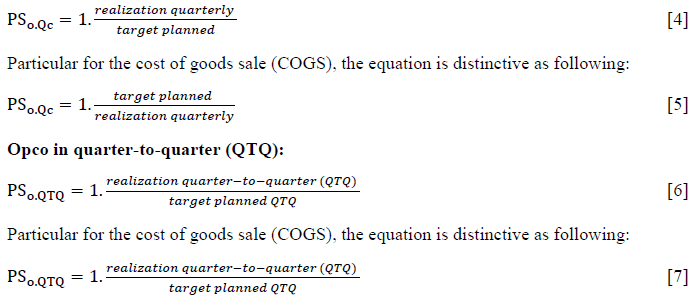
Quarterly Bonuses' Formulation
The background why quarterly is important to award employees due to the period is routinely evaluated in terms of quarter reports. The reports are also obligatory for every business entity to update performance at the stock exchange. The public requires a fundamental way to take options in trading. This is a substantial reason, why performance is a matter and important. Motivation employees by offering bonuses are crucial to maintaining quarter target.
To decide the value of bonuses for employees, it is mandatory required performance score (PS) or any terms that are similarly represented. Equation 1 presents:

Where:
• PS is a Performance Score for the company intended.
• PSQc is Performance Score's current quarter for the company intended.
• PSQTQ is Performance Score quarter-to-quarter compared to the same period last year for the company intended.
The rationale of equation 1 why a bigger portion of 60% is placed to the current quarter while smaller of 40% put in the past quarter-to-quarter (QTQ) due to driving spirit of employees to be more productive better than at time past. Performance at the past as learning to build better achievement at present and future. This is to reflect the spirit of business growth for the company and the holdings generally.
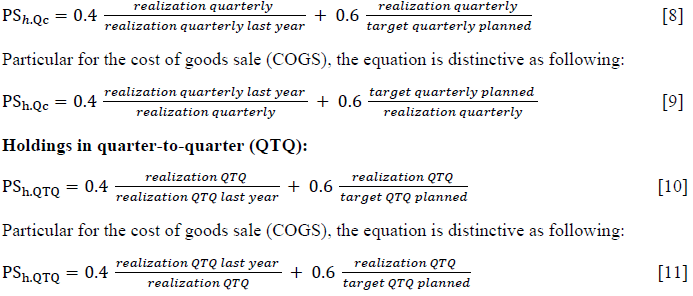
At the generally Holdings-type of industries, there will be a task to define PS for members of Holdings or for the Holdings (groups) itself. Each is divided into a recent quarterly basis and achievement to the quarter (quarter-to-quarter basis) or QTQ. Equation 2 and equation 3 are linked with Table 4.

Where:
• PSQc is Performance Score's current quarter for the company intended.
• PSQTQ is Performance Score quarter-to-quarter compared to the same period last year for the company intended.
• PSo, Qc is Performance Score's current quarter for the company intended (Opco).
• PSh, Qc is Performance Score current quarter for the Holdings.
• PSo, QTQ is Performance Score quarter-to-quarter compared to the same period last year for the company intended (Opco).
• PSh, QTQ is Performance Score quarter-to-quarter compared to the same period last year for the Holdings
The equation for opco as following:
Opco recent quarterly:
The equation for holdings as following:
Holdings recent quarterly:
After all, achievement had been key-in in the formulation then final PS had been obtained. These result then compromises with the following Table 5 to get the fair amount of bonuses designed. Table 5 is for sure must be agreed upon between both parties of the Union and the Management in the previous year. The value can vary according to mutual understanding but must be sportively created and fair based on best practices, empirical, or other considerations relevantly.
| Table 5 | |
|---|---|
| AMOUNT BONUSES GRANTED TO EMPLOYEES | |
| Performance Score | Bonuses (time monthly salary) |
| PS < 90% | 0 |
| 90% ≤ PS ≤ 95% | 0.5 |
| 95% ≤ PS ≤ 100% | 0.75 |
| 100% ≤ PS ≤ 105% | 1 |
| 105% ≤ PS ≤ 110% | 1.25 |
| PS ≥ 110≤% | 1.5 |
Annually Bonuses' Formulation
Behind arguments why offering annual bonuses is important due to keeping the growth of the business. The period of quarterly to maintaining performance while the period annually to guarantee the business’ growth. Growth is important to make sustainable the business, increasing endurance and appetite to compete in the open market. As a fundamental to survive in the hyper-competition.
Developing an annual formulation is not difficult this should be identical to a quarterly model. The difference is the recent quarter to be changed with this recent year and the other is year-on-year (YOY) instead of quarter-to-quarter (QTQ). The practice things, the achievement of this year be measured and then based-on yoy that considered last year's achievement.
The basic formula is the following:

Where:
• PS is a Performance Score for the company intended.
• PSYc is Performance Score's current year for the company intended.
• PSYTY is Performance Score year-to-year compared to the same period last year for the company intended.
The rationale of equation 12 why a bigger portion of 60% placed to the current year while smaller of 40% put at the past year-to-year (YTY) due to the driving spirit of employees to be more productive better than at time past. Performance at the past as learning to build better achievement at present and future. This is to reflect the spirit of business growth for the company and the holdings generally.
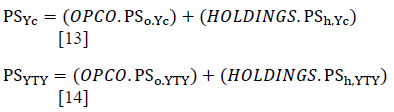
At the generally Holdings-type of industries, there will be a task to define PS for members of Holdings or for the Holdings (groups) itself. Each is divided into a recent yearly basis and achievement to the year-to-year basis or YTY. Equation 13 and equation 14 as follows:
Where:
• PSYc is Performance Score's current year for the company intended.
• PSYTY is Performance Score year-to-year compared to the same period last year for the company intended.
• PSo, Yc is Performance Score's current year for the company intended (Opco).
• PSh, Yc is Performance Score current year for the Holdings.
• PSo, YTY is Performance Score year-to-year compared to the same period last year for the company intended (Opco).
• PSh, YTY is Performance Score year-to-year compared to the same period last year for the Holdings
The equation for opco as following:
Opco recent quarterly:
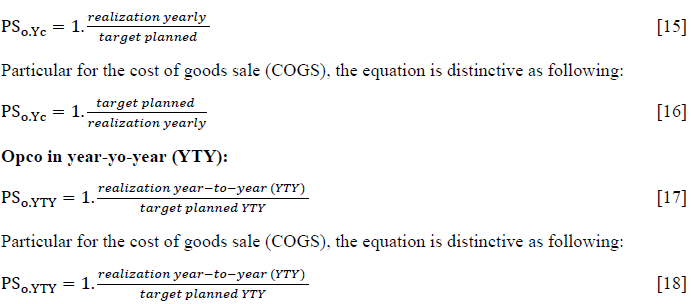
The equation for holdings as following:
Holdings recent year:
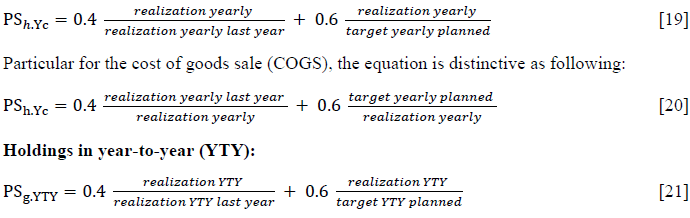
Particular for the cost of goods sale (COGS), the equation is distinctive as following:

The formulation is developed to maintain performance both for Opco and for the Holdings. Bonus in quarterly to maintain targets in quarterly, while annual bonus to maintain targets and growth. Eliminating one of them, for instance, abolishing quarterly bonuses will let performance endanger without employees' participation to oversee altogether in the period of quarterly. The company only relies on improving performance at the end of the year and this will be too late. Likewise, if the company eliminating the annual bonus, the consequence will be endangering the growth of the company. No employees will get in touch to concern the growth and therefore the company will be difficult to compete. The important thing, employees' contractual is predominantly important; giving them the challenge is the best to get welfare on both sides. Better for the BODs and BOCs, and better also for employees.
Conclusion
Bonuses for employees are rights, to make equal rights to the BODs and BOCs as both of them have claimed their tantiem regularly and annually. The bonuses are a form of respecting employees' participation in the growth of businesses, made the corporations stronger and survive during hyper-competition. Bonuses are also a form of appreciation to employees, a caress from leaders to staff and ordinates (Soleas, 2020; Subiyanto, 2020), to bind psychologically relationship tougher and stronger between the parties.
The determinant factors to build fairness bonuses formulation for the cement companies have consecutively resulted from EBITDA, revenue, total volume production, cash, and the COGS. All first four are coherently relationship while COGS as the variable of costs is inverse relation. It means the bigger coherent factors are better, and in contrast, the smallest inverse factor made performance score (PS) better.
Bonuses are typically costs, a burden for management, but on the other side, this is someone else right to be met without an exception. The management will be disregarded when the rights are being postponed to be given, in contrast, if the rights had been given in due time, appreciation will be awarded to the management.
The Union, representing an organization representing employees, should be viewed as a partner for the management. Many views especially from the management, the existence of Unions are being perceived as obstacles and hurdles for the company, as results of the industrial relations between both parties are increasing tensions and disputes. These are not according to the goal of the existence of the Union as stipulated by laws worldwide.
The function of the Union in this context is to simulating the appropriateness of results given by the formula. This is still in investigating how to measure the best, moderate, or the bad performance in industries. In Indonesia, generally to claim the good performance if the PS reached to 0.75 to 1, but it is probably different in other countries as the good company might only at least PS’ score of 0.75.
In this case, the Union is an effective way to do a pre-test or pre-check the results given by bonuses’ formulation. Further, the management and the Union can cooperate to do several tests to seek the best configuration to get ideal results. It might the standards are too low but on the other hand, are too high to be achieved. The coordination and communications are in the case are highly expecting for both parties to build better industrial relations.
Important to be noted that production, market, revenue, competitions, and other factors are always dynamically changed swiftly. Both parties of the Union and the Management must put understanding as prior attention without willing to be superior over others. The classic theories of principal-agent that strongly distorted must be avoided. At this opportunity, respect for each other is more important to build future cooperation better in the industrial relationship.
Limitation
This study is primarily targeted to be applied to the cement sectors in Indonesia. However, with the recent development amid the higher tension to have equal rights between the BODs and BOCs and the employees, the formula can be elaborated for possibility implementation to other industries with adequate adjustments.
The industries relatively closer to the cement industries as such the coal industries, fertilizers, steel factories, mining and gold sectors, smelters, and any other natural processing plants could apply the formulation directly. The State-owned holdings typically recently developed in Indonesia during 2020 to 2021 are also fit applying the formulation resulted in this study.
This study also limited with the period data might consider as too short. For further study, better research should be established in longer periods.
However, the final formulation proposed; still requires further deepen evaluation when implemented and could allow being modified to get the best final formulation. This is an open opportunity for researchers to develop a better formulation and having higher fairness viewed by the management and employees as well.
References
- Acemoglu, D., & Pischke, J. (1999). The structure of wages and investment in general training. Journal of Political Economy,107(03), 539-572.
- Baghai, R.P., Silva, R., Thell, V., & Vig, V. (2020). Talent in distressed firms: Investigating the labor costs of financial distress. Stockholm: Centre for Economic Policy Research (CEPR).
- Ballafkih, H., Zinsmeister, J., & Meerman, M. (2017). A job and a sufficient income is not enough: The needs of the Dutch Precariat. Journal of Workplace Rights, 7(4).
- Bartling, B., & Siemens, F.A. (2011). Wage inequality and team production: An experimental analysis. Journal of Economic Psychology, 32(1), 1-16.
- Blumkin, T., Pinhas, H., & Zultan, R. (2020). Wage subsidies and fair wages. European Economic Review, 127. Braunerhjelm, P., & Thulin, P. (2009). Agglomeration, relative wage costs and foreign direct investment - evidence from Swedish MNCs 1974–1998. Journal of Industry, Competition and Trade, 9(3). 197-217.
- Chen, H., Yang, D., Zhang, J., & Zhou, H. (2020). Internal controls, risk management, and cash holdings. Journal of Corporate Finance, 64.
- Delahaie, N., & Duhautois, R. (2019). Profit-sharing and wages: An empirical analysis using French data between 2000 and 2007. British Journal of Industrial Relations, 57(1), 107-142.
- Delen, D., Kuzey, C., & Uyar, A. (2013). Measuring firm performance using financial ratios: A decision tree approach. Expert Systems with Applications, 40(10), 3970-3983.
- Edo, A., & Rapoport, H. (2019). Minimum wages and the labor market effects of immigration. Labour Economics, 61.
- Ford, M., & Gillan, M. (2017). In search of a living wage in Southeast Asia. Employee Relations, 39(6), 903- 914.
- Han, T.S., & Shen, C.H. (2007). The effects of bonus systems on firm performance in Taiwan's high-tech sector.
- Journal of Comparative Economics, 35(1), 235-249.
- Hara, H. (2017). Minimum wage effects on firm-provided and worker-initiated training. Labour Economics, 47, 149-162.
- Hirsch, D. (2017). Contemporary UK wage floors and the calculation of a living wage. Employee Relations, 39(6) 815-824.
- Kafabih, F., & Budiyanto, U. (2020). Determination of annual employee salary increase and best employee reward using the fuzzy-TOPSIS Method. 2020 8th International Conference on Information and Communication Technology
- Ketkaew, C., Wouwe, M.V., Vichitthamaros, P., & Teerawanviwat, D. (2019). The effect of expected income on wealth accumulation and retirement contribution of Thai wageworkers. Sage Open, 9(4).
- Lee, H. W., & Lin, M.C. (2014). A study of salary satisfaction and job enthusiasm – mediating effects of psychological contract. Applied Financial Economics, 24(24), 1577-1583.
- Leontaris, G., Morales-Nápoles, O., Dewan, A., & Wolfert, A.R.M. (2019). Decision support for offshore asset construction using expert judgments for supply disruptions risk. Automation in Construction, 107.
- Li, F. (2008). Annual report readability, current earnings, and earnings persistence. Journal of Accounting and Economics, 45(2-3), 221-247.
- Linnemann, P. (2011). Bonus, salary increases and real value of pensions. Scandinavian Actuarial Journal, 1994(3), 99-118.
- Lombardi, S., Skans, O.N., & Vikstrom, J. (2018). Targeted wage subsidies and firm performance. Labour Economics, 53, 33-45.
- MacDiarmid, J., Tholana, T., & Musingwini, C. (2018). Analysis of key value drivers for major mining companies for the period 2006–2015. Resources Policy, 56, 16-30.
- McLaren, J. (2017). Globalization and Labor Market Dynamics. Annual Review of Economics, 9, 177-200. MSW, M.T. (2008). The Social Worker as Worker: A Union Perspective. Administration in Social Work, 3(3), 289-300.
- Ng, & H., I.Y. (2010). What if social workers were paid more? Administration in Social Work, 34(4), 351-360. Ng, I.Y.H., & Sim, H. (2012). Funding and remuneration in social services: Lessons from Singapore.
- Administration in Social Work, 36(3), 280-301.
- Ong, S.E., & Chew, T.I. (1996). Singapore residential market; An expert judgemental forecast incorporating the analytical hierarchy process. Journal of Property Valuation & Investment, 14(1), 50-66.
- Raschshepko, Y. (2016). Creativity of company and creativity of manager: How to measure them? Proceedings of the 4th International Conference on Management (pp. pp. 516-519). Saint-Petersburg, Russian Federation: Academic Conferences Limited.
- Schreiber, M., Schutte, C., Braunreuther, S., & Reinhart, G. (2020). A performance measurement system for integrated production and maintenance planning. Procedia CIRP, 93, 1037-1042.
- Selmi, N., & Chaney, D. (2018). A measure of revenue management orientation and its mediating role in the relationship between market orientation and performance. Journal of Business Research, 89, 99-109.
- Sheng, Y., Huang, Z., Liu, C., & Yang, Z. (2019). How does business strategy affect wage premium? Evidence from China. Economic Modelling, 83, 31-44.
- Soleas, E.K. (2020). Leader strategies for motivating innovation in individuals: a systematic review. Journal of Innovation and Entrepreneurship, 9(9).
- Subiyanto, E. (2020). Violating Labour’s Rights, A Failure Understanding Establishment of SOEs Holdings: Evidence at the State-owned Enterprise Cement Holding of PT Semen Indonesia (Persero) Tbk. Technium Social Sciences Journal, 7(1), 1-17.
- Subiyanto, E. (2020). A failure innovation strategy of acquisition strategy during excess capacity: Financial approach based-on case study at the state-owned cement holding PT Semen Indonesia (Persero) Tbk. Journal of Innovation and Entrepreneurship, 9(1), 20.
- Turco, A.L., & Parteka, A. (2011). The demand for skills and the labor cost in partner countries: Evidence from the enlarged EU. Economics of Transition, 19, 611-637.
- Voubem, L., Kramer, S., & Schaffer, U. (2020). Fairness perceptions of annual bonus payments: The effects of subjective performance measures and the achievement of bonus targets. Management Accounting Research, 30, 32-46.
- Walker, M. (2016). Hospitality in Jeopardy: Organizing Diverse Low-Wage Service Workers. Sage Open,6(3).
- Yano, G., Shiraishi, M., & Mahmut, X. (2010). What caused the ‘marginal-products-of-labour wage gap’ in state-owned enterprises in China during the early-reform era? A reconsideration based on a case study in Henan. Journal of Chinese Economic and Business Studies, 9(3), 217-238.
- Zhao, J. (2020). Accounting for the corporate cash increase. European Economic Review, 123.