Research Article: 2022 Vol: 26 Issue: 3
Evaluation of import substitution strategy in context to infrastructure: Empirical evidence from Rajasthan
Varun Chotia, Jaipuria Institute of Management
Vranda Jain, Jaipuria Institute of Management
Prabhat Pankaj, Jaipuria Institute of Management
Citation Information: Chotia V., Jain V., & Pankaj P. (2022). Evaluation of Import Substitution Strategy in Context To infrastructure: Empirical Evidence from Rajasthan. International Journal of Entrepreneurship, 26(3), 1-10.
Abstract
This study investigates the current state of infrastructure in Rajasthan and assesses its preparedness in implementing Import Substitution Industrialization (ISI). An Empirical framework based on Economic, Social and Physical infrastructure indices along with an overall infrastructure Index has been constructed, which would reflect the preparedness and therefore influence the decision to adopt Import Substitution strategy in Rajasthan. On this basis, 33 districts are ranked on the basis of highest to lowest values. Since infrastructure is a pre requisite for realizing benefits from ISI strategy and eventually moving towards a self-reliant economy, an assessment of the present situation can contribute in undertaking a well-planned move towards reducing reliance on imports.
Keywords
Import Substitution, Infrastructure, Principal Component Analysis
JEL Codes
E02, E61, E65, F15
Introduction
Amidst these turbulent times when the whole world is fighting against this COVID-19 pandemic, the honorable prime minister of India, Shri Narendra Modi has called for converting the present scenario to an opportunity by attaining self-reliance or becoming Aatmanirbhar and focus on the policy of Import Substitution. The basic premise behind promoting Import Substitution is to motivate domestic production by raising barriers against the import of foreign goods. Import Substitution is the usual recommendation given by economists when ‘Self- Sufficiency’ and ‘Self-Reliance’ are at the core of policy making with the ultimate aim of aiding and developing local industries.
The policy of Import Substitution aims to abolish the import of foreign products and encourages domestic market production. It stresses upon the philosophy to become vocal for our local products and make them global. The main purpose of this policy is to change the economic structure of our country by undergoing a transition from consumption of foreign goods to domestic goods. In most basic terms, the two forms of protection used by government are Tariffs and Quotas. From a domestic prospective, a tariff is a tax applied on imported goods which make the imported goods more expensive and therefore discourage their usage. Quotas refer to fixing the maximum limit on the imports of a commodity by a domestic producer. The limit is applied in terms of specifying the number of goods which can be imported.
With this inward-looking trade strategy of Import Substitution, the government aims to protect domestic industries from foreign competition because of various reasons as given below:
• The harsh reality is that Indian industries are not prepared to face competition from goods manufactured by developed countries. The basic premise of Import Substitution is that indigenous industries may stand up, after an initial period of support in the form of protectionism from imported articles entering the nation.
• In absence of any restrictions in the form of import tariffs and/or quotas, country’s foreign exchange may be spent on the import of luxury goods.
• Since Import Substitution fuels industrialization in the domestic economy, it can address the problem of unemployment as it promotes and helps in gaining higher pace, which eventually absorbs unemployed personnel.
• Further, as Import Substitution enables developing a strong industrial base, it indirectly contributes towards economic growth.
In this direction of moving towards Import Substitution, the initial steps were taken by the Government of India sometime back when they made their intention clear to form a National Procurement Policy where they mentioned that preference shall be given to domestic suppliers in purchases made by the Government. Under this policy, the government made the proposition of buying (even it is expensive) from domestic suppliers in order to promote local production. The boost in local production shall have resulting ‘multiplier’ effect in terms of job creation and more taxes paid in the country of manufacturing.
Considering this backdrop, this paper investigates the inter-connection between district level infrastructure and import substitution in one of the prominent North Indian states, Rajasthan. The paper is organized as follows. Section 2 reviews the relevant literature on trade, output growth, import substitution strategy and infrastructure as a pre-requisite of ISI strategy. The analytical framework and methodology of the study is presented in Section 3. Section 4 discusses the results of the study. Conclusion and policy implications are highlighted in Section 5.
Literature Review
Development economists have highlighted the Import Substitution Industrialization (ISI) strategy been pursued by many countries in their path of economic development (Baer, 1972; Galiani & Somaini, 2018; Orlenko, 2017). Ogujiuba et al. (2011) have defined ISI as a program for boosting industrialization via protecting domestic industries through the imposition of tariff and non-tariff barriers on imports entering the nation. Often viewed by developing countries to reduce their dependence on developed nations (Segal, 2019) and move towards achieving selfsufficiency, this strategy aims to realize industrial development, while curtailing import bills and preventing occurrence of currency depreciation in foreign exchange markets. Often, the most widely argument forwarded is protecting infant industries from foreign competition (Todaro, 1994) and support localized industries (Jackson, 2020). The benefits can accrue in form of creating new job opportunities, enhanced welfare opportunities, and improved domestic productivity (Saffa & Jabbie, 2020). Some studies have specifically evaluated the benefits of ISI strategy in context of developing economies (Diao et al., 2019; Shapiro & Taylor, 1990) and found an enhancement in resource efficiency and productivity, leading to economic diversification from agriculture to manufacturing leading to gainful employment of disguised labour in low value added primary sector (Irwin, 2002). This shift from consuming imported items towards indigenous production would boost industrialization and wealth (Linder, 1961), yield results from economies of scale (Meyer, 2004; Helpman & Krugman, 1985) and enable countries to work on their underdeveloped status in global context (Adams & Davis, 1994). However, there are contradicting thoughts on ISI. Another stream of economists contends that ISI strategy fosters production inefficiencies, hinders capital appropriation, encourages rent seeing behavior, works against the theory of comparative advantage and is therefore detrimental to economic growth (Bruton, 1970; Irwin, 2020; Krueger, 1975; Galiani & Somaini, 2018). Weiss (1988) observed that since this strategy focusses on internal demand, nations tend to reduce their focus on external demand in the form of exports.
Economists have analyzed the implications of ISI and found that countries have reaped benefits from following this strategy (Diao et al., 2019; Shapiro & Taylor, 1990). However, the pursuance of this strategy requires institutional reforms aimed at developing the entrepreneurial and administrative capability (Cherkesova et al., 2018). In this direction, the state has to extend certain privileges and benefits to localized industries which would enhance their competitiveness. Such protectionist measures, apart from tariff barriers, can be exercised in form of practicing various non-tariff barriers like quotas, embargoes, safety and health restrictions, etc. and extending technical, administrative and fiscal support to home grown industries. This would necessitate a robust infrastructure set up. In his study, Kwon (2009) analyzed the outcome of ISI on different regions and found that in the absence of well-established infrastructure coupled with other factors like poor administrative capacity and workforce led to impartial success of strategy.
With this background, the present study investigates the inter-alia between district level infrastructure and import substitution in one of the prominent North Indian states, Rajasthan, which is a hub of chemical, ceramic, agro, textiles, gems and jewellery, cement and marble industries. Since infrastructure is a pre requisite for realizing benefits from ISI strategy and eventually moving towards a self-reliant economy, an assessment of the present situation can contribute in undertaking a well-planned move towards reducing reliance on imports. With this intention, the study evaluates the existing state of economic, social and physical infrastructure, as measured by different indicators. The study also integrates these indicators to arrive at the overall infrastructure index for Rajasthan. The outcome of our study can be employed to generate revenue to the exchequer via export growth, reduce the burden of import bill and generate employment opportunities.
Data and Methodology
Mr. Narendra Modi, the honorable Prime Minister of India, addressed the nation on May 12, 2020 and announced the initiation of Aatma Nirbhar Bharat Abhiyaan (Self- Reliant India Movement). Under this movement, he defined five pillars laying the foundation of Aatmanirbhar Bharat. These comprise of the economy, infrastructure, system, demography and demand. Therefore, Infrastructure being one of the five pillars has to be focused upon especially when the aim for achieving Import Substitution and becoming self-reliant is at the forefront. In such a case, adequate Infrastructure facilities turn into a major pre-requisite for achieving the essential goals of Import Substitution and a Self-reliant economy. Improving the infrastructural services automatically becomes a key necessity for enhancing the productive efficacy of the process and for achieving Import Substitution.
These infrastructure services, often known as “Social Overhead Capital” are crucial in achieving Import Substitution. Oxford dictionary defined infrastructure as “the underlying foundation or basic framework” and can be categorized into “Economic Infrastructure” and “Social Infrastructure”. Economic Infrastructure includes all internal measures of infrastructure that make business activity possible and subsequently promote it. Since Economic Infrastructure is the key catalyst for ensuring business activity, hence it becomes all the more important to focus upon it, especially when we are looking at this aim of Import Substitution. The Economic infrastructure comprises of all those indicators which are productive in nature and help in improving the economy e.g., Agricultural production Energy, Telecommunication, Number of post offices etc. Social infrastructure typically includes social service sectors like Health, Education, and Housing etc. In this study, we have devised one separate category of infrastructure named Physical Infrastructure. This includes all those indicators which facilitate the transfer of goods, services and people from one geographical place to another.eg. Roads per sq.km of area, number of registered motor vehicles etc. All those indicators have been included under the physical infrastructure category which could not lie under economic and social infrastructure categories.
For assessing the present scenario as well as for the future prospects in terms of Import Substitution, we need to be aware of the districts within Rajasthan that are doing well on Infrastructure front, so that they can be further strengthened and the districts which are not so doing well so that they can be focused upon. In this direction, empirical analysis was carried out to come up with an index representing Infrastructural scenario for each of the 33 districts of Rajasthan.
There are two ways to estimate infrastructure. One, from the perspective of incurring investment for a particular service and second, from the perspective of available physical volume of services in term of its usage. For this analysis, we have used the below mentioned indicators of infrastructure classified under Economic, Social and Physical Category of Infrastructure.
Economic Infrastructure
• Crop wise Production in Tonne/hectares - Crops include Chilies, Ginger, Turmeric, Coriander, Cumin Seed and Ajwain
• Percentage of Gross Irrigated area (Out of Total area of district)
• Number of Bank branches per lakh of population : The list of banks here includes State Bank of India and its Associates, Nationalized Banks, Foreign Banks, Regional Rural Banks, Other Scheduled Commercial Banks
• Number of post offices per lakh of population
Social Infrastructure
• Literacy Rate - We have used the percentage values for 2011 (provisional).
• Government Medical Institutions (modern medicine) per lakh of population: The medical institutions here include Hospital, Dispensary, Community Health Centre, Mother and Child welfare Centre, Primary Health Centre, Aid Post Urban, Sub-health center.
• Number of scholars per educational institution: The Educational institutions include Pre-primary and Primary, Upper Primary (Middle), Secondary and Senior Secondary, Colleges.
• Number of Scholars per teacher
Physical Infrastructure
All those indicators which facilitate transfer of goods and services, which are physical in nature and finally which could not be classified under Economic and Social infrastructure criteria were included to construct this Physical Infrastructure category.
• Length of Roads per square km. of area: The type of roads includes Painted, Metalled and Gravelled roads.
• Number of census houses per square km. of area
• Number of Registered Motor Vehicles per lakh of population.
• Percentage of Villages connected with roads (Out of total villages per district)
The Required Data Was Collected From Various Files/Sources Such As
• Basic Statistics, Directorate of Economics & Statistics, Rajasthan, Jaipur
• Department of Agriculture and Cooperation, Ministry of Agriculture, Directorate of Economics & Statistics, Government of India
• Agriculture Statistics of Rajasthan, Directorate of Economics & Statistics, Rajasthan, Jaipur ,
• Statistical Abstract Rajasthan
• Census data Rajasthan etc.
We have used all the above mentioned indicators pertaining to Economic, Social and Physical Infrastructure in order to construct the Composite/Overall Infrastructure index. For constructing the index, firstly all the indicators need to be normalized before the Principal Component Analysis (PCA) was applied to decide the factor loadings and their respective weights.
For normalization, the following formula was employed:
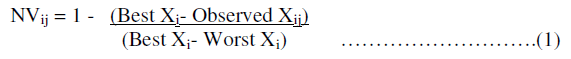
Where  Normalized value corresponding to the Xth indicator where i =
corresponding state and j = corresponding indicator.
Normalized value corresponding to the Xth indicator where i =
corresponding state and j = corresponding indicator.
Best Xi = Best/Maximum value of Xth indicator, where i= number corresponding to the state (In this case values of 21 states under the Xth indicator will become the i series)
Observed Xij= Observed/current value of Xth indicator where i = corresponding state and j = corresponding indicator
Worst Xi=Worst/Lowest value of Xth indicator
The Best and the Worst values rely upon the nature of a particular indicator. For example if Literacy Rate is an indicator having a positive impact on Social Infrastructure, therefore for this case, highest value will be treated as the Best value and the lowest will be considered as the Worst value. However, if the indicator is a negative in nature (in this study there is no such indicator), the lowest value will be considered as the Best value with highest value as Worst value. Once the Normalized Values are obtained for all the indicators across the various districts of Rajasthan, in the next step Factor Loadings and Weights are assigned. Principal Component Analysis (PCA) is used to compute the Factor Loading and Weights of these indicators using following formula:
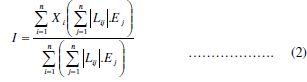
Where “I” is the Index for a particular category, Xi is the ith indicator under a particular category. Lij is the factor loading value of the ith variable on the jth factor; Ej is the Eigen value of the jth factor.
In this analysis, all the above mentioned 12 indicators pertaining to Economic, Social and Physical aspects of infrastructure services / facilities were used to construct firstly the respective individual indices i.e. Economic, Social and Physical and then by integrating the three to construct a Composite/Overall Infrastructure Index (Calculated as per the Principal Component methodology).
Empirical Results and Discussion
Applying the Principal component methodology, the Economic infrastructure index, Social Infrastructure index and Physical Infrastructure index values were calculated for all 33 districts of Rajasthan.
Economic Infrastructure
All the districts were ranked based on the highest to lowest values of Economic Infrastructure Index. Jaipur was the highest in terms of Economic Infrastructure followed by Ganganagar and Alwar.
| Table 1 Top Three Districts - Economic Infrastructure Index |
||
|---|---|---|
| Districts | Economic Infrastructure Index | Rank |
| Jaipur | 0.753 | 1 |
| Ganganagar | 0.678 | 2 |
| Alwar | 0.604 | 3 |
Top three Districts – Jaipur, Ganganagar, Alwar Bottom three Districts - Jalore, Sirohi, Barmer
On the Economic infrastructure front, Jaipur being the capital city obviously scores the highest. Ganganagar shows impressive results due to its agricultural and fertile land. The fraction of irrigation happening in this district is enormous and it amounts to the fact that Ganganagar possesses one of the most fertile lands of Rajasthan. Ganganagar scores well on other production indicators like number of bank branches and post offices too as it is a big district with population on the higher side and ultimately demand is high. Alwar comes out at the third spot because of having the presence of industrial cities like Bhiwadi which contribute to its business activities. Barmer has the lowest score on economic infrastructure and it is pretty understandable keeping in view of its arid land and hot climatic conditions which are not at all suitable for agricultural and other business purposes.
Social Infrastructure
Again, the districts were ranked based on the highest to lowest values of Social Infrastructure Index. Jaipur was the leading district on measure of Social Infrastructure followed by Sikar and Jhunjhunu.
| Table 2 Top Three Districts - Social Infrastructure Index |
||
|---|---|---|
| Districts | Social Infrastructure Index | Rank |
| Jaipur | 0.661 | 1 |
| Sikar | 0.647 | 2 |
| Kota | 0.637 | 3 |
Top three districts: Jaipur, Sikar, Kota Bottom three districts: Jalore, Dholpur, Sirohi
Analyzing the regional disparities between the districts in terms of Social infrastructure, Jaipur came out at the highest spot followed by Sikar district while on the bottom side, Sirohi was the weakest. Jaipur being the capital city is the education hub for all the students of Rajasthan. On health aspect also, Jaipur has the top most healthcare facilities and hospitals which enable it to be the best ranked district on Social Infrastructure terms. Sikar comes at the second spot. High literacy rate and the emergence of Sikar as an educational hub are main reasons behind Sikar’s strong social infrastructure. There is a good proportion of youth in the district which is the main catalyst behind this need for education. On the health front also, Sikar has been on the uptrend with medical institutions equipped with high end technology coming up in the district. The appearance of Kota at third spot is also well understood considering the fact that it is the most preferred location for all students coming to coaching city- Kota for preparing for entrance exams like JEE and NEET.
Physical Infrastructure
In terms of indicators pertaining to Physical Infrastructure, Jaipur was the leading district followed by Alwar and Ganganagar.
| Table 3 Top Three Districts - Physical Infrastructure Index |
||
|---|---|---|
| Districts | Physical Infrastructure Index | Rank |
| Jaipur | 0.848 | 1 |
| Alwar | 0.727 | 2 |
| Ganganagar | 0.701 | 3 |
Top three districts: Jaipur, Alwar, Ganganagar Bottom three districts: Barmer, Hanumangarh, Jaisalmer
When it comes to Physical infrastructure where indicators like Roads per sq. km of area, Number of census houses per sq. km, percentage of villages connected with roads etc., Jaipur holds the edge over the other districts of Rajasthan. Being the capital of the state, it is understood that roads will be of supreme quality along with their high connectivity to nearby villages. The road density will be obviously high setting the benchmark for the state as it is the capital. On the other hand, Jaisalmer lies at the bottom on these measures. A major proportion of the area of the district is covered with deserts and being on the Indo-Pak border also makes it one of the less developed districts of Rajasthan.
Overall Infrastructure Index (OII)
After classifying all the districts in terms of Economic, Social and Physical Infrastructure; an Overall infrastructure index (OII) was constructed using the three previously calculated indices. Consequently, the districts were again classified based on the overall infrastructure levels. When an overall measure of Infrastructure was constructed, Jaipur was seen as the leader among all the districts of Rajasthan followed by Ganganagar and Alwar.
| Table 4 Top Three Districts - Overall Infrastructure Index |
||
|---|---|---|
| Districts | Overall Infrastructure Index | Rank |
| Jaipur | 0.808 | 1 |
| Ganganagar | 0.779 | 2 |
| Alwar | 0.727 | 3 |
Top three districts – Jaipur, Ganganagar, Alwar Bottom three districts- Jhalawar, Jalore, Barmer
Overall when we construct the Infrastructure index (IFI), it is observed that Jaipur is leading district among Rajasthan while Barmer is at the bottom. Jaipur is the most consistent district on all three parameters of Economic, Social and Physical Infrastructure. Being the capital city of the state, Jaipur scores well on all three grounds from the business activity, health and Physical perspectives respectively. Ganganagar is at the second spot mostly owing to its strong agricultural base and fertile land. Alwar comes out at the third spot where the major industrial hub of Bhiwadi is majorly attributing to Alwar’s development in terms of having a strong infrastructure base.
Conclusions and Policy Recommendations
By drawing upon the Import substitution strategy and assessing the current level of infrastructure development as measured by the Infrastructure Index, this study examined the possibility of Import substitution across industries like ceramics, cement, chemical, marble, textiles and gems and Jewelry in a prosperous state of northern India- Rajasthan. As discussed earlier, adequate infrastructure is a necessity to capacitate the industrial base and reap benefits from protectionist measures aimed to promote localized industries. On these lines, the findings of our study suggest that the state government of Rajasthan can strengthen the developed districts of Jaipur, Ganganagar and Alwar which have emerged at the top three ranks on the IFI respectively. Similarly, our study suggests that with prominent industrial houses located in the districts of Jhalawar, Jalore and Barmer, investment in infrastructure is bound to yield favorable results from implementation of ISI strategy in these bottom three districts of Rajasthan.
This study assesses the benefits of home grown ISI strategy for Rajasthan for improving its trade balances, employment and economic growth. The findings of our study suggest that infrastructure development at district level would generate more employment opportunities at the local level. Extant studies have analyzed the theoretical and empirical relationship between unemployment and poverty and found poverty levels going down with increase in employment rate (Meo et al., 2018). Thus it is expected that infrastructure development would lead to an increase in work force participation at the state level, thereby contributing in an improvement in people’s situation of abject poverty, standard of living and overall well-being. An improvement in Rajasthan’s infrastructure can be utilized both as an opportunity and a sideline attempt to uplift the poor from one level to another. This can also enhance people’s acceptance and participation in economic and social processes of the state. Thus, although in recent decades, state government of Rajasthan has taken steps towards strengthening its infrastructure, the road to further improvisation is still long, particularly in context of requirements raised by ISI strategy. The study advocates the strong linkage between boosting infrastructure development levels, betterment of prospects from ISI strategy and a rise in Rajasthan’s state domestic product.
The study offers few important policy implications. The prudent execution of ISI strategy calls for an active state support. At the prima facie, state government will have to underlay well thought and planned import substitution measures. This would involve weighing the costs and benefits of different tariff and non-tariff barriers. A tailored, transparent approach towards incentivizing indigenous industries with tax holidays, subsidies and through other means should be carried out after analyzing the economic merits of these industries. State government will also have play a vital role in promoting localized products and encouraging people to go ‘VOCAL FOR LOCAL’. Further, the associated requirement of infrastructure base to match rising domestic production can be realized through active public private partnership (PPP). In context of developing nations, this has emerged as a successful partnership model as it addresses limitations pertaining to limited availability of resources and funds, imparts risk sharing and mitigation, increases resource efficiency and effectiveness and transmits accountability. Investments will also have to be channelized towards promoting research and development (R&D) and adopting state of the art technology which would contribute towards achieving selfreliance and further fuel economic growth. This can be a right step towards attaining selfreliance.
References
Adams, F.G., & Davis, I. (1994). The role of policy in economic development: comparisons of the East and Southeast Asian and Latin American experience.Asian‐Pacific Economic Literature,8(1), 8-26.
Indexed at, Google Scholar, Cross Ref
Baer, W. (1972). Import substitution and industrialization in Latin America: Experiences and interpretations.Latin American Research Review,7(1), 95-122.
Bruton, H.J. (1970). The import-substitution strategy of economic development: A survey.The Pakistan Development Review,10(2), 123-146.
Cherkesova, E.Y., Mironova, D.D., Slatvitskaya, I.I., & Popova, T.D. (2018). Sustainable import substitution in Russia: institutional conditions and efficiency imperatives.
Diao, X., McMillan, M., & Rodrik, D. (2019). The recent growth boom in developing economies: A structural-change perspective. InThe Palgrave Handbook of Development Economics,281-334. Palgrave Macmillan, Cham.
Indexed at, Google Scholar, Cross Ref
Galiani, S., & Somaini, P. (2018). Path-dependent import-substitution policies: the case of Argentina in the twentieth century.Latin American Economic Review,27(1), 5.
Indexed at, Google Scholar, Cross Ref
Helpman, E., & Krugman, P. (1987).Market structure and foreign trade: Increasing returns, imperfect competition, and the international economy. MIT press.
Irwin, D.A. (2002).Did Import Substitution Promote Growth in the Late Nineteenth Century?(No w8751). National Bureau of Economic Research.
Irwin, D.A. (2020). The rise and fall of import substitution.World Development,139, 105306.
Indexed at, Google Scholar, Cross Ref
JACKSON, E., Tamuke, E., Ngombu, A., & JABBIE, M. (2020). Adoption of Inflation Targeting in Sierra Leone: An Empirical Discourse.Journal of Economic Policy Researches,7(2), 21-50.
Indexed at, Google Scholar, Cross Ref
Krueger, A.O. (1975). The Benefits and Costs of Import Substitution in India: A Microeconomic Study. Minneapolis: University of Minnesota Press.
Kwon, J. (2009).Import substitution at the regional level: application in the United States(Doctoral dissertation, Cornell University).
Linder, S.B. (1961).An essay on trade and transformation(pp. 82-109). Stockholm: Almqvist & Wiksell.
Meo, M.S., Khan, V.J., Ibrahim, T.O., Khan, S., Ali, S., & Noor, K. (2018). Asymmetric impact of inflation and unemployment on poverty in Pakistan: new evidence from asymmetric ARDL cointegration.Asia Pacific Journal of Social Work and Development,28(4), 295-310.
Indexed at, Google Scholar, Cross Ref
Meyer, K.E. (2004). Perspectives on multinational enterprises in emerging economies.Journal of international business studies,35(4), 259-276.
Indexed at, Google Scholar, Cross Ref
Ogujiuba, K., Nwogwugwu, U., & Dike, E. (2011). Import substitution industrialization as learning process: Sub Saharan African experience as distortion of the “good” business model.Business and Management Review,1(6), 8-21.
Orlenko, L. (2017). Necessary conditions for new industrialization and import substitution.Problems of Economic Transition,59(1-3), 156-166.
Indexed at, Google Scholar, Cross Ref
Saffa, M., & Jabbie, M. (2020). Developing Transformational Competencies for Sustainable Development.Quality Education. Encyclopedia of the UN Sustainable Development Goals. Springer, Cham.
Segal, T. (2019). Import Substitution Industrialization.
Shapiro, H., & Taylor, L. (1990). The state and industrial strategy.World Development,18(6), 861-878.
Indexed at, Google Scholar, Cross Ref
Todaro, M.P. (1994). Economic Development (8th Edition). New York and London: Longman
Weiss, J. (1988) Industry in Developing Countries: Theory, Policy and Evidence. Routledge, London.
Received: 06-Feb-2022, Manuscript No. IJE-22-11207; Editor assigned: 07-Feb-2022, PreQC No. IJE-22-11207 (PQ); Reviewed: 21-Feb-2022, QC No. IJE-22-11207; Revised: 22-Feb-2022, Manuscript No. IJE-22-11207 (R); Published: 28-Feb-2022