Research Article: 2019 Vol: 23 Issue: 1
Features of Entrepreneurial Activities Indice in the world: Trends and Prospects
Andrei Plotnikov, Perm State Agro-Technological University
Yashar Salamzadeh, Universiti Sains Malaysia
Kursat Demiryurek, Ondokuz Mayis University
Hiroko Kawamorita, Ondokuz Mayis University
Anna Urasova, Perm State University
Abstract
This article analyses the influence of a number of factors on the entrepreneurial activities of the countries around the world. Accordingly, a number of criteria are proposed that allow structuring the data depending on the specific indicators measuring them, which are especially valuable on assessing entrepreneurship. Currently, there are a large number of statistical indicators reflecting entrepreneurial activities, which requires careful studies and analysis to make them more narrow and useable for policy making and entrepreneurial actions. Not only this situation makes the process of assessing the entrepreneurial activities more complicate, but also it can end to wrong decisions on national levels. Development of an evaluation system using methods for analysing big data, as well as specific calculations across different countries of the world, can provide key trends in the field of entrepreneurship. The quantitative data analysis for entrepreneurial activities of the countries around the world, offered by the authors, makes it possible to identify the reasons for such a wide variety of processes and factors, as well as to structure them. This research shows a clear vision about the entrepreneurship indices around the world and makes it possible to do the analysis on this issue using more relevant factors. Also a formula for predicting the trend in the next years is also provided in this research which is another tool for helping policy makers in this field.
Keywords
Entrepreneurial Activities, Business Activities, Intensity of Entrepreneurial Activities, Macro Level Entrepreneurial Activities, Entrepreneurial Potential.
Introduction
Nowadays, the urgency to research the entrepreneurial activities of all business entities has been a big trend. First of all, to identify the special role of entrepreneurship in accelerating the transition to of an innovative economy, to analyse the need for a wider use of entrepreneurship as one of the strategic resources of the Russian economic development. Secondly, to contribute to the completion of the conceptual framework formation for the theory of entrepreneurship.
Entrepreneurial activities in general, and each of its characteristics, is characterized by basic features: innovation and setting one’s own current goals based on the purpose of changing the market situation (pro-activity); initiative and sustainability in achieving the goal (effectiveness, as opposed to passive action); focusing on overcoming the internal and external barriers of environmental uncertainty in their market to achieve their goals. (transversality as opposed to adaptability); riskiness and ability to act in accordance with the existing and nonstandard economic situation (in contrast to reactivity as an answer to a previous market or intracompany situation) (Stasyuk, 2008).
Although there are lots of criteria in order to evaluate the entrepreneurial activities in a country level, but this diversity makes it more fuzzy as there are some different outputs for each of these factors in real world. Below some examples of these factors are presented.
Many researchers try to use the data prepared by Global Entrepreneurship Monitor to do analysis on country or a group of countries. Some researchers have done analysis on multi country level. For example, Wach and Krzysztof (2015) conducted a research on the countries of European Union according to GEM 2013 report or Alexandrova and Verkhovskaya (2015) studied this issue on Russia, again using GEM data. They evaluated various groups of factors affecting new businesses in Russia and finally mentioned that individuals' perception factors are the strongest tool in prediction of the individual's ability to show entrepreneurial initiatives in this case.
Hessels et al. (2008) also used the GEM 2005 report for evaluating some criteria including, motives for starting one's own business and the level of social security of a country on predominance of entrepreneurial aspirations in 29 countries around the world and finally they suggested these factors as most influencing factors on entrepreneurial intentions of citizens of these countries: country's focus on innovation, expectations of job growth and export orientation as indicators of entrepreneurial aspirations (Hessels et al., 2008)
Similar studies on different countries were done to evaluate some key global trends in the business environment of countries such as Wennekers et al. (2002) and Amorуs et al. (2013) or Bosma & Schutjens (2009).
Despite all these studies and development of too many different indices for evaluating entrepreneurial activities in different contexts, there is still a need for a more global and unique criteria to be used in global decision making. This gap was also mentioned by some other researchers indicating the need for sounder basis for internationally comparable indicators of entrepreneurship (Hoffmann, 2007)
In this regard this research goes a step further and after some analysis on GEM Reports, delivers a more simple choice on these criteria and proposes that use of two final indices can give a complete view on entrepreneurial activities around the world and decision makers can decide according to these ones.
Materials And Methods
The practical experience of international entrepreneurship accumulated during the transformation years has not yet received an appropriate theoretical generalization, which include its state regulation and stimulation of desired directions for the improved progress of the national economy. This is the main reason why the proposed research topic was chosen to be investigated. To be specific, this research aims to reveal trends in the development of entrepreneurial activities worldwide (N=140).
The following methods were used as a methodological basis for the study. Since it was not clear at the initial stage which system of factors allows us to describe the correlation matrix to reduce the dimensions of the parameters, we decided to use the exploratory factor analysis of the principal component methods, and varimax rotation of the factors to construct the scattering histogram. During the factor analysis, 25 factors are studied in a dynamics over three years. In addition, to investigate the relationship between the data of different years, we used a correlation analysis. In order to identify similar objects in the sample under study, cluster analysis was carried out using the closest similarity method to construct a dendrogram. Global Entrepreneurship and Development Institute is chosen as the research database.
There are lots of indices for evaluation of entrepreneurial activities. Here some of them are shortly presented.
Global Entrepreneurship Index (GEINDEX) that "captures the essence of the contextual features of entrepreneurship and fills a gap in the measure of development" (Zoltan and Szerb, 2009). The GEI measures both the quality of entrepreneurship in a country and the extent and depth of the supporting entrepreneurial ecosystem and has two different aspects namely a Rank and a Score.
Entrepreneurial attitude is defined as the general attitude of a country’s population toward recognizing opportunities, knowing entrepreneurs personally, attaching high status to entrepreneurs, accepting the risks associated with a business startup and having the skills to successfully launch businesses. Entrepreneurial attitudes are important because they express the population’s general feelings toward entrepreneurs and entrepreneurship (Reynolds, 2007; Schramm, 2008).
Opportunity perception index as an answer to this question: Are entrepreneurs motivated by opportunity rather than necessity and does governance make the choice to be an entrepreneur easy? (Uhlaner and Thurik, 2007)
These factors as well as some other factors are introduced by GEM as Global Entrepreneurship Development Index (GEDI, 2018). Here are some more main factors in this model according to three different dimension of the evaluation model:
1. Attitudes Dimension: Opportunity perception, Start-up skills, Risk Acceptance (Non-fear of failure), Networking and Cultural Support.
2. Activity Dimension: Opportunity start up, Technology Absorption, Human capital, Competition.
3. Aspiration Dimension: Product Innovation, Entrepreneurial Aspirations, High Growth, Internationalization and Risk Capital.
4. Below you can see our initial 22 factors for entrepreneurial activities evaluation according to GEM.
5. Database in Table 1.
| Table 1 Initial Main Factors In Evaluating Entrepreneurial Activities |
||
| Parameter name | Reference character | Parameter elements |
|---|---|---|
| Global Enterpreneurship Index,Rank | KN.N1 | The GEI measures both the quality of entrepreneurship in a country and the extent and depth of the supporting entrepreneurial ecosystem. |
| Global Enterpreneurship Index,Score | KN.N2 | The same as KN.N1. |
| Entrepreneurial Attitudes,Rank | KN.N4 | As stated earlier, entrepreneurial attitude is defined as the general attitude of a country’s population toward recognizing opportunities, knowing entrepreneurs personally, attaching high status to entrepreneurs, accepting the risks associated with a business startup, and having the skills to successfully launch businesses. Entrepreneurial attitudes are important because they express the population’s general feelings toward entrepreneurs and entrepreneurship. The benchmark individuals are those who can: (1) recognize valuable business opportunities, (2) have the necessary skills to exploit these opportunities, (3) attach high status to and respect entrepreneurs, (4) handle startup risk, and (5) know entrepreneurs personally (i.e., have a network or role models). Moreover, these people can provide the cultural support, financial resources, and networking potential to those who are already entrepreneurs or want to start a business. |
| Entrepreneurial Attitudes,Score | KN.N5 | The same as KN.N4. |
| Opportunity perception | KN.N6 | Are entrepreneurs motivated by opportunity rather than necessity and does governance make the choice to be an entrepreneur easy? |
| Start up skills | KN.N7 | Does the population have the skills necessary to start a business based on their own perceptions and the availability of tertiary education? |
| Risk Acceptance | KN.N8 | Are individuals willing to take the risk of starting a business? Is the environment relatively low risk or do unstable institutions add additional risk to starting a business? |
| Networking | KN.N9 | Do entrepreneurs know each other and how geographically concentrated are their networks? |
| Cultural Support | KN.N10 | How does the country view entrepreneurship? Is it easy to choose entrepreneurship or does corruption make entrepreneurship difficult relative to other career paths? |
| Entrepreneurial Abilities,Rank | KN.N12 | High entrepreneurial abilities are associated with startups in the medium- or high-technology sectors that are initiated by educated entrepreneurs and launched because of opportunity motivation in a not too competitive environment. Quality differences in startups are quantified by the motivation and education level of the entrepreneur, and by the uniqueness of the product or service, as measured by the level of competition. |
| Entrepreneurial Abilities,Score | KN.N13 | The same as KN.N12. |
| Oppurtunity startup | KN.N14 | Are entrepreneurs motivated by opportunity rather than necessity and does governance make the choice to be an entrepreneur easy? |
| Technology Absorption | KN.N15 | Is the technology sector large and can businesses rapidly absorb new technology? |
| Human capital | KN.N16 | Are entrepreneurs highly educated, well trained in business and able to move freely in the labor market? |
| Competition | KN.N17 | Are entrepreneurs creating unique products and services and able to enter the market with them? |
| Entrepreneurial Aspirations,Rank | KN.N19 | Entrepreneurial aspiration is the early-stage entrepreneur’s effort to introduce new products and/or services, develop new production processes, penetrate foreign markets, substantially increase the firm’s staff, and finance a business with formal and/or informal venture capital. In other words, the effort to start new companies that will generate wealth and can be scaled. Product and process innovation, internationalization, and high growth are considered characteristics of entrepreneurship. The benchmark entrepreneurs are those whose businesses: (1) produce and sell products/services considered to be new to at least some customers, (2) use a technology less than five years old, (3) have sales in foreign markets, (4) plan to employ at least ten people, and (5) have greater than 50 percent growth over the next five years. The Finance variable captures the informal venture capital potential, as well as the development of capital, venture capital, and credit markets, which is vital for innovative startups and high-growth firms |
| Entrepreneurial Aspirations,Score | KN.N20 | The same as KN.N19. |
| Product Innovation | KN.N21 | Is the country able to develop new products and integrate new technology? |
| Process Innovation | KN.N22 | Do businesses use new technology and are they able access high quality human capital in STEM fields? |
| High Growth | KN.N23 | Do businesses intend to grow and have the strategic capacity to achieve this growth? |
| Internationalization | KN.N24 | Do entrepreneurs want to enter global markets and is the economy complex enough to produce ideas that are valuable globally? |
| Risk Capital | KN.N25 | Is capital available from both individual and institutional investors? |
Results And Discussion
The factor analysis is carried out for the duration of three years (2016-2018). Based on the results of the analysis of factors for 2016, the following results are observed.
The factor structure of the 22 parameters is reduced to 5 factors identified according to the Kaiser criterion and the result is shown in Table 2.
| Таble 2 Factor Analysis Results |
|||||||||
| Component | Initial eigenvalues | Extraction of the sum of squares of loads | Rotation of the sum of squares of loads | ||||||
|---|---|---|---|---|---|---|---|---|---|
| Total | Dispersion % | Total % | Total | Dispersion % | Total % | Total | Dispersion % | Total % | |
| KN.N1 | 8.993 | 40.878 | 40.878 | 8.993 | 40.878 | 40.878 | 8.516 | 38.709 | 38.709 |
| KN.N2 | 4.384 | 19.929 | 60.807 | 4.384 | 19.929 | 60.807 | 4.583 | 20.83 | 59.539 |
| KN.N4 | 2.489 | 11.312 | 72.119 | 2.489 | 11.312 | 72.119 | 2.252 | 10.235 | 69.774 |
| KN.N5 | 1.91 | 8.684 | 80.802 | 1.91 | 8.684 | 80.802 | 1.948 | 8.856 | 78.631 |
| KN.N6 | 1.187 | 5.394 | 86.197 | 1.187 | 5.394 | 86.197 | 1.664 | 7.566 | 86.197 |
| KN.N7 | 0.906 | 4.119 | 90.316 | - | - | - | - | - | - |
| KN.N8 | 0.801 | 3.643 | 93.958 | - | - | - | - | - | - |
| KN.N9 | 0.563 | 2.559 | 96.517 | - | - | - | - | - | - |
| KN.N10 | 0.376 | 1.708 | 98.225 | - | - | - | - | - | - |
| KN.N12 | 0.22 | 0.998 | 99.223 | - | - | - | - | - | - |
| KN.N13 | 0.094 | 0.429 | 99.652 | - | - | - | - | - | - |
| KN.N14 | 0.043 | 0.197 | 99.85 | - | - | - | - | - | - |
| KN.N15 | 0.033 | 0.15 | 100 | - | - | - | - | - | - |
| KN.N16 | 8.01E-16 | 3.64E-15 | 100 | - | - | - | - | - | |
| KN.N17 | 3.17E-16 | 1.44E-15 | 100 | - | - | - | - | - | - |
| KN.N19 | 2.67E-16 | 1.21E-15 | 100 | - | - | - | - | - | - |
| KN.N20 | 7.51E-17 | 3.41E-16 | 100 | - | - | - | - | - | - |
| KN.N21 | -1.36E-16 | -6.18E-16 | 100 | - | - | - | - | - | - |
| KN.N22 | -3.07E-16 | -1.40E-15 | 100 | - | - | - | - | - | - |
| KN.N23 | -4.13E-16 | -1.88E-15 | 100 | - | - | - | - | - | - |
| KN.N24 | -6.99E-16 | -3.18E-15 | 100 | - | - | - | - | - | - |
| KN.N25 | -1.43E-15 | -6.48E-15 | 100 | - | - | - | - | - | - |
This factor structure explains 86.2% of the total variance of the data. In other words, 86.2% of the final results can be explained by selecting 5 factors, and the remaining 13.8% of the final results are explained by other factors that are difficult to isolate into groups.
According to the analysis of above table, five factors were identified, and the factor loads for them is presented in Table 3.
| Table 3 Factor Loads For 5 Parameters For 2016 |
|||||
| Component | Parameter | ||||
| 1 | 2 | 3 | 4 | 5 | |
| KN.N4 | -0.955 | -0.120 | 0.096 | 0.019 | 0.000 |
| KN.N5 | 0.948 | 0.169 | -0.143 | -0.016 | 0.039 |
| KN.N12 | 0.913 | 0.191 | 0.092 | 0.218 | -0.050 |
| KN.N1 | 0.896 | 0.429 | -0.055 | 0.017 | 0.062 |
| KN.N13 | -0.892 | -0.111 | -0.059 | -0.205 | 0.006 |
| KN.N2 | -0.889 | -0.299 | -0.050 | 0.037 | -0.251 |
| KN.N15 | 0.782 | -0.539 | 0.131 | 0.071 | 0.111 |
| KN.N6 | 0.739 | -0.113 | 0.326 | -0.406 | 0.114 |
| KN.N8 | 0.720 | -0.138 | -0.177 | 0.308 | 0.377 |
| KN.N7 | 0.654 | -0.137 | -0.530 | -0.214 | 0.135 |
| KN.N10 | 0.645 | 0.160 | 0.318 | 0.133 | -0.577 |
| KN.N14 | 0.600 | 0.526 | -0.049 | 0.154 | -0.098 |
| KN.N25 | 0.036 | 0.890 | 0.172 | 0.096 | -0.167 |
| KN.N19 | -0.290 | -0.883 | 0.010 | 0.218 | -0.133 |
| KN.N20 | 0.400 | 0.848 | -0.094 | -0.198 | 0.198 |
| KN.N16 | 0.050 | 0.727 | 0.131 | 0.015 | -0.364 |
| KN.N9 | 0.420 | -0.524 | 0.417 | -0.408 | 0.054 |
| KN.N24 | 0.093 | 0.147 | -0.921 | 0.152 | 0.014 |
| KN.N21 | 0.080 | 0.393 | 0.742 | -0.025 | 0.050 |
| KN.N17 | 0.295 | -0.019 | -0.027 | 0.897 | -0.124 |
| KN.N23 | -0.011 | 0.543 | 0.159 | -0.643 | -0.188 |
| KN.N22 | 0.272 | -0.095 | 0.108 | -0.023 | 0.889 |
The first factor accounts for 40.878% of the final results obtained in the study. It includes such scales as: KN.N4 (-0.955), KN.N5 (0.948), KN.N12 (0.913), KN.N1 (0.896), KN.N13 (- 0.892), KN.N2 (-0.889), KN.N15 (0.782), KN.N6 (0.739), KN.N8 (0.720), KN.N7 (0.654), KN.N10 (0.645), KN.N14 (0.600).
The second factor explains 19.929% of the final results obtained in the study. It includes such scales as: KN.N25 (0.890), KN.N19 (-0.883), KN.N20 (0.848), KN.N16 (0.727), KN.N9 (- 0.524).
The third factor explains 11.312% of the final results obtained in the study. It includes such scales as: KN.N24 (-0.921), KN.N21 (0.742). The fourth factor explains 8.684% of the final results obtained in the study. It includes such scales as: KN.N17 (0.897), KN.N23 (-0.643).
The fifth factor accounts for 5.394% of the final results obtained in the study. It includes such scales as: KN.N22 (0.889).
Considering the dynamics of the factor load from the above 5 parameters, we present the result in the Table 4, for years 2016 to 2018.
| Table 4 Dynamics Of Factor Load By 5 Factors For 2016-2018 |
|||
| Factor load % | |||
| Factor name | 2016 | 2017 | 2018 |
| 1 | 40.878% | 34.533% | 40.4% |
| 2 | 19.929% | 22.570% | 16.851% |
| 3 | 11.312% | 11.3548% | 12.490% |
| 4 | 8.684% | 9.344% | 9.047% |
| 5 | 5,394% | 5,114% | 5,624% |
As a result of the analysis, it is necessary to conclude that the influence of the first three factors is not stable. Note that the factor load for the first and second factors does not show system reduction, while the one for the third factor stably increases.
In order to conduct cluster analysis and construct a scattering histogram, the factor structure of the 22 parameters was reduced to 2 factors (Tables 5 A & B), isolated according to the Kaiser criterion. This factor structure explains 74.6% of the total variance of the data. In other words, 74.6% of the final results can be explained by identifying 2 factors, and the remaining 25.4% of the final results are explained by other factors that are difficult to isolate into groups.
| Table 5A Factor Structure Reduced To 2 Factors |
|||||
| Initial Eigen Values | Full Explained Dispersion | Sums of Squares of Loads of Extraction Data | |||
| Component | Total | Dispersion % | Cumulative % | Total | Dispersion % |
| 1 | 14.162 | 64.371 | 64.371 | 14.162 | 64.371 |
| 2 | 2.255 | 10.25 | 74.621 | 2.255 | 10.25 |
| 3 | 0.955 | 4.341 | 78.962 | - | - |
| 4 | 0.846 | 3.846 | 82.808 | - | - |
| 5 | 0.7 | 3.181 | 85.989 | - | - |
| 6 | 0.549 | 2.497 | 88.486 | - | - |
| 7 | 0.495 | 2.251 | 90.737 | - | - |
| 8 | 0.403 | 1.834 | 92.57 | - | - |
| 9 | 0.347 | 1.579 | 94.15 | - | - |
| 10 | 0.285 | 1.294 | 95.444 | - | - |
| 11 | 0.265 | 1.203 | 96.647 | - | - |
| 12 | 0.23 | 1.045 | 97.692 | - | - |
| 13 | 0.166 | 0.756 | 98.448 | - | - |
| 14 | 0.16 | 0.729 | 99.177 | - | - |
| 15 | 0.088 | 0.402 | 99.579 | - | - |
| 16 | 0.035 | 0.158 | 99.737 | - | - |
| 17 | 0.026 | 0.117 | 99.854 | - | - |
| 18 | 0.018 | 0.082 | 99.936 | - | - |
| 19 | 0.012 | 0.053 | 99.989 | - | - |
| 20 | 0.002 | 0.008 | 99.997 | - | - |
| 21 | 0.001 | 0.003 | 100 | - | - |
| 22 | 0 | 0 | 100 | - | - |
| Table 5B Factor Structure Reduced To 2 Factors |
||||
| Sums of rotation load squares | ||||
| Component | Cumulative % | Total | Dispersion % | Cumulative % |
| 1 | 64.371 | 9.715 | 44.161 | 44.161 |
| 2 | 74.621 | 6.701 | 30.461 | 74.621 |
| 3 | - | - | - | - |
| 4 | - | - | - | - |
| 5 | - | - | - | - |
| 6 | - | - | - | - |
| 7 | - | - | - | - |
| 8 | - | - | - | - |
| 9 | - | - | - | - |
| 10 | - | - | - | - |
| 11 | - | - | - | - |
| 12 | - | - | - | - |
| 13 | - | - | - | - |
| 14 | - | - | - | - |
| 15 | - | - | - | - |
| 16 | - | - | - | - |
| 17 | - | - | - | - |
| 18 | - | - | - | - |
| 19 | - | - | - | - |
| 20 | - | - | - | - |
| 21 | - | - | - | - |
According to the analysis of Table 5, two factors are identified; factor loads are presented in Table 6.
| Table 6 Factor Load By 2 Main Factors |
||
| The matrix of rotated components | Component | |
| 1 | 2 | |
| KN.N19 | -0.89 | -0.34 |
| KN.N20 | 0.88 | 0.40 |
| KN.N12 | -0.88 | -0.33 |
| KN.N13 | 0.85 | 0.42 |
| KN.N15 | 0.85 | -0.01 |
| KN.N25 | 0.82 | 0.26 |
| KN.N1 | 0.77 | 0.63 |
| KN.N24 | 0.75 | 0.29 |
| KN.N21 | 0.74 | 0.25 |
| KN.N2 | -0.74 | -0.64 |
| KN.N16 | 0.73 | 0.24 |
| KN.N23 | 0.68 | 0.22 |
| KN.N22 | 0.67 | 0.33 |
| KN.N6 | 0.60 | 0.56 |
| KN.N17 | 0.57 | 0.41 |
| KN.N4 | 0.42 | 0.90 |
| KN.N5 | -0.40 | -0.90 |
| KN.N9 | 0.31 | 0.78 |
| KN.N10 | 0.37 | 0.77 |
| KN.N14 | 0.04 | 0.75 |
| KN.N7 | 0.15 | 0.73 |
| KN.N8 | 0.55 | 0.69 |
The first factor accounts for 44.1% of the final results obtained in the study. It includes such scales as: KN.N19 (-0.89), KN.N20 (0.88), KN.N12 (-0.88), KN.N13 (0.85), KN.N15 (0.85), KN.N25 (0.82), KN.N1 (0.77), KN.N24 (0.75), KN.N21 (0.74), KN.N2 (-0.74), KN.N16 (0.73), KN.N23 (0.68), KN.N22 (0.67), KN.N6 (0.6), KN.N17 (0.57).
The second factor accounts for 30.4% of the final results obtained in the study. It includes such scales as: KN.N4 (0.9), KN.N5 (-0.9), KN.N9 (0.78), KN.N10 (0.77), KN.N14 (0.75), KN.N7 (0.73), KN.N8 (0.69).
The visual distribution of the scales is shown below in Figure 1. As can be seen, they are distributed at two opposite poles of the two-factor model, i.e. they are fundamentally different.
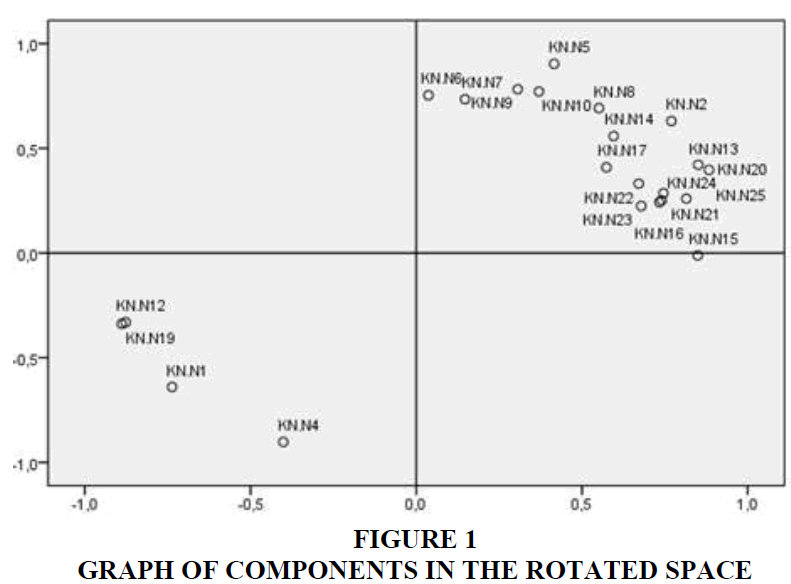
Figure 1: Graph Of Components In The Rotated Space
Then, based on these indicators, a scattering diagram is constructed and presented in Figure 2.
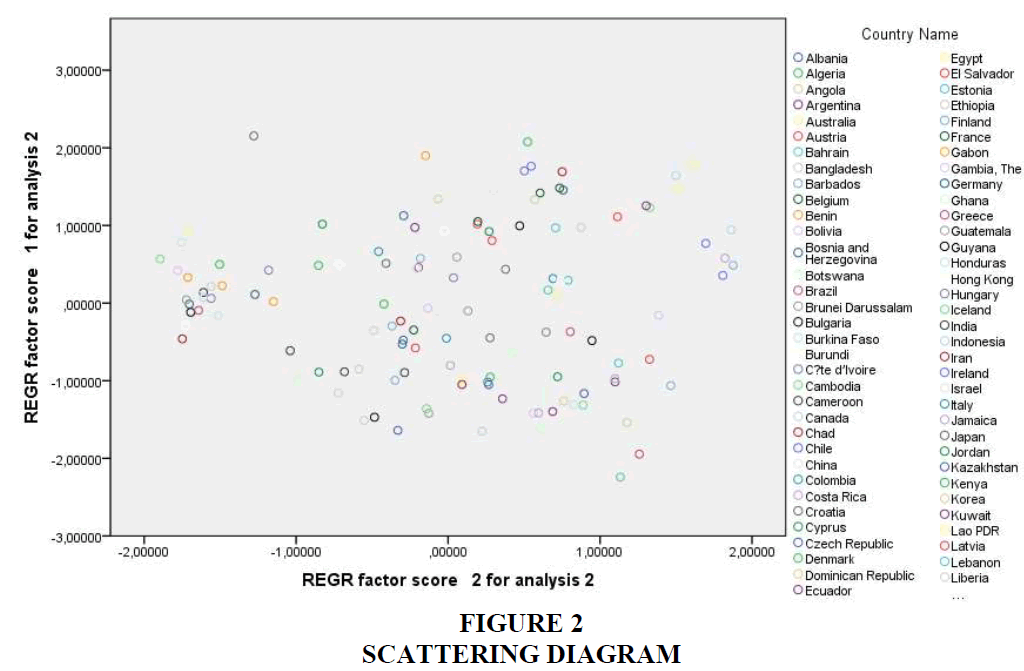
Figure 2: Scattering Diagram
On the basis of this diagram, it is not advisable to single out any clusters. Assuming that all countries can be divided into 4 clusters, the dendrogram can be represented as follows (Figure 3). So the first cluster includes almost all countries except Japan, Panama and Poland.
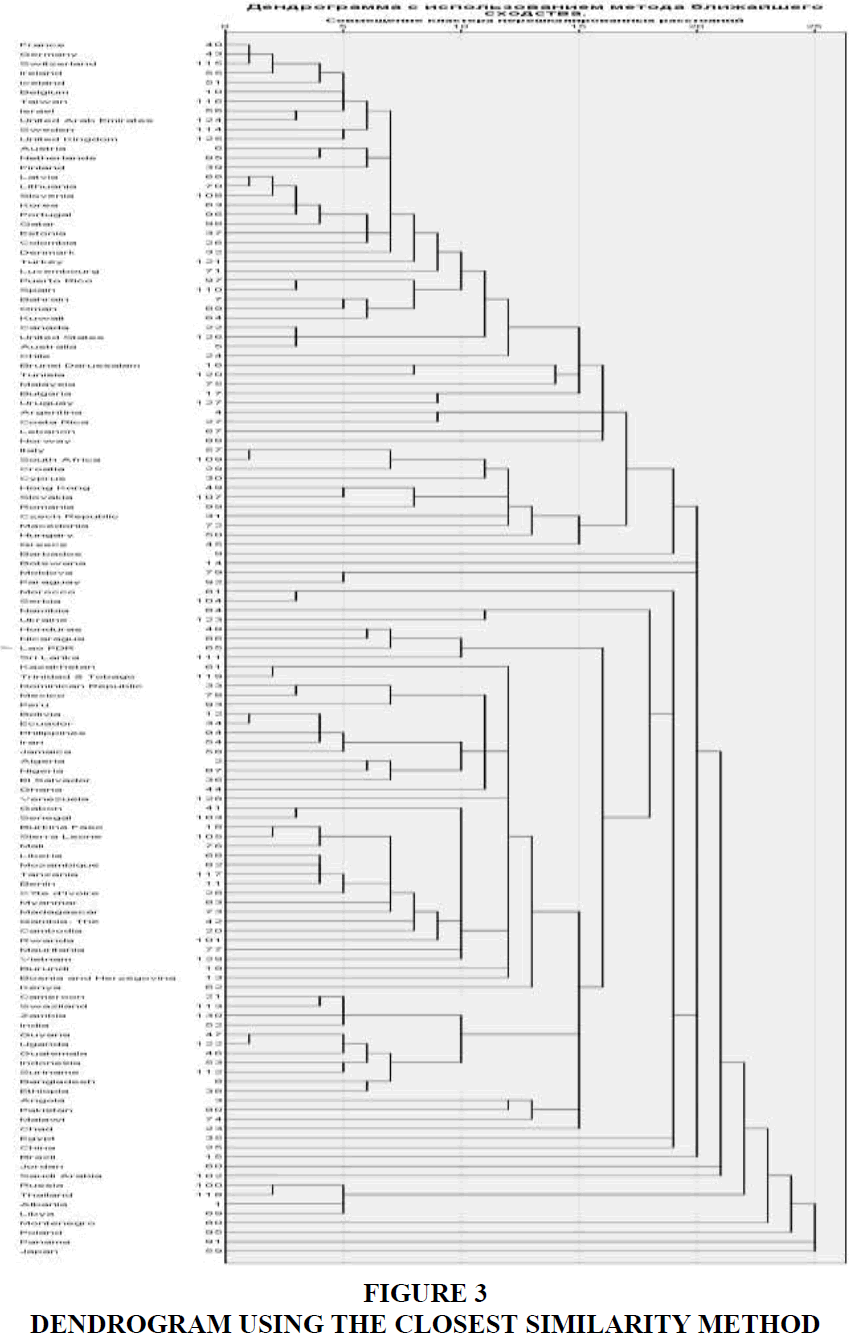
Figure 3: Dendrogram Using The Closest Similarity Method
Thus, all countries will fall into the first cluster except for (2-Japan, 3-Panama, 4-Poland). Therefore, based on the analysis of the dendrogram, it clearly shows that it is not possible to single out clear clusters of countries.
To study the relationship between the data of different years, a correlation analysis was carried out. The data is presented in the Table 7.
| TABLE 7 Empirical Values Of The Spearman Correlation Criterion |
|||
| Scale | 2016 | 2017 | 2018 |
| 2015 | 0.937*** | 0.916*** | 0.907*** |
| 2016 | 0.929*** | 0.907*** | |
| 2017 | 0.982*** | ||
Note: ***p<0.001.
Significant positive strong relationships between the values for 2016 parameter and the values for 2015 parameter is revealed (r=0.937, p ≤ 0.01). With the increase in the values for 2016 parameter, the values for 2015 parameter increase. Significant positive strong relationships between the values for 2017 parameter and those for 2015 parameter is revealed (r=0.916, p ≤ 0.01). With the increase in the values for 2017 parameter, the values for 2015 parameter increase. Significant positive strong relationships are found between the values for 2018 parameter and those for 2015 parameter (r=0.907, p ≤ 0.01). With the increase in the values for 2018 parameter, the values for 2015 parameter increase.
There are significant positive strong relationships between the values for 2017 parameter and the values for 2016 parameter (r=0.929, p ≤ 0.01). With the increase in the values for 2017 parameter, the values for 2016 parameter increase. There are significant positive strong relationships between the values for 2018 parameter and those for 2016 parameter (r=0.907, p ≤ 0.01). With the increase in the values for 2018 parameter, the values for 2016 parameter increase.
Significant positive strong relationships between the values for 2018 parameter and the values for 2017 parameter is revealed (r=0.982, p ≤ 0.01). The more distinct the values for 2018 parameter, the more distinct are those for 2017 parameter.
To predict the values of the Indicator from the available data by year, we use regression analysis.
Using SPSS 19 regression analysis is performed. As a result of the analysis, we have obtained tables with the total values of the model, the variance analysis, and the coefficients. Let us consider each table separately. In Table 8, the summary of the model is presented.
| Table 8 Summary for the model |
||||
| Model | Н | R-square | R-square corrected | Std. evaluation error |
| 1 | 0.451 | 0.203 | 0.202 | 6.756 |
Regression analysis revealed that the coefficient of multiple correlation (R) between “Indicator” parameter and “Year” parameter is 0.451. This is an evidence of the existence of an average strength relationship between these parameters.
A high multiple determination coefficients were obtained, its value being 0.202. This indicator implies that the regression model can account for 20.2% of the variance of the dependent variable (Indicator), the remaining 79.8% of the variance being due to other factors. In next step, the results of the variance analysis are considered in Table 9.
| Table 9 Variance Analysis |
||||||
| Model | Sum of squares | Deg. fr. | Average square | F | Value | |
| 1 | Regression | 25719.774 | 4 | 6429.944 | 140.884 | 0.001 |
| Excess | 100681.458 | 2206 | 45.640 | |||
| Total | 126401.232 | 2210 | ||||
The significance level of the value of the F-Fisher criterion is statistically significant (F=140.884, p<0.01), which is an evidence of the fact that the model can be meaningfully interpreted. Consider the final table with the values of non-standardized coefficients as Table 10.
| Table 10 Model Coefficients Table |
||||||
| Model | Non-standardized coefficients | Standardized coefficients | t | Value | ||
| B | Std. error | beta | ||||
| 1 | (Constant) | 15.026 | 0.155 | 96.987 | 0.001 | |
| 2015 | -0.156 | 0.056 | -0.471 | -2.769 | 0.006 | |
| 2016 | -0.095 | 0.077 | -0.288 | -1.233 | 0.218 | |
| 2017 | 0.209 | 0.104 | 0.633 | 2.001 | 0.046 | |
| 2018 | -0.104 | 0.096 | -0.320 | -1.093 | 0.274 | |
As the regression analysis shows, the non-standardized Beta coefficients and some coefficients of the independent variable (Year) are statistically significant (p<0.01). Consequently, the regression model can be written as follows: Indicator=Beta coefficient+Nonstandardized coefficient1*Year 2015+Non-standardized coefficient12*Year 2017.
Substituting the values from the table, we get:
Indicator=15.026-0.156*Year 2015 values+0.209*Year 2017 values.
Thus, based on 2015 and 2017 data, it is possible to predict 20.2% of Indicator results.
As mentioned before, many different researchers have tried to investigate the entrepreneurial activities in different countries (Wach and Krzysztof, 2015; Alexandrova and Verkhovskaya, 2015; Hessels et al., 2008; Amorуs et al., 2013; and Bosma & Schutjens, 2009) and they mainly have used data provided by Global Entrepreneurship Monitor, which includes lots of different and diverse criteria. But this research tries to reduce this huge number of, sometimes conflicting, criteria to some lesser numbers to give researchers a better, more accurate and more user-friendly criteria.
Conclusion
The study shows that the following factors determine the significance for entrepreneurial activities worldwide.
First of all, it is the entrepreneurial attitude, that is, the attitude of the country's population to recognizing opportunities, personal acquaintance with entrepreneurs, attaching a high status to entrepreneurs, such as entrepreneurial abilities associated with start-ups, indicator of the quality of the entrepreneurial environment in the country, the size of the technological sector, riskreadiness, entrepreneurial skills of the population, and motivation of entrepreneurs. Note that this group of parameters is of the greatest importance, explaining about 40% of the final results. During the period of three years, these parameters have been slightly weakened.
In addition, a notable factor is the one including the following parameters: access to capital for individual and institutional investors, entrepreneurial aspiration to introduce innovations, the level of entrepreneurs' education, and geographic concentration of entrepreneurs. This group of parameters explains about 20% of the final results. Also, it is worth noting that parameters such as the desire of entrepreneurs to enter global markets; the country's ability to develop new products, also explain about 11% of the final results, and in this way the value of this group of parameters is increasing. The fourth group includes the following parameters: creation of unique products; aspiration to growth (accounting for 9% of results). The fifth group (application of information technology, biotechnology) accounts for about 5% of the results.
Cluster analysis is based on a two-factor model including two factors. The evaluation of this model has shown that the parameters that make up each factor are fundamentally different. The first factor includes the following parameters: the desire to introduce new products, entrepreneurial abilities related to start-ups, the size of the technology sector, access to the capital of individual and institutional investors, the quality of the entrepreneurial environment, the desire of entrepreneurs to enter global markets, the level of entrepreneurs' education, motivation of entrepreneurs, and creation of unique products. The second factor includes: geographical concentration, the entrepreneurial skills of the population, risk-readiness. The scatter diagram and the dendrogram constructed on this basis show that, based on the existence of four clusters, it turns out that almost all countries (except Japan, Panama and Poland) are included in the first cluster.
Correlation analysis has been used to demonstrate the relationship between the indicators under consideration and the possible predictability of the results of the study. The constructed correlation model shows a strong direct relationship between the indicators considered. The constructed regression model shows that the indicators considered account for about 20% of changes in the business activity dynamics in the countries of the world. Thus, the predictability of the results is 20%.
Overall, this research presents a helicopter approach view on entrepreneurial activities' indices all around the world and providing a trend analysis for future of this criteria is also another contribution of our research.
References
- Alexandrova E.A., & Verhovskaya O.R. (2015). Entrepreneurial intentions in Russia: An empirical analysis. Russian Journal of Management, 2, 3-28.
- Amorуs J.E., Bosma N., & Levie J. (2013). Ten years of global entrepreneurship monitor: Accomplishments and prospects. International Journal of Entrepreneurial Venturing, 5(2), 120-152.
- Bosma, N.S., & Schutjens. (2009) Mapping entrepreneurial activity and entrepreneurial attitudes in European regions. International Journal of Entrepreneurship and Small Bussiness, 7(2), 191-213.
- Hessels, J., Van Gelderen, M., & Thurik, R. (2008). Entrepreneurial aspirations, motivations, and their drivers. Small Business Economics, 31(3), 323-339.
- Hoffmann, N.A. (2007). A rough guide to entrepreneurship policy. In Roy, T., Audretsch, D., & Grilo, I. (Eds.), Handbook of Research on Entrepreneurship Policy. Edward Elgar Press.
- Reynolds, P.D. (2007). Entrepreneurship in the United States the future is now. International Studies in Entrepreneurship, 15, 221.
- Schramm, C.J. (2008) Economic fluidity: A crucial dimension of economic freedom. Heritage Foundation
- Stasyuk, D.A. (2008). Entrepreneurial activity of foreign firms in the Russian economy. PhD Thesis, Moscow Financial-Industrial Academy.
- Uhlaner, L., & Thurik, R. (2007). Post materialism: A cultural factor influencing total entrepreneurial activity across nations. Journal of Evolutionary Economic, 17(2) 161-185.
- Wach, K. (2015). Impact of cultural and social norms on entrepreneurship in the EU: Cross country evidence based on GEM Survey Results. Zarządzanie w Kulturze, 16(1), 15-29.
- Wennekers S., Uhlaner L., Thurik R. (2002). Entrepreneurship and its conditions: A macro perspective. International Journal of Entrepreneurship Education (IJEE), 1(1), 25-64.
- Zoltan, A., & Szerb, L. (2009). The global entrepreneurship index (GEINDEX). Foundations and Trends R in Entrepreneurship, 5(5), 341–435.