Research Article: 2021 Vol: 25 Issue: 4S
How to Boost Corporate Investment for Commodity-Based Countries during the COVID-19 Pandemic?
Dhaha Praviandi K, IPB University
Hermanto Siregar, IPB University
Anny Ratnawati, IPB University
Solikin M Juhro, Bank Indonesia Institute
Keywords
Capital Expenditure, Determinant, Macro/Micro Indicator, Investment Behavior
Abstract
Since 2010, the low growth of corporate financing and investment in Indonesia has become a matter for policymakers to resolve. This study analyzes the determinants of Capital Expenditures (CAPEX) growth based on the threshold and country characteristics. The study uses the Threshold Autoregressive (TAR) model for the dynamic panel’s sample of 6 cross identifiers at the company’s level and 36 periods from 2011 to 2019. This study shows that Indonesia's export performance is unreliable and volatile. However, during the COVID-19 pandemic, the regression result advises that the companies raise CAPEX and invest more. The monetary authority should also follow this countercyclical policy by providing financial ease. Despite all of the outcomes, it is about time that commodity-exporting countries should become countries that create manufacturing items or boost their sales in the more creative service sector. It will be challenging that the reform should be taken gradually in order to smooth the adjustment.
Introduction
The severity of COVID-19's effects seems to be unparalleled, with the IMF referring to it as a "crisis unlike any other." Given how intertwined the region's economic flows are, supply networks were mainly exposed to the pandemic's adverse impacts. The epidemic has shown how reliant the global supply chain is on China, leading businesses worldwide to reassess their plans and reshore value chains to other locations. Rising geopolitical tensions and tariffs imposed by the US-China trade war have already compelled many firms to explore methods actively to reduce their reliance on China, a tendency intensified by the COVID-19 outbreak. Competitive prices, closeness to China, and expanding regional prosperity are putting Southeast Asia in a solid position to play a more significant part in tomorrow's supply chains (CEIC, 2021).
Southeast Asian nations must immediately and considerably boost their production capacity and supplement it with enhanced competitiveness via investments in human capital, infrastructure, and digital technologies to fully capitalize on the potential. However, both private investment and consumption are low. Even corporations that had accumulated large sums of cash due to the significant wealth impact of asset price gains would hesitate from investing (CEIC, 2021).
Beyond the health issue, the repercussions of COVID-19 caused an economic catastrophe, which impacted global civilization. Many countries are facing further economic turbulence as a result of their reliance on commodities. Commodity markets have responded significantly to the COVID-19 crisis with price fluctuations that reflect changes in supply and demand in commodity markets as a result of official initiatives to manage the epidemic, but also as a result of financial players' activity in commodity derivative markets. The combination of simultaneous supply and demand shocks, as well as local and worldwide economic recession, is unprecedented.
Furthermore, the crisis has once again highlighted the fundamental weaknesses of commodity-dependent developing countries. This inverse relationship between commodity dependency and economic and human development is due mainly to diminishing trade and volatility in global commodity prices, which are decided mainly by commodity futures markets and hence exogenous to commodity-dependent developing nations. The negative impact of commodity price on these nations makes price stability measurements at the international, regional, and national levels are required. Thus, economic diversification must be taken. It aims to lower the dependence on commodities in exports and imports (and hence prices) to promote economic and human development (Tröster & Küblböck, 2020).
On the other hand, the economic prognosis for commodity-exporting countries may worsen. The World Bank predicts that commodity-exporting developing nations' economies would contract by 4.8%, a substantially steeper decrease than that of other developing countries. It is critical for Indonesia, where natural resources (particularly oil, gas, coal, and palm oil) play a significant role in the economy. Indonesia, as a commodity exporter, is being adversely impacted by the drop in commodity demand.
A significant drop in consumption and investment is inevitable as a result of the economic slowdowns. Commodity producers bear a disproportionately significant burden as a result of this. A slight drop in demand for finished items leads to a considerably more significant drop in demand for raw resources like palm oil, rubber, copper, and iron. Given the importance of commodities in construction and industrial manufacture, a drop in investment would be felt much more acutely. With travel and tourism almost disappearing overnight, energy consumption has plummeted to levels not seen in decades (Donny Pasaribu & Krisna Gupta, 2020).
The commodities industry accounts for a disproportionate share of Indonesian government revenue. Non-tax revenue from oil and gas, mining, and forestry accounted for 9.4% of the central government budget in 2018, with tax revenue from oil and gas accounting for the remaining 3.3%. Even though Indonesia has been a net importer of oil since 2003, tax and non-tax revenue from the industry play an essential part in the central government budget. Oil, natural gas, mining, and forestry also contribute to district and provincial government budgets (Pasaribu, 2020). As a result, rather than exporting raw materials overseas, Indonesia has to climb up the value chain by implementing policies that encourage more significant investment in complicated and profitable commodity processing at home. Now is the moment for the country to concentrate on going up the value chain in manufacturing in order to utilize its natural advantages in order to increase its capital base and diversify its sources of national revenue (Nguyen, 2020).
Investment growth is essential to help the national economic recovery process. The role of the private sector is expected to continue to increase, supported by the granting of fiscal and non-fiscal incentives by the government (Ministry of Finance, 2020). Indeed, corporations play an essential role in the development of a country’s economy. In this case, corporate investment and financing are believed to have a high multiplier, which encourages higher capital expenditure (CAPEX) and financing, leading to economic development. It is consistent with (Sulistiawati, 2012) statement that investment is one of the main factors that support economic growth. Investment activities generate investments that will continue to increase the capital stock. Furthermore, increasing the capital stock will increase productivity, production capacity, and quality, increasing the sales growth.
Since 2010, the low growth of corporate financing and investment in Indonesia has become a matter for policymakers to resolve. In 2012, (Sulistiawati, 2012) stated that the stimulus provided to relax credit and increase liquidity in the economy had not impacted corporate investment growth. However, additional government spending is not an adequate response to recessions since there is limited evidence that it leads to a net increase in economic activity (Ramey & Zubairy, 2018).
The low corporate investment is consistent with the slowdown in credit, particularly related to corporate financing. It also explains the procyclicality of the relationship between credit and low economic growth. As the main factor determining a country’s economic growth, the rate of economic growth is positively correlated with investment, as stated by Keynes (Sulistiawati, 2012).
External financing to low- and middle-income countries are vulnerable to shocks, as the 2008 Global Financial Crisis demonstrated. During the recession, portfolio and other investment inflows fell sharply (or even reversed to negative territory), while remittances and FDI fell with a one-year lag. The current research shows that the COVID-19 crisis would have a more significant and more urgent effect. Although each country will experience the effect differs based on their respective finance mix and degree, both are predicted to experience a decline in financing. According to OECD estimates, inflows of foreign private financing to ODA-eligible countries could fall by USD 700 billion in 2020 compared to 2019. With all foreign private investment collapsing instantly, emerging countries face immense strain and a borrowing vacuum, exceeding the post-2008 Global Financial Crisis experience by 60% and equaling 35% of the 2018 amount of external funding (OECD, 2020).
Therefore, the government and society should be able to further optimize investment activities by optimizing its determinants. According to (Muhammad Paizal, 2012), micro-and macroeconomic conditions are the first factors that affect the ups and downs of stock prices, and stock prices determine a corporate decision to invest. The investment behavior of companies is explained by analyzing the company’s micro variables, such as cash flow (Bhagat et al., 2005; Koo & Maeng, 2005), sales growth (Karim, 2012; Adi & Muid, 2003), financial distress (Ogawa, 2003; Opler & Titman, 1994), and capital structure (de Crom, 2011). Meanwhile, macro variables, especially exchange rate (Bhandari & Upadhyaya, 2010), financial conditions index (Balfoussia & Gibson, 2019), (Gochoco-Bautista et al., 2014; Tran & Le, 2017), gross domestic product (Fauziana et al., 2014; Sabono & Kusreni, 2013; Adhidarma & Purbasari, 2015), average Q (Blundell et al., 1992; Fu et al., 2017) and commodity prices (Magud & Sosa, 2017), are also expected to increase the knowledge of corporate finance.
(Bhagat et al., 2005) stated that there was a relationship between investment and internal funds in a corporation, where (1) the corporation will show a positive cash flow sensitivity if it makes a profit, (2) the corporation will show minor cash flow sensitivity if it experiences a loss and invests more diminutive than the previous years, and (3) the corporation will show negative but strong cash flow sensitivity if it incurs a loss but continues to invest more than the previous years. (Adi & Muid, 2003) also added that the cash flow, company size, and sales growth simultaneously affect the level of corporate investment by 38.5%. Specifically, (Adi & Muid, 2003) prove that sales growth positively affects corporate investment; the higher the company size and sales growth, the higher the investment. (Opler & Titman, 1994) added that financial distress had a significant and positive relationship with corporate investment, which is consistent with the theory that firms are particularly vulnerable to financial hardship. Interaction is found between investment decisions and the capital structure of firms. There is empirical evidence of the Interaction and found a significantly negative relationship between leverage and investments (de Crom, 2011).
Corporate investment is not only influenced by micro indicators by also by macro indicators. It is confirmed by (Rashid & Saeed, 2017), who stated that the sensitivity of corporate investment decisions to macroeconomic uncertainty is higher than the specific uncertainties. One of the macro indicators that affect corporate investment is the exchange rate. (Bekman Siagian et al., 2019) analyzed the corporate investment response to exchange rate movements in five ASEAN (ASEAN-5) countries, and the results showed that currency depreciation could increase sales and company investment. (Tran & Le, 2017) stated that financial conditions affect the corporate investment behavior with negative cash flows, which means that better financial conditions reduce the level of “negative” financing constraints (i.e., the sensitivity of investment to negative cash flows).
The causality test for investment growth and GDP growth showed that there was a two-way relationship between them: this year’s GDP growth was significantly influenced by investment growth in the previous 3, 8, and 12 quarters, or, in other words, investment growth up to 3 years ago had an impact on GDP growth this year (Adhidarma & Purbasari, 2015). Fu, et al., (2017) argued that there is a relationship between the Q ratio and future operating performance, including investment, where corporations with a higher Q ratio tend to have superior operating performance in the long run. Their study (Magud & Sosa, 2017) explained that commodity prices play an important role in encouraging corporate investment. Their study also showed that the sharp fall in commodity prices since 2011 had been a significant factor in slowing investment growth, especially in countries with sizeable net commodity prices.
During the latest pandemic, the same downturn happened. The effect of the COVID-19 pandemic on commodity markets, on the other hand, has varied. In order to calibrate their policy responses, policymakers in commodity-exporting economies must consider whether the pandemic-induced shocks are likely to be short-lived or long-lasting. Immediate macroeconomic stimuli may cushion short-term shocks, but long-term shocks necessitate a long-term transition to a new economic reality. Commodity prices have historically been vulnerable to significant fluctuations, some of which were transient (“transitory”) and others extremely persistent (“permanent”) (World Bank, 2020).
This study is critical because of the novelty that can be considered in business decisions, optimizing investment, and boosting economic growth, especially in commodity-based countries. This study includes a threshold in analyzing the micro and macro factors, which have been detailed previously, which affect corporate investment; thus, a country can intervene on these factors based on the threshold of capital expenditure.
Literature Review
Macroeconomics in Corporate Investment Decisions
Investment is related to savings which can be used to spend additional capital. Therefore, countries with significant household savings produce goods faster, while governments that experience a surplus can invest the surplus in other capitals. One of the indicators to see the level of company investment is through capital expenditure. (Jason Fernando, 2021) explained that CAPEX is funds used by corporations to acquire, upgrade, and maintain the assets such as property and are often used to undertake investments. Corporations make this type of financial outlay to increase the scope of their operations or add some economic benefit to the operation.
During a highly destructive occurrence, such as the global coronavirus pandemic, it is critical to protect liquidity and cash flow while still maintaining or acquiring money. Although deferring CAPEX will help save money, CFOs also fail to determine which capital programs to exclude or where to allocate resources (Mishler, 2020).
CAPEX growth is proportional to new sales. CAPEX growth is commonly calculated as a percentage of new sales. (Farlex Financial Dictionary, 2012) defines sales growth as the amount a corporate derives from sales compared to a previous, corresponding period in which the latter sales exceed the former. Sales are a vital micro criterion for assessing a company’s profitability and are a significant indicator of company activities, including investment (Putra & Badjra, 2015). Sales growth has a strategic influence on the company as it is marked by an increase in market share, which will have an impact on increasing sales of the company to increase the profitability of the company, which will then encourage the company’s decision to invest (Pagano & Schivardi, 2003).
Economic development, in general, happens as a result of the increased demand for products and services. Increased consumer demand, increased foreign trade, and companies increasing their capital spending will affect the number of goods and services produced in an economy. GDP as one of the macroeconomic indicators has a powerful impact on investment behavior. Hasanah (2013) define GDP as the market value of all final goods and services produced in a country in a period. GDP is an indicator used to assess whether the economy is doing well or poorly in a country. Blanchard (2003) stated that the exchange rate is defined as the price of foreign currency measured in domestic currency. In short, the exchange rate is the exchange of two different currencies and is valued based on comparing the two. Changes in exchange rates can affect the competence of a corporation as the exchange rate fluctuations can affect the corporation’s revenue and operating costs, which then affect its stock price. The rise and fall of share prices can then influence the decisions of corporate investment.
In addition, Financial Composite Index (FCI) is also an essential macro-economic indicator in boosting investment. FCI is a comprehensive index constructed based on the combination of some variables, including currency price and asset price. FCI has become an important reference index in financial analysis and policymaking in some central banks and international institutions (Zheng & Wang, 2014). FCI refers to Citi research that has been explicitly calculated for each country. FCI is a weighted average of a series of financial variables, where weights are determined using reduced-form regressions for forecasting from coincident indicators: yield spread, mortgage interest rates, asset, and commodity prices.
The increase in investment can contribute to declining commodity prices in the future as investment triggers growth on the supply side. After Asian Financial Crisis in the late 1990s, a commodities boom facilitated Indonesia’s swift recovery from the crisis. Will a new commodities super cycle facilitate a swift recovery from the COVID-19 crisis for Indonesia? That stills a big question to answer (Indonesia Investments, 2021).
As one of the macro factors, commodities are often used to produce other goods or services. When they are traded on an exchange, commodities must also meet specified minimum standards known as base classes (Chen et al., 2020). Since commodities are traded on an exchange, the prices are not determined by an individual or entity. They are affected by many economic factors. The price of a commodity is determined by the forces of supply and demand for the commodity in the market (Balasubramaniam, 2020).
Capital Structures and Internal Funds as Investment Determinant
The COVID-19 pandemic affects firm borrowing capacity across the world. Several companies have been forced to implement furloughs and layoffs in order to remain afloat. Furthermore, disruptions in productivity, supply chain, and labor supply have resulted in a significant negative shock to overall demand and supply. Although companies with cash savings had an easy time dealing with the financial problems faced by the pandemic, many firms were forced to borrow to survive the crisis. Corporate borrowing is higher in countries with less preparedness and more stringent conditions than in others. As a result, it would significantly impact the capital structure (Akinsomi et al., 2014).
Safitri & Nur (2014) stated that choosing the proper capital structure will provide added value for the company because it will be very beneficial for the corporate shareholders, primarily if it generates more significant profits than before. Based on both statements, it is clear that a sound capital structure is expected to increase company profitability and is expected to increase firm value. One of the indicators to determine the capital structure is the debt-to-equity ratio. It is consistent with (Safitri & Nur, 2014) research, which shows that the debt-to-equity ratio is a valid indicator used to measure the capital structure. According to (Horne & Wachowicz, 2009), DER can be determined by dividing total debt by shareholder’s equity and multiplying by 100%.
Cash flow is the amount of cash that goes and comes from a corporation’s activities in a period. Hisham, et al., (2019) found that cash flow has a significant influence on capital expenditure decisions in the long and short term. It could happen because the function capsized growth owned by cash flow as an internal is intended to increase wealth for the long term. The cash flow model emphasizes the importance of internal funds as a driving factor for investment because subsequently, the additional funds will be used as initial cash flows as investment capital.
Market Variables, Tobin-Q, and Corporate Investment
The proof suggests that as disasters arise, firm worth decreases and the COVID-19 pandemic is no different. The difference in Tobin's Q between the typical average value of Tobin's Q from various periods is used to calculate the change in firm value (Bose et al., 2021). The principle of the Tobin Q model is to link corporate value based on market value with financing needs. Agung (2000) found that the investment expenditure of companies is sensitive to expected future returns as indicated by the average Q. Based on this statement, (Castro & Sauaia, 2002) concluded that Tobin’s Q has historical information to meet future investment needs.
Tobin's Q ratio can be used to explain investment and diversification between companies. This ratio also explains the relationship between current asset ownership and firm value and the relationship between company performance and investment opportunities (Ramadan & Syakhroza, 2014).
Financial distress is a condition that shows a decline in the company’s financial condition before bankruptcy or liquidation (Almilia, 2006). One indicator of financial distress is the Altman Z-score coefficient, which is a bankruptcy model that has been adjusted for developing countries. The Z-score is a linear combination of four or five financial ratios weighted with specific coefficients from the Altman estimate. Altman conducted a sample separation between companies that have declared bankruptcy and survived to produce coefficients. The company is then reclassified based on size and financial ratios. After the sample is classified, the coefficient is determined by discriminant analysis.
GVC Participation and Non-Linearity of Investment Behavior
Supply chain and travel disturbances caused by COVID-19 can weaken economic integration and promote self-sufficiency, at least in strategic sectors such as medical equipment and medicines, or the development of inputs for assembling sophisticated machines, the final assembly of which still takes place in high-wage countries. This trend is reflected in the increasing number of provisional export bans and sanctions on vital goods imposed by various countries following the outbreak. As a result, it is not surprising that most experts believe the latest pandemic will reinforce migration and restoring patterns. With most countries in a complete or partial lockout and exchange and investment contract, the prospect of offshoring is more unpredictable than it was before COVID-19 (Fortunato, 2020).
According to the World Bank Report (2020), GVC participation is classified as commodities, manufacturing Dan innovation group. The share of total domestic value determines the level of participation added, backward manufacturing, and I.P. receipts as a percentage of GDP. It is also characterized by low political stability, low foreign direct investment inflows, high manufacturing import tariffs, low customs efficiency, and low logistics performance index scores. On average, countries in the manufacturing group exhibit further improved political stability, substantially higher FDI inflows, substantially lower average tariffs, better customs efficiency, and a higher logistics performance index than the limited manufacturing group. Countries like the innovative activities group show improved political stability, percent higher FDI inflows, lower tariffs, higher customs efficiency, and a better logistics performance index relative to the advanced manufacturing and services group.
The relationship between these factors and the level of participation is not linear. Countries with higher levels of participation require a much higher increase in factors than countries with lower participation. It will implicitly also has an impact on the investment behavior and its nonlinear factors. Countries that have a high investment growth rate need more support from macro factors and micro factors.
Method
Research Model
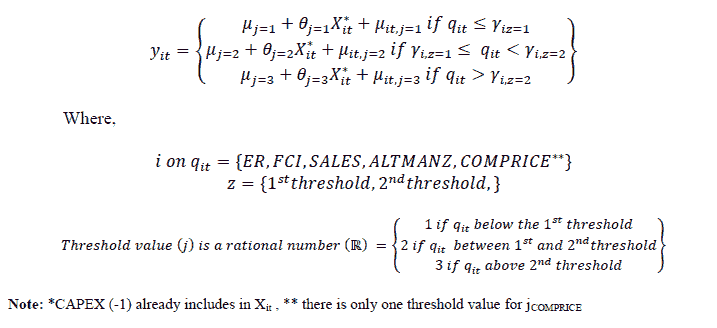
This study uses the threshold autoregressive (TAR) model developed by (Tong, 1983); the threshold auto regression method is developed for non-dynamic panels with individual-specific fixed effects. This method answers whether the regression function is identical in all observations or their characteristics based on their class (Surjaningsih et al., 2014). According to (Hansen, 1999; Surjaningsih et al., 2014), the panel used in the non-dynamic model of panel data is a balanced panel with the structure { yit,qit,xit:1 ≤i ≤n,1 ≤t ≤T} The dependent variable is represented by yit for “i” as individual and “t” as time in scalar form, is an independent variable in matrix form qit, is the scalar threshold variable, and μi represents the individual effect. I ( qit≤ γ) is an indicator function with a value of 1 or 0 depending on its threshold value. Threshold testing is carried out for macro, micro, and sectoral models.
The regression threshold model for panel data is denoted as follows:
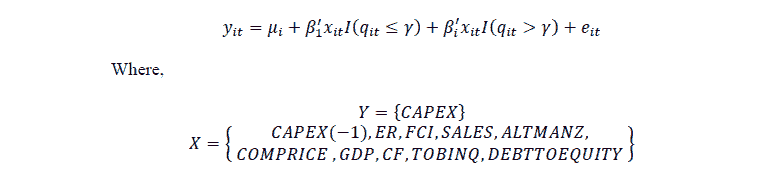
The explanation is as follows:
CAPEX : Capital Expenditure at the current period
CAPEX (-1) : Capital Expenditure one period before
E.R. : Exchange Rate
FCI : Financial Conditions Index
SALES : Sales
ALTMANZ : Altman Z score
COMPRICE : Commodity Price
GDP : Gross Domestic Products
C.F. : Cash Flow
TOBINQ : Tobin’s Q Value
DEBTTOEQUITY : Debt to Equity Ratio
Threshold determination uses the threshold autoregressive and Markov regime-switching models, with the basic model as follows:
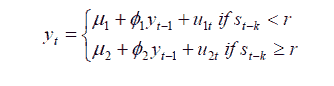
This study performs the above function modifications to fit the context of our variables. Below are the models we've modified.
Many benefits of TAR specification include linear difference equations, statistical inference for well-controlled linear Gaussian processes, minimal variance estimates, and a functional method for prediction and management. This representation, though, is constrained in that the linearity limits the potential dynamics. If we reject the linearity principle and embrace nonlinear functions of past and present values, the past will provide valuable knowledge for the future, the class of linear ARMA models which not fit in the following areas of concern. The series does, in reality, exhibit nonlinear dynamics (Djeddour & Boularouk, 2013).
Data
This research is quantitative, and the data set has been obtained from previously available data. Quarterly financial reports of corporations were compiled from Bloomberg, Capital I.Q., and Citi analysis from 2011 to 2019 (quarterly). The companies chosen as the sample come from countries with varying levels of participation in the GVC. There are six chosen companies from each country. In total, we have 216 unstacked panel observations, which consist of 6 cross identifiers at the company’s level and 36 periods of time. The selection of these companies considers the representation of the market capitalization, which is 80%. Samples are carried out only for commodity countries. Based on World Bank’s classification, this research chooses six countries as representatives of commodity countries which are Australia, Russia, Brazil, Africa, Indonesia, and Philippines.
The financial statements data used includes (a) corporate spending measured by growth in annualized capital expenditure, (b) corporate cash flows calculated by growth in annualized free cash flows or operating profit after tax plus depreciation, and (c) business revenue determined by annualized growth in sales. Macro indicators data –relevant and general macro data –are derived from Bloomberg, Capital I.Q., and Citi between 2010 and 2019. Relevant macro details, such as exchange rates, equity prices, credit interest rates, and the Financial Conditions Index for countries (FCI). FCI is derived from Citi analysis, which has been precisely measured for each country. Commodity prices that use the Bloomberg Commodity Index as a proxy are general macro results.
Results

Figure 1: Capex Comparison Between Commodity Countries ($)
Indonesia is one of the countries with commodity-based exports. However, and when Indonesia is compared to a country with similar characteristics, Indonesia is still far behind. Figure 1 shows that the countries with the most significant commodity supply cap and capitalization are Russia and Australia. When we compare Australia and Brazil, then the value of Brazil's exports tends to be more volatile with a downward trend. It contrasts to Australia, which still has the largest capitalization with a steady trend every year. The capitalization of Indonesia's export value is the smallest of all countries sampled in this study. Even Indonesia's export capitalization value is lower compared to Russia.
If we only look at Indonesia's export performance from the first chart, it can lead to misinterpretation. It is because the capitalization value is too small compared to similar countries. If we use elasticity calculation in assessing Indonesia's export performance, it will be illustrated in the second part. In this section, it is seen that Indonesia's export performance fluctuates every year. Sometimes Indonesia's export performance is positive in specific periods and harmful in other periods. It indicates that Indonesia's export performance is very volatile. Indonesia's export performance grew approximately 6.21% every quartal. By looking at the current conditions, the Covid 19 pandemics will significantly affect Indonesia as a country with small and open economic characteristics. This characteristic has resulted in Indonesia is highly exposed to changes and happenings in other countries. However, Indonesia is not the most at-risk country. Brazil is the country with the highest volatility.

Figure 2: Capex Comparison Between Commodity Countries ($)
This study assumes that the amount of Capital expenditure in the current period will be influenced by the amount of capital expenditure one period earlier. Based on these assumptions, the analysis tool we use is an auto regression threshold with one lag. To give us an idea of the extent to which the assumptions fit with the model, we plotted the CAPEX variable with CAPEX (-1) into a plot chart (Figure 2), which is contained in the third chart. The blue dots present the first autoregressive relationship. The correlation value we get is 8%, with a positive significance value. This correlation value is indeed small. However, we cannot interpret that way does not correlate. Therefore, it is the regression model that we use and adds other variables to enrich the covariate.

Figure 3: Scatterplot For Capex And Capex (-1)
The regression result in the first table will use the Exchange Rate (E.R.) variable as the threshold. Simulation conducted by reviews, dividing the Variable Exchange Rate (E.R.), i.e., at values below 1.05, between 1.05 and 3.97, and above 3.97. In this table, not all thresholds show the expected significance value. Regression results using thresholds between 1.05 and 3.97 indicate that all independent variables statistically significantly affect the amount of capital expenditure, in addition to cash flow variables. Interestingly, GDP variables have a negative coefficient. It means GDP is inversely proportional to CAPEX. The simple way, if economic conditions worsen, then companies tend to increase CAPEX and vice versa. A value of R Square of 98.6% indicates that this model meets the Goodness of Fit (Table 1).
| Table 1 Threshold Auto Regression Result, With Exchange Rate (E.R) As The Indicator Function |
||||||
|---|---|---|---|---|---|---|
| Variable | ER<1.05 | 1.05 = ER< 3.97 | ER = 3.97 | |||
| Coef. | Prob. | Coef. | Prob. | Coef. | Prob. | |
| C | -7168.326 | 0.118 | 5187.59 | 0 | -12.693 | 0.79 |
| CAPEX(-1) | 0.032 | 0.633 | 0.238 | 0 | -0.009 | 0.807 |
| ER | 675.848 | 0.026 | 233.847 | 0 | 0.001 | 0.575 |
| FCI | 69.811 | 0.121 | 34.108 | 0 | 0.608 | 0.152 |
| SALES | 0.212 | 0.097 | 0.031 | 0.006 | 0.271 | 0 |
| ALTMANZ | 353.1 | 0.818 | 2511.459 | 0 | 103.093 | 0.307 |
| COMPRICE | -0.712 | 0.505 | 4.223 | 0 | 0.112 | 0.554 |
| GDP | -47.604 | 0.023 | -14.622 | 0.033 | -2.827 | 0.456 |
| CF | -91.218 | 0.151 | -0.004 | 0.85 | -2.287 | 0 |
| TOBINQ | 45.268 | 0.961 | 1216.112 | 0 | 70.539 | 0.243 |
| R square=0.985774, Prob.=0.000 | ||||||
Table 2 uses a regression model similar to the first table. The difference lies in the threshold indicator used. The second table uses the Financial Condition Index (FCI) as the threshold. As with the first table, the FCI indicator is automatically divided into three categories. The first category is the result of regression using indicators below the threshold value. The second category is output by accommodating indicator values between two thresholds.
Moreover, the third category results from regression, assuming the indicator is above the threshold value. The second table shows that in the second category, CAPEX(-1), ALTMANZ, COMPRICE, and SALES had a significant and positive impact on the amount of CAPEX in the current period. Regression results In the second and third categories assume that the FCI value is getting more significant. It means that in the context of macroeconomics, there are tighter financial conditions. In this condition, two variables negatively affect the amount of CAPEX in the current period, which is the weakening exchange rate and the smaller FCI value. The smaller FCI value indicates that in monetary easing, the company will tend to increase CAPEX.
| Table 2 Threshold Auto Regression Result, With Financial Condition Index (Fci) As Indicator Function |
||||||
|---|---|---|---|---|---|---|
| Variable | FCI<96.22 | 96.22 = FCI<98.98 | FCI = 98.98 | |||
| Coef. | Prob. | Coef. | Prob. | Coef. | Prob. | |
| C | -7.095 | 0.954 | 3533.469 | 0.232 | -15677.97 | 0.018 |
| CAPEX(-1) | 0.038 | 0.915 | 0.625 | 0 | 0.221 | 0.001 |
| ER | -0.001 | 0.83 | -18.022 | 0 | -39.817 | 0 |
| FCI | -20.16 | 0.023 | -17.478 | 0.549 | -174.967 | 0.009 |
| ALTMANZ | 5.509 | 0.938 | 846.225 | 0 | 522.373 | 0 |
| COMPRICE | 0.057 | 0.933 | 4.268 | 0 | 1.042 | 0.344 |
| SALES | 0.446 | 0.003 | 0.105 | 0 | 0.074 | 0 |
| R square=0.892453, Prob.=0.000 | ||||||
The third table uses the variable SALES as a threshold indicator. The third table in the second is the best model. It means that medium-sized companies are the sectors that contribute the most to CAPEX fluctuations in a country. Meanwhile, small companies and giant companies did not make a significant contribution to the CAPEX change. We estimate that in countries with commodity-based exports, most of the economy is supported by companies with medium categories. On the recommended model in the third table, three variables may negatively impact CAPEX in the current period (Table 3).
The three variables are E.R., FCI, and SALES. E.R. and FCI contributions are already discussed in the first table and the second table. In the third table, the negative value of the SALES coefficient indicates that fewer SALES will positively impact the amount of CAPEX. It can mean that companies tend to behave counter-cyclically in response to shocks that occur. For example, when the value of sales decreased due to the impact of the covid 19 pandemic, companies on a medium scale tend to invest more to increase sales in the current year. An example of an investment that may be made during the pandemic is to move to a digital-based economy.
| Table 3 Threshold Auto Regression Result, With Sales As The Indicator Function |
||||||
|---|---|---|---|---|---|---|
| Variable | SALES<11.70 | 11.70 = SALES<44.70 | SALES = 44.70 | |||
| Coef. | Prob. | Coef. | Prob. | Coef. | Prob. | |
| C | 1124.415 | 0.65 | 2461.373 | 0 | 58.827 | 0.798 |
| Capex-1 | 0.087 | 0.402 | 0.299 | 0 | 0.194 | 0.225 |
| ER | -3.947 | 0.147 | -21.608 | 0 | -0.001 | 0.822 |
| FCI | -8.868 | 0.698 | -2.842 | 0.009 | -1.826 | 0.137 |
| GDP | -4.214 | 0.809 | -36.235 | 0.298 | -11.249 | 0.735 |
| ALTMANZ | 14.406 | 0.92 | 773.228 | 0 | 3.424 | 0.967 |
| SALES | 0.027 | 0.315 | -0.043 | 0.006 | 0.063 | 0.03 |
| COMPRICE | 0.006 | 0.996 | 0.58 | 0.463 | 0.304 | 0.695 |
| R square=0.863141, Prob.=0.000 | ||||||
The Altman Z-score is the output of a credit-strength test that gauges a publicly traded manufacturing company's likelihood of bankruptcy. The 4th table uses this assumption as a threshold indicator. Almost all independent variables have a significant impact on CAPEX changes. Exceptions apply to SALES variables in the first category, CAPEX variables (-1) in the second category, and GDP and ALTMANZ variables in the third category. It is interesting to note that ALTMANZ variables are independent of CAPEX in the third category. An Altman Z-score close to 1.8 suggests a company might be headed for bankruptcy, while a score closer to 3 suggests a company is in solid financial positioning. In the third category, the value of the variable ALTMANZ is more significant than 1.28. This value is less than the minimum reference value of 1.8. It indicates that countries with commodity-based exports from 2011 to 2019 experienced difficulties or even losses in conducting their business, especially exports. It indicates that, in this modern era, it is time for commodity-based export countries to start turning into countries that produce Manufacturing products or increase sales in the more innovative service sector (Table 4).
| Table 4 Threshold Auto Regression Result, With Altman Z Score (Altmanz) As Indicator Function |
||||||
|---|---|---|---|---|---|---|
| Variable | ALTMANZ<1.09 | 1.09 = ALTMANZ<1.28 | ALTMANZ = 1.28 | |||
| Coef. | Prob. | Coef. | Prob. | Coef. | Prob. | |
| C | 9098.524 | 0.002 | 7829.33 | 0 | -1183.108 | 0 |
| Capex-1 | 0.23 | 0 | 0.096 | 0.41 | 0.205 | 0.049 |
| ER | -7.468 | 0.034 | -81.483 | 0 | -0.014 | 0 |
| FCI | -77.779 | 0.004 | -26.876 | 0 | -7.439 | 0 |
| GDP | 97.559 | 0 | 93.114 | 0.025 | 21.73 | 0.068 |
| ALTMANZ | 1628.641 | 0.003 | 1681.235 | 0 | 92.019 | 0.266 |
| SALES | 0.027 | 0.279 | 0.116 | 0 | 0.248 | 0 |
| COMPRICE | 3.905 | 0.004 | 3.879 | 0 | 1.094 | 0.022 |
| DEBTTOEQUITY | 5.682 | 0 | 10.995 | 0 | 10.18 | 0 |
| R square=0.932137, Prob.=0.000 | ||||||
Table Five powerfully represents the characteristics of countries with commodity-based exports. It is because the threshold indicator used is commodity price (COMPRICE). In the 5th table, almost the entire covariate significantly affects the amount of CAPEX. Exceptions apply to CAPEX (-1) and COMPRICE In the first category, SALES and COMPRICE In the second category. COMPRICE variables in both categories do not have a significant impact on CAPEX changes. It means that, in countries with commodity-based exports, price fluctuations do not affect or are independent of the amount of CAPEX. It can mean that the decision to increase or decrease CAPEX in countries with commodity-based exports has nothing to do with price fluctuations at the international level (Table 5).
Simply put, this can mean that the offering of commodity products is inelastic. Logically, these countries have difficulty changing their business structure when prices are volatile due to limited capacity and time to make adjustments. The supply structure that tends to be inelastic can also mean producers get a more extensive economic surplus than consumers in the country.
| Table 5 Threshold Auto Regression Result, With Commodity Price (Comprice) As Indicator Function |
||||
|---|---|---|---|---|
| Variable | COMPRICE<94.67 | COMPRICE<94.67 | ||
| Coef. | Prob. | Coef. | Prob. | |
| C | -1646.365 | 0 | -1395.745 | 0 |
| Capex-1 | 0.026 | 0.914 | 0.209 | 0 |
| ER | -0.019 | 0 | -0.011 | 0.044 |
| FCI | -8.347 | 0 | -5.594 | 0 |
| GDP | -54.574 | 0 | -39.206 | 0.003 |
| ALTMANZ | 299.973 | 0 | 171.66 | 0.003 |
| SALES | 0.207 | 0 | 0.005 | 0.635 |
| COMPRICE | 0.465 | 0.709 | 0.997 | 0.656 |
| DEBTTOEQUITY | 9.874 | 0 | 9.888 | 0 |
| R square=0.875181, Prob.=0.000 | ||||
Discussion and Conclusion
Indonesia is one of the commodities-based exporting countries. However, Indonesia is still far behind when compared to a country with comparable characteristics. It shows that the export performance of Indonesia is quite unreliable.
This autoregressive model shows that the association between prior capital expenditure and present capital expenditure is positive. Moreover, in a country with commodity-based exports, if economic circumstances deteriorate, corporations prefer to raise CAPEX and invest more. We also observed that less FCI suggests that the corporation would raise the CAPEX if a monetary easing policy is applied. However, corporations tend to be cyclically counteracting the shocks in terms of SALES reduction. Despite all of the outcomes, it is about time that commodity-exporting countries should become countries that create manufacturing items or boost their sales in the more creative service sector. Adjusting their business structure will be challenging, especially at a time when prices are unpredictable. Limited capacity and time for adjustment should be considered as well. As such, a structural reform policy should be progressively implemented in the country with commodity-based exports.
Acknowledgement
The authors thankfully acknowledge support from IPB University, Indonesia, and Bank Indonesia Institute, Indonesia.
References
- Abdul, K.Z. (2012). Monetary policy effects on investment spending: A firm-level study of Malaysia. Studies in Economics and Finance, 29(4), 268-286.
- Akinsomi, O., Ong, S.E., Ibrahim, M.F., & Newell, G. (2014). The idiosyncratic risks of a Shariah compliant REIT investor. Journal of Property Research, 31(3), 211-243.
- Balasubramaniam, K. (2021). Who sets the price of commodities? Retrieved from https://www.investopedia.com/ask/answers/06/commodityprices.asp.
- Balfoussia, H., & Gibson, H.D. (2019). Firm investment and financial conditions in the euro area: Evidence from firm-level data. Applied Economics Letters, 26(2), 104-110.
- Bekman, S., Sugiharso, S., Telisa, A.F., & Juda, A. (2019). Corporate investment policy and currency value in asean-5 countries: Firm level analysis for 2001–2014. International Journal of Business and Society, 20(S1), 145-162.
- Bhagat, S., Moyen, N., & Suh, I. (2005). Investment and internal funds of distressed firms. Journal of Corporate Finance, 11(3), 449-472.
- Bhandari, R., & Upadhyaya, K.P. (2010). Panel data evidence of the impact of exchange rate uncertainty on private investment in South-east Asia. Applied Economics, 42(1), 57-61.
- Blundell, R., Bond, S., Devereux, M., & Schiantarelli, F. (1992). Investment and Tobin’s Q. Evidence from company panel data. Journal of Econometrics, 51(1–2), 233-257.
- Bose, S., Shams, S., Ali, M.J., & Mihret, D. (2021). COVID‐19 impact, sustainability performance and firm value: International evidence. Accounting & Finance, 61(2).
- CEIC. (2021). Foresight 2021 Report. Retrieved from https://info.ceicdata.com/en/our-insights-foresight-2021-report.
- Chen, A., Haberman, S., & Thomas, S. (2020). The implication of the hyperbolic discount model for the annuitisation decisions. Journal of Pension Economics and Finance, 19(3), 372-391.
- Deisirey, J.S., & Sri, K. (2013). Analysis of causality relationship between investment and gross regional domestic products of maluku province, 2002-2011. Airlangga Journal Of Economics and Business, 23(2), 122.
- Djeddour, K., & Boularouk, Y. (2013). Application of threshold autoregressive model: Modeling and forecasting using U.S. Exports of crude oil data. American Journal of Oil and Chemical Technologies, 1(9).
- Donny, P., & Krisna, G. (2020). COVID-19 punishes Indonesian commodity exporters. East Asia Forum. Retrieved from https://www.eastasiaforum.org/2020/07/16/covid-19-punishes-indonesian-commodity-exporters/.
Henrique C.F., & Antonio, C.A.S. (2002). Is the Tobin’s q a good indicator of a company’s performance? Developments in Business Simulation and Experiential Learning. Retrieved from https://www.researchgate.net/publication/329339275_Is_the_Tobin’s_q_a_good_indicator_of_a_company’s_performance. - Farlex Financial Dictionary. (2012). Sales growth financial definition of sales growth. Retrieved from https://financial-dictionary.thefreedictionary.com/Sales+Growth.
- Fauziana, L., Mulyaningsih, A., Anggraeni, E., Chaola, M.S.Y., Rofida, U., Ekonomi Pembangunan, J., … & Negeri, S.U. (2014). The relationship of capital investment to Indonesia's GDP. Economics Development Analysis Journal, 3(2).
- Frank, C. (2011). Impact of capital structure choice on investment decisions. Universiteit van Tilburg.
- Fu, L., Parkash, M., & Singhal, R. (2017). Tobin’s q ratio and firm performance. International Research Journal of Appllied Finance, 7(4).
- Galih, A., & Denni, P. (2015). Understanding the relationship between investment and GDP.
- Gochoco-Bautista, M.S., Sotocinal, N.R. & Wang, J. (2014). Corporate investments in Asian markets: financial conditions, financial development, and financial constraints. World Development, 57, 63-78.
- Hansen, B.E. (1999). Threshold effects in non-dynamic panels: Estimation, testing, and inference. Journal of Econometrics, 93(2), 345-368.
- Hasanah, E.U. (2013). Introduction to macroeconomics: Theory and problems latest edition. Universitas Negeri Jakarta: Caps Publishing. Retrieved from ttp://lib.unj.ac.id/buku/index.php?p=show_detail&id=38121&keywords=.
- Hisham, A.A.M., Karim, Z.A. & Khalid, N. (2019). Determinants of capital expenditure spending in Malaysian palm oil industries: A dynamic panel data analysis. Economic Journal of Emerging Markets, 11(2), 223-233.
- Indonesia Investments. (2021). Soaring commodity prices since 2H-2020: A new ‘Commodities Supercycle’ in the 2020s? Retrieved from https://www.indonesia-investments.com/id/news/todays-headlines/soaring-commodity-prices-since-2h-2020-a-new-commodities-supercycle-in-the-2020s/item9394.
- Jason, F. (2021). Capital Expenditure (CapEx). Retrieved from https://www.investopedia.com/terms/c/capitalexpenditure.asp.
- Koo, J., & Maeng, K. (2005). The effect of financial liberalization on firms’ investments in Korea. Journal of Asian Economics, 16(2), 281-297.
- Kusuma, A.D., & Muid, D. (2003). Analysis of factors affecting capital expenditure: With pecking order theory approach (Empirical study on manufacturing companies on the IDX). Diponegoro Journal of Accounting, 2(4), 1-15.
- Luciana, S.A. (2006). Prediction of financial distress conditions of go-public companies using multinomial logit analysis. Journal of Economics and Business, 9(1), 1-26.
- Magud, N.E. & Sosa, S. (2017). Corporate investment in emerging markets: The role of commodity prices. EconomÃa Journal, 18(1), 157-195.
- Mark, D.Mr. (2020). Capex risk management during the coronavirus pandemic. Journal of Accountancy. Retrieved from https://www.journalofaccountancy.com/issues/2020/dec/capex-risk-management-during-coronavirus-pandemic.html.
- Ministry of Finance, I. (2020). KERANGKA EKONOMI MAKRO. Retrieved from https://fiskal.kemenkeu.go.id/data/document/kem/2021/files/kem_ppkf_2021.pdf.
- Muhammad Paizal, H. S. P. S. (2012). The effect of macro-economic and micro companies on stock prices of automotive sub sector companies listed on the Indonesia stock exchange for the 2012-2015 period. Jurnal Online Mahasiswa (JOM) Bidang Manajemen, 1(1).
- OECD. (2020). The impact of the coronavirus (COVID-19) crisis on development finance. Retrieved from https://www.oecd.org/coronavirus/policy-responses/the-impact-of-the-coronavirus-covid-19-crisis-on-development-finance-9de00b3b/.
- Olivier, B. (2003). Macro-economics: 3rd (Third) edition. Prentice Hall. Retrieved from https://www.amazon.com/Macroeconomics-3rd-Third-Olivier-Blanchard/dp/B00866NABG.
- Opler, T.C., & Titman, S. (1994). Financial distress and corporate performance. The Journal of Finance, 49(3), 1015-1040.
- Pagano, P., & Schivardi, F. (2003). Firm size distribution and growth. Scandinavian Journal of Economics, 105(2), 255-274.
- Piergiuseppe, F. (2020). How COVID-19 is changing global value chains. UNCTAD. Retrieved from https://unctad.org/news/how-covid-19-changing-global-value-chains.
- Ramadan, Z.E., & Syakhroza, A. (2014). Analysis of the relationship between company performance and working capital management in non-financial companies in Indonesia. Retrieved from http://lib.ui.ac.id/naskahringkas/2016-05/S58260-Zuchaeri Ecky Ramadan.
- Ramey, V.A., & Zubairy, S. (2018). Government spending multipliers in good times and in bad: Evidence from U.S. historical data. Journal of Political Economy, 126(2), 850-901.
- Rashid, A., & Saeed, M. (2017). Firms’ investment decisions: Explaining the role of uncertainty. Journal of Economic Studies, 44(5), 833-860.
- Safitri, N.O. (2014). The influence of capital structure and profitability on firm value (A Study in Retail Companies Listed in Indonesia Stock Exchange 2010-2013 period). Journal of Business Administration, 13(2), 1-19.
- Sulistiawati, R. (2012). The effect of investment on economic growth and employment absorption and community welfare in provinces in Indonesia. Journal of Economics, Business and Entrepreneurship Untan, 3(1), 10500.
- Surjaningsih, N., Maryaningsih, N., & Savitri, M. (2014). Threshold of real exchange rate and the performance of manufacturing industry in Indonesia. Bulletin of Monetary Economics and Banking, 16(4), 373-394.
- Tong, H. (1983). Threshold Models in Non-linear Time Series Analysis. New York: Springer.
- Tran, N.H., & Le, C.D. (2017). Financial conditions and corporate investment: Evidence from Vietnam. Pacific Accounting Review, 29(2), 183-203.
- Trinh, N. (2020). How Indonesia can rev up its faltering economic growth - carnegie endowment for international peace. Retrieved from https://carnegieendowment.org/2020/08/19/how-indonesia-can-rev-up-its-faltering-economic-growth-pub-82477.
- Tröster, B., & Küblböck, K. (2020). Unprecedented but not unpredictable: Effects of the COVID-19 crisis on commodity-dependent countries. European Journal of Development Research, 32(5), 1430-1449.
- Van, H., & John, M.W. (2009). Fundamentals of financial management (13th Edition). Prentice Hall. Retrieved from https://www.amazon.com/Fundamentals-Financial-Management-James-Horne/dp/8120338979.
- World Bank. (2020). Impact of COVID-19 on commodity markets heaviest on energy prices: Lower oil demand likely to persist beyond 2021. Retrieved from https://www.worldbank.org/en/news/press-release/2020/10/22/impact-of-covid-19-on-commodity-markets-heaviest-on-energy-prices-lower-oil-demand-likely-to-persist-beyond-2021.
- Zheng, G., & Wang, Y. (2014). Financial conditions index’s construction and its application on financial monitoring and economic forecasting. Procedia Computer Science, 31, 32–39.