Research Article: 2023 Vol: 27 Issue: 2
Innovation Index in Europe
Angelo Leogrande, LUM University
Lucio Laureti, LUM University
Alberto Costantiello, LUM University
Citation Information: Leogrande, A., Laureti, L., Costantiello, A. (2023). The Innovation Index in Europe. International Journal of Entrepreneurship, 27(2), 1-45.
Abstract
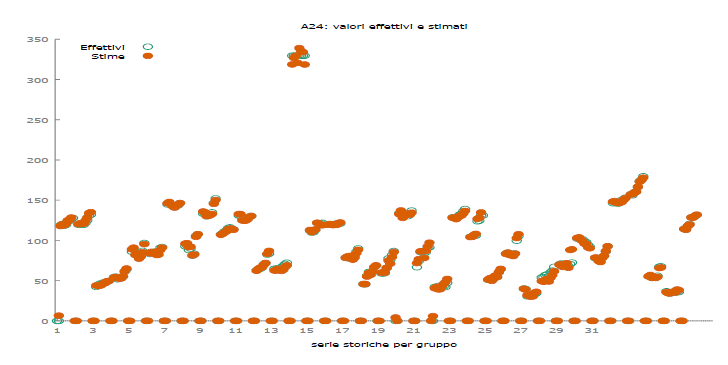
The following article analyzes the determinants of the innovation index in Europe. The data refer to the European Innovation Scoreboard-EIS of the European Commission for the period between 2010 and 2019 for 36 countries. The data are analyzed using the following econometric techniques: Panel Data with Random Effects, Panel Data with Fixed Effects, Dynamic Panel Data, Pooled OLS, WLS. The results show that the Innovation Index is negatively connected to some variables, among which the most significant are "GDP per capita", "R&D expenditure public sector", "Venture capital", "Tertiary education", and positively connected to some variables among which the most relevant are: "Government procurement of advanced technology products", "Average annual population growth", "Finance and support", "Human resources", "Marketing or organisational innovators", "Linkages". A clustering was then carried out using the unsupervised k-Means algorithm optimized with the Silhouette coefficient which shows the presence of 2 clusters per value of the Innovation Index. Eight machine learning algorithms has been used for prediction with real data. The Tree Ensemble Regression algorithm has been chosen as best performer. A further prediction has been made with the augmented data. The result shows that the best performing algorithm is Linear Regression with an innovation index value predicted to grow by approximately 3.38%
Keywords
Innovation and Invention, Processes and Incentives, Management of Technological Innovation and R & D, Diffusion Processes, Open Innovation.
Introduction
The analysis of technological innovation has become an essential component of both the economic policies of countries and the macro-economic condition of globalization. In fact, the current global economic scenario is crossed by a real tech-war that pits the US against China. In the midst of this competition is Europe. Europe is certainly not the leading country in terms of technological capacity, innovation and research and development as this primacy belongs to the USA. However, even in Europe it is possible to find "innovation champions" above all, in Northern Europe able to compete internationally. The analysis of the innovation index is therefore relevant from an international point of view since a large part of the productivity and competitiveness of countries depends on technology and research and development. However, the analysis of technological innovation is also relevant in the context of the European Union to verify the presence of phenomena of convergence and divergence between areas with differentiated economic development. In this sense it is certainly true that there is a contrast between Central-Northern Europe and Southern-Eastern Europe. This delay in the sense of technological innovation that is experienced in Southern and Eastern Europe is also significantly due to inequalities in human capital, in the production and accumulation of intangible capital. These reasons of a macro-economic, global, and economic policy nature lead us to analyze the role of the innovation index in Europe. The Innovation Index in this case means the indicator produced by the European Commission through the European Innovation Scoreboard. And from this analysis can only derive the implications of economic policy that highlight the need of the European policy maker to intervene significantly in innovation both to guarantee the EU a role in global competition and to reduce imbalances within the EU.
Literature Review
The question of innovation has been addressed by economists in the context of economic growth theories, economic policies, and methodologies for the growth of competitiveness at the national level. Here are some bibliographical references that are useful for framing the analysis topic. Innovation is certainly the product of the knowledge accumulated in the context of economic growth processes and in this sense, it is part of the classical modeling of economic growth (Solow, 1956). The theory of endogenous economic growth has also recognized the role of technological innovation, human capital, and research and development as determinants capable of explaining the dynamics of GDP in high-income countries (Romer, 1944). Furthermore, the theory of technological innovation and its destructive and transformative content of society and the market was at the center of the pioneering work of the Austrian economist Schumpeter in his analysis of the evolutionary dynamics of capitalism (Schumpeter, 1934). Furthermore, the development of technological innovation requires the existence of rules, institutions and laws that can mediate among the attribution of monopoly power to patent holders, the economic-financial recognition of inventors, and the use of technological innovations to produce new products and services (Boldrin & Levine, 2002). Using data from the Global Innovation Index, (Reich, et al., 2018) estimate the value of the return on investment at the company level. (Samoilikova, 2020) analyze the determinants of the Innovation Index with reference to Ukraine and show how R&D expenditure as a percentage of GDP, the presence of public and private funding, together with an efficient regulatory system are positively associated with the growth of innovation at country level. (Sener & Delican, 2019 ) put together a composite dataset of 31 developed and 26 developing countries to analyze the relationship between innovation, competitiveness, and export. The results show that there is a one-way causation from export to innovation and from innovation to competitiveness for developing countries. (?tefan, 2021) criticizes the system for detecting technological innovation in production organizations and proposes its own calculation method based on a questionnaire submitted to bank employees by building a new indicator called the "Composite Innovation Index". Applying this method to the banking system, the author shows that the degree of innovation of the Romanian credit system tends to be lower than the country's average. (AlQararah, 2022) introduce a PCA-DEA model with application of Random Forests-RF algorithms to evaluate the efficiency of economic innovation policies based on the scores of the Global Innovation Index.
(Bacon, et al., 2019) use clustering methods, Bayesian Neural Networks, and correlation analysis to develop predictions relating to the level of national innovation through machine learning. (Bukreieva, 2020) analyzes the economic policies that can lead to the growth of a country in terms of technological innovation by taking the case of Ukraine. The results show that for technological innovation to become a driver for the country's economic growth, it is necessary to invest in research and development and in a regulatory and institutional framework capable of supporting intangible capital in the long term. (Roszko-Wójtowicz & Bia?ek, 2018) analyze the limits of a set of indicators of the performance of European countries in terms of technological innovation, demonstrating how indeed there are significant differences in the ranking of countries based on the chosen criteria. Hence the need to deepen the meaning of each indicator in the conceptual map of European countries by level of technological innovation. (Nomani & Hussain, 2020) analyze the case of technological development in India with reference to medical devices. India ranks 60th in the Global Innovation Index and imports 75% of medical devices. The authors highlight the role of technological innovation in the healthcare sector as a strategic tool for positioning growth in the Global Innovation Index. (Janoskova & Kral, 2019) analyze the determinants of technological innovation in Slovakia, Hungary, Poland, and the Czech Republic in the period 2010-2016 with the aim of developing specific long-term development strategies of national innovation systems. (Omer, et al., 2020) analyze the phenomenon of emerging technological innovation in Africa using data from the Global Innovation Index and focusing on African Innovation Performance. (Stavbunik & Pelucha, 2019) consider the Global Innovation Index in the case of Kazakhstan. The authors stress that it is not possible for a country to grow from a socio-economic point of view without investing in technological innovations. (Dotta & Munyo, 2019) find a positive relationship between opening to international trade and investing in technological innovation at the country level. This relationship is particularly significant in emerging countries. The authors suggest that opening to international trade is a tool for enhancing technological innovation. (Khan & Cox, 2017) analyze the relationship between the Global Innovation Index and Hofstede's 6 dimensions. The result shows that the most innovative countries are also characterized by the following elements: individualism, low masculinity, pragmatism, and indulgence. However, innovation may also depend on the types of entrepreneurs who are present at the country level. (Harsono & Fitri, 2020) analyzed the differences between Start Up and Small and Medium Enterprises using the Berkley Innovation Index-BII. The results show that from a motivational point of view, while Small and Medium Enterprises tend to believe in technological innovation, Start Ups are characterized by greater resilience. (Andabaka, et al., 2019) highlight the connection between technological innovation and the green economy in the 28 countries of the European Union. The authors use econometric tools and verify the presence of a positive relationship between the eco-innovation index, the GDP, the quality of the institution and the recycling rate of urban waste.
Furthermore, the innovation index at country level also depends from:
• Design applications (Laureti, et al., 2022);
• Corporate innovation (Costantiello, et al., 2022);
• Innovation linkages (Costantiello, et al., 2022);
• Sales impacts (Costantiello, et al., 2022);
• Broadband penetration (Leogrande, et al., 2021);
• Foreign doctorate students (Laureti, et al., 2022);
• Enterprises providing ICT training (Laureti, et al., 2022);
• Employment in innovative enterprises (Laureti, et al., 2022)
• Financial support to innovation and Research and Development (Laureti, et al., 2021);
• The ability of SMEs to innovate (Costantiello, et al., 2021);
• The level of employment in high innovative sectors (Costantiello & Leogrande, 2020);
• The intellectual assets (Costantiello, et al., 2021);
• The presence of an innovation-friendly environment (Costantiello, et al., 2021);
• Human resources (Leogrande & Costantiello, 2021);
• Venture capital (Leogrande, et al., 2021).
As demonstrated in the literature reported, technological innovation is a tool through which countries try to become more competitive, produce more and have a growth in gross domestic product. However, technological innovation is a complex tool as it requires investment in human capital, in regulatory and control institutions and an entrepreneurial capital capable of taking risks in the production of new products and services. However, there is no doubt that it is in the challenge to technological innovation that a significant part of the prosperity of nations and of global economic-political hegemony resides.
The Econometric Model
We have estimated the following econometric model:
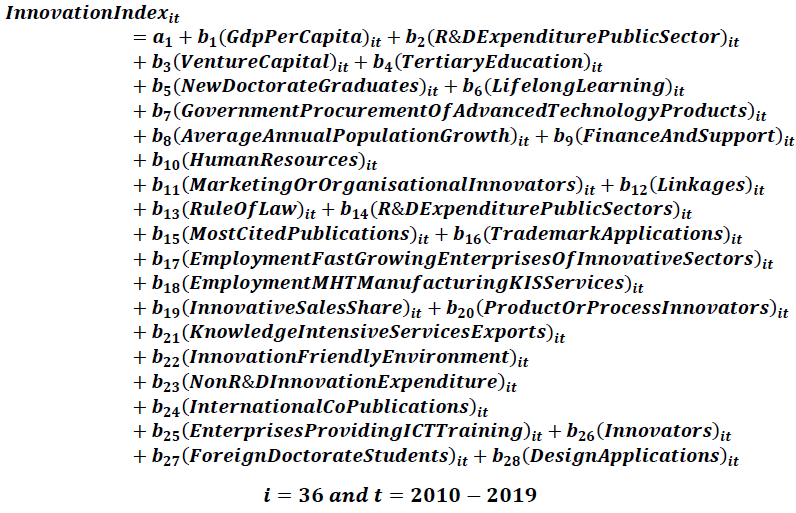
The value of the innovation index is negatively associated with the following variables:
GDP per capita: There is a negative relationship between per capita income and the value of the innovation index. This relationship indicates that if increasing per capita income does not necessarily increase the value of the innovation index. However, this negative relationship needs to be further investigated as it turns out to be counterfactual. In fact, economic theory generally establishes that the growth of gross domestic product is essentially connected with the growth of investment in technological innovation. In this case then we consider the relationship between innovation index and per capita GDP of the top 10 European countries by gross domestic product per capita with the relationship between gross domestic product per capita and innovation index of the total countries considered in the database. It appears that for the top 10 countries for per capita income.

Figure 1: Relationship Between Innovation Index And Gdp Per Capita For The Top Ten Countries For Gdp And The Relationship Between Innovation Index And Gdp Per Capital For All Other Countries Different From The Top 10 Countries For Gdp Per Capita.
there is a negative relationship between the innovation index and the per capita GDP according to the equation: y = -0,2463x + 148,41. On the contrary, the relationship between the innovation index and the per capita income of all other European countries with the exclusion of the top 10 countries is equal to an amount of y = 4,0026x - 4,3611. It therefore follows that there is indeed a negative relationship between the value of the innovation index and per capita income, especially if we consider the European countries with higher added value. It follows therefore that at the aggregate level the effect of the negative relationship between innovation index and GDP per capita for the higher-income countries tends to overcome the effect of the positive relationship between the innovation index and GDP per capita for the low-income bases. Such empirical observation can be very useful for modifying economic theories of economic development that are based on technological innovation. In fact, the positive relationship between technological innovation and per capita income exists only for low and medium-low levels of per capita income and tends to become negative with the growth of per capita income towards the upper part of the distribution (Figure 1).
R&D expenditure public sector: it is a variable that considers public sector and higher education R&D expenditure. Generally, investment in research and development in the public sector is an essential element of economic growth and of the sustenance of innovation at the country level. In general, countries that invest the most in research and development tend to be more competitive and more productive. Furthermore, the countries that invest more in research and development also can invest in new products and services that can also be exported and therefore generate a positive effect in terms of international positioning. The very possibility of achieving a knowledge economy is based on the growth of investment in research and development. However, it must be considered that there is a negative relationship between the value of research and development in the public sector and the value of the innovation index. This relationship may seem counterfactual, but it must be considered that countries that have a high level of innovation index tend to finance research through private funds rather than public funds. It follows that the countries that need state intervention in research and development are those that also have a generally lower level of innovation index. In fact, countries that have a low level of innovation index also have inefficient private financial systems which therefore fail to support innovations with startups, spin offs and newco (Figure 2).

Figure 2:Relationship Between Innovation Index And R&D Expenditures Public Sector For Top 5 Countries.
Venture capital expenditures: it is a variable that considers risk capital expenditure as a percentage of GDP. Venture capital expenditure is the set of private equity purchases. The category also includes investments in the risk capital of unlisted companies and refers above all to start-ups. Venture capital is an indicator of the dynamism of the private sector in funding research and development and investing in the riskiest technologies in terms of industrialization. There is a negative relationship between the value of the innovation index and the value of the venture capital expenditure variable. This negative relationship can be understood considering that many of the European countries considered, including also medium-large countries such as Italy and Spain, have a little or no developed venture capital sector. It follows that, except for the UK and countries that have an advanced financial culture, most European countries have a financial system that prevents private individuals from taking on the risks of technological innovation through investment in venture capital.
Tertiary education: is a variable that considers the percentage of the population that between the ages of 25 and 34 has completed tertiary education. There is a negative relationship between the value of the innovation index and the percentage of the population between 25 and 34 who have a tertiary education. There is a negative relationship between the value of the innovation index and tertiary education. This relationship appears to be counterfactual. Indeed, human capital is needed to generate technological innovation. However, it should also be considered that a significant part of technological innovation and research and development is carried out by countries that have the capacity to import skilled human capital. This is the case, for example, of PhDs who are trained in countries with a low capacity for technological innovation - such as Italy for example - who emigrate to countries with high technological innovation - such as the UK or Germany. It follows therefore that many countries manage to acquire an additional skilled workforce deriving from the international movements of human capital due to the idiosyncrasies of the European labor market.
New doctorate graduates: is a variable that considers the new research doctorates per 1000 inhabitants between the ages of 25 and 34. The indicator considers the offer of tertiary education at the country level. The analysis carried out shows the presence of a negative relationship between the value of the innovation index and the number of doctorates at national level. This relationship also appears to be counterfactual. In fact, in standard economic theory the number of doctoral students - intended as a synthetic element of the quality of human capital - is considered as a positively connected variable with respect to technological innovation and research and development. However, as relevant as PhDs are, the analysis shows that, yet another new PhD does not generate growth in the innovation index. Obviously, although human capital is relevant, it is not sufficient to generate a competitive innovation system. In fact, other elements are also necessary, such as those connected to financial and technological capital and to the quality of institutions, which together with human capital can generate a country's growth at the level of innovation index.
Lifelong learning: is the percentage of the population aged 25 to 64 participating in lifelong learning. Lifelong learning therefore includes all cognitive learning activities, both implicit and explicit. Sports activities are not part of lifelong learning. Also, in this case the negative relationship between the innovation index and the lifelong learning turned out to be counterfactual. In fact, it would have been legitimated to expect a growth in the innovation index in connection with a growth in lifelong learning. Instead, the multivariate regression carried out highlights the presence of a negative relationship between the innovation index and the value of lifelong learning. Also in this case, as in the previous one, it is necessary to consider that although human capital is relevant for the production of technological innovation and a knowledge society, it is also necessary that other endowments of capital are also present, such as financial capital. , the social capital and also the necessary institutions.
The value of the innovation index is positively associated with the following variables
Government procurement of advanced technology products: is a variable that considers the value of public procurement of advanced technological products. That is, the indicator takes into consideration the role of public procurement to have an impact in terms of technological innovation. In fact, the government can be a buyer of high-tech products by creating a demand for technological products and services that can stimulate the growth of the sector of technological innovation and research and development applied to industry. The econometric analysis proposed shows the presence of a positive relationship between the value of the innovation index and the value of public procurement of advanced technological products. This report highlights the role of the state as the client of technological innovation. In fact, public institutions, for the purposes that are their own, and which refer to the needs of the administration, can ask companies to offer advanced services by improving the quality of services to the population and increasing the degree of innovativeness of citizens in their relations with the public administration (Figure 3).

Figure 3:Relationship Between Innovation Index And Government Procurement Of Advanced Technology In 2021 For 36 European Countries. Source: Eis.
Average annual population growth: is a variable that measures the growth rate of the population. There is a positive relationship between the value of the innovation index and the value of the population growth rate. This relationship may appear meaningless since population growth is generally a variable that is positively associated with the variables of economic growth only in developing countries and certainly not in economies positively oriented towards technological innovation. However, it must be considered that most of the countries in Europe that have high levels of technological innovation also have positive trends in terms of population. Both the countries that are innovation leaders or Norway, Finland, Belgium and Switzerland, and the countries that are strong innovators such as Germany, France and the United Kingdom have growing demographic trends. It is necessary to consider that these countries have the possibility of growing at a demographic level also due to the opportunities in terms of economic growth that technological innovation offers to immigrants who often also have high qualifications(Figure 4).

Figure 4:Relationship Between Innovation Index And Average Population Growth In 2021 For 36 European Countries. Source: eis.
Finance and support: is a composite variable consisting of two elements, namely Venture Capital investment and government support for research and development spending. There is a positive relationship between the value of technological innovation and the value of Finance and Support. Specifically, the countries that invest more in financial research both through venture capital instruments and using public finance have higher levels of innovation index. University to invest in research and development and technological innovation depends significantly on the possibility of having sufficient financial resources to support knowledge accumulation activities. In fact, patents, product innovations, and new services require an investment phase that also has a significant value in terms of risk. Where these risks are financially supported by public and private entities, there is also a greater possibility of having more relevant outputs in terms of technological innovation at the country level (Figure 5).

Figure 5:Relationship Between Innovation Index And Government Procurement Of Advanced Technology In 2021 For 36 European Countries. Source: Eis.
Human resources: is a composite variable made up of three sub variables which are "New Doctorate Graduates", "Population Aged 25-34 with Tertiary Education", "Lifelong Learning". There is therefore a positive relationship between the value of human resources and the innovation index at European level. This positive relationship is consistent with the classical economic theory of economic growth which postulates the role of human capital as an essential determinant for technological innovation. Human capital is the essential element in the knowledge economy and the information economy. In fact, if on the one hand the previous forms of capitalism needed to invest significantly in physical and material assets such as plants and infrastructures, on the other hand, knowledge capitalism requires a significant investment in human capital. However, human capital is also the product of efficient educational institutions and a level of per capita income that is such as to free the population from the burden of carrying out physical or manual labor. Qualified human capital is therefore the clearest representation of an evolved economic system that can therefore afford to accumulate intangible assets together with material assets(Figure 6).

Figure 6: Relationship Between Innovation Index And Human Resources For 36 European Countries In 2021. Source: European Innovation Scoreboard.
Marketing or organisational innovators: it is an indicator that considers the percentage of small and medium-sized enterprises that produce marketing or organizational innovations. For organizational innovation, the European Innovation Scoreboard considers new organizational methods of a company that concern both work, knowledge management and those that are the external relations of a company. By marketing innovation, on the other hand, we mean a new strategy for organizing relations with customers that has not been used previously. Such innovations cannot be considered as technological innovations in the strict sense. However, there is no doubt that a company seeking marketing or organizational innovation manifests an openness to innovation which could also lead to further and subsequent technological innovation. For technological innovation to flourish within a country, it is not only necessary to invest in "hard" forms of innovation such as those related to Research and Development, for example, but also to consider weak forms of innovation such as those of an organizational or organizational type. marketing. In fact, both forms of innovation, both the hard and the weak ones, contribute to the creation of that complex economic system aimed at technological innovation which constitutes the essential element of the knowledge, innovation, and information economy(Figure 7).

Figure 7: Relationship Between The Innovation Index And Linkages For The European Countries In 2021. Source: European Innovation Scoreboard.
Linkages: is a variable that brings together three sub-variables, namely "Innovative SMEs collaborating with others", "Public Private co-publications", "Private co-funding of public R&D expenditures". This indicator therefore highlights the "cooperative" aspects of the innovation economy at the country level within the European Union. It calculates the capacity of small and medium-sized enterprises to collaborate with each other, and the capacity of the public and private sector to cooperate both in financing scientific research and in scientific publications. There is therefore a positive relationship between the value of the innovation index and the value of "Linkages" at the European level. This positive relationship indicates the positive impact that the creation of relational and cooperative structures has within the promotion of technological innovation. In fact, for a country to flourish in technological innovation, it is necessary to prepare a complex set of interactions, companies, institutions, and human capital so that there is an environment that is "culturally" favorable to technological innovation. It therefore follows those exchanges between companies and between the public and private sectors strengthen awareness of the role and functions of technological innovation, with positive outputs in terms of research and development, and of products and services.
Rule of law: it is a variable that captures perceptions of the extent to which agents trust and respect the rules of the company, and in particular the quality of the execution of contracts, property rights, the police, and the courts, as well as the likelihood of crime and violence. There is therefore a positive relationship between the value of the innovation index and the value of the Rule of Law. This relationship is not surprising as it is perfectly consistent with the theory that considers legal systems as an essential element for capitalist production and for the accumulation of income and wealth. Obviously, the law, especially if understood as an institution that protects and defends bargaining, is necessary to ensure that market operators can develop the trust that is the essential element of commercial exchange. Thus, also the legal order understood in the sense of the police order is essential for bargaining. In fact, where there are crimes against people and against heritage, economic activity generally also tends to be threatened and therefore the social and cultural context that leads to the creation of innovative entrepreneurship disappears. It therefore follows that a country that will have the ability to develop a more efficient legal system, where property rights are respected, where crime is very low, will also attract new investments and develop the human capital necessary to guide the economy to technological innovation (Figure 8).

Figure 8: Relationship Between Innovation Index And Rule Of Law For European Countries In The 2021. Source: European Innovation Scoreboard.
R&D expenditure business sector: is a variable that takes into account R&D expenditure in the business sector with respect to gross domestic product. It therefore measures business expenditure on research and development as a percentage of GDP on a national basis. This indicator considers the formal creation of new knowledge within companies, especially in those companies in which there is a relevant scientific aspect, such as the pharmaceutical, chemical and electronic sectors. Obviously, this indicator does not capture all the technological innovation that is generated within companies. In fact, not all technological innovation is generated in relation to research and development. There are forms of technological innovation, such as process innovations, which do not necessarily require the aid of an internal research and development system. Therefore, it is very likely that this variable, however close to the expenditure that companies make in terms of technological innovation, is in any case an underestimate. There is obviously a positive relationship between the value of research and development spending on a local basis and the value of the innovation index at a European level. In other words, the innovation index is positively affected by the investment of companies in research and development. In fact, many of the technological innovations are generated by the private sector thanks to investment in research and development(Figure 9).

Figure 9:The Relationship Between Innovation Index And The R&D Expenditure In The Business Sector. Source: Eis.
Most-cited publications: is a variable that takes the top 10 publications cited worldwide as a reference point as a percentage of the scientific publications produced in the country. This indicator is considered to represent the quality of scientific research at the country level. There is a positive relationship between the value of the most cited scientific publications and the value of the innovation index. Obviously, countries that also have more advanced research systems, i.e. that are leaders in scientific research are also leaders in technological innovation. However, in this sense it must be considered that not necessarily all relevant scientific works are present in the top 10% of the most cited publications. In fact, the opposite is often the case. True innovative scientific research often does not find space in the most renowned scientific journals, and very often the research centers that also have a capacity for producing technological innovation do not have the financial capacity to be able to invest in the expensive scientific publications of the most cited international journals. It therefore follows that this indicator, although it is certainly capable of capturing the innovative elements of research and development that appear at the top of the innovation index, is not equally capable of showing the great vitalism of many universities and research centers which are unable - for financial, relational and / or geographic reasons - to publish in the top scientific journals at an international level(Figure 10).

Figure 10:Relationship Between Innovation Index And Scientific Publication Among The Top 10% Most Cited. Source: European Innovation Scoreboard
Trademark applications: is a variable that considers trademark applications in terms of billions of GDP. It is therefore a variable consisting of the ratio between the number of trademark applications filed with the European Union plus the number of applications from the World Intellectual Property Office and the gross internal product in terms of purchasing power. This indicator is representative of the degree of innovation in the service sector. Brands offer a set of information advantages as they show the company's orientation towards innovation, constitute a form of communication, and finally also perform an advertising function. There is therefore a positive relationship between the value of the innovation index and the value of brand applications. This relationship indicates that the countries in which there is a greater production of brands there is also a greater generalized orientation towards technological innovation. However, in this regard it should be considered that not all countries have a legal system that easily allows trademarks to be registered. Furthermore, not all companies, especially in countries where there is a lower level of innovation index, have an interest in investing in the recognition of brands. In fact, for a company to be able to effectively use brands, it must also have a reference market and of such dimensions as to be able to appeal to its consumers. It is difficult for small and medium-sized businesses to use brands to improve their business and customer relationships(Figure 11).

Figure 11:Relationship Between Innovation Index And Trademark Application For European Countries In 2021. Source: European Innovation Scoreboard.
Employment fast-growing enterprises of innovative sectors: is a variable that considers the value of employment in companies that grow rapidly as a percentage of the total value of employment. The companies that are considered are the most innovative both in the primary and secondary sectors and in the tertiary sector. This indicator considers the ability to ask for employment in the most dynamic companies from the point of view of technological innovation. There is therefore a positive relationship between the value of the innovation index and highly innovative companies. However, it must be considered that, especially in the manufacturing sector, it is possible that a growth in technological innovation may be determined in connection with a reduction in unemployment, since automation could significantly reduce employment even in high-tech companies. In the future, therefore, the relationship between technological innovation and high-tech companies could be confirmed even if the employment impact of technological innovation could be decreasing.
Employment MHT manufacturing KIS services: is an indicator that considers the value of firms employing people employed in knowledge-intensive activities. 33% of the employed have a tertiary education qualification. There is a positive relationship between the value of the innovation index and the number of companies that employ employees with a high level of professional skills. This relationship may appear obvious and banal due to the fact that the ability to innovate significantly depends on the human capital that is employed. However, it must be considered that the possibility of increasing the relationship between the value of technological innovation and the value of human capital is not indifferent to the presence of the reference institutions. In fact, where there is also a medium-high quality human capital and yet there is an absence of adequate institutions, there is a less than proportional relationship between an increase in human capital and an increase in technological innovation. In fact, human capital cannot be used effectively if there are not sufficiently large companies and institutions that are able to facilitate the growth of companies.
Innovative sales share: is a value that takes into consideration the value of the turnover that comes from new or improved products as a percentage of the total turnover of all companies. The indicator considers the ability to make a turnover through new products. The analysis shows that there is a positive relationship between the value of the innovation index and the value of the turnover deriving from technological innovation. As a result, countries with a greater orientation towards innovation also have a chance to sell more innovative products and services. However, there is also a relevant element concerning the consumer dimension. In fact, consumers in the most innovative countries have a higher degree of innovativeness and are therefore more receptive to companies that offer innovative products and services. In fact, in countries where the innovation index is lower there is also greater difficulty in using the innovative products and services that are offered by companies
Product or process innovators: is a variable that calculates the value of SMEs that introduce product or process innovations. Product innovation consists in creating a product that is significantly improved in terms of performance, use and components. Process innovation, on the other hand, concerns production methodologies with the introduction of innovations that reduce production costs generally by replacing routine jobs with the mix of machine learning and artificial intelligence algorithms. Obviously, companies that can innovate from the point of view of products or even services also have a greater chance of opening new markets, earning more and retaining customers. However, it should be considered that generally product innovations tend to be superior to process innovations in terms of employment and gross domestic product repercussions. In fact, while in the case of product innovations the firm creates new products and new services generating employment, in the case of process innovations the firm replaces the routine worker with algorithms and new production methods. Therefore, in qualitative-quantitative terms, an economic system is certainly preferable in which companies propose product innovations compared to companies that carry out process innovations.
Knowledge-intensive services exports: considers the value of exports of knowledge-intensive services as a percentage of total exports of services. Exports of high-intensity services are considered in a set of sectors including those of logistics and transport, financial sector, telecommunications. Exports of knowledge-intensive services measure firms' ability to be competitive. There is therefore a high interest on the part of countries in setting up companies that export highly knowledgeable services to obtain competitive advantages in terms of employment. It follows that therefore there is a positive relationship between the value of technological innovation and the value of exports of services with a high level of knowledge. Therefore, if countries want to increase their innovation index, they must also ensure that companies are created capable of generating added value through high-tech exports(Figure 12).

Figure 12:Relationship Between Innovation Index And Knowledge Intensive Services Exports In European Countries In 2021. Source: Eis
Innovation-friendly environment: is a variable made up of the sum of two different variables, namely: broadband penetration and opportunities for entrepreneurship due to technological innovation. It therefore follows that the value of technological innovation is positively connected with the value of the innovation friendly environment. This relationship implies that technological innovation essentially depends on a set of elements that do not only concern the size of the company but also refer to the overall condition of the social and technological context in which the company is inserted. It follows therefore that if a country wants to increase its innovation index, then it must also invest in the physical infrastructure of the internet and in the ability of companies to do business with technology. Indeed, countries often lack the digital infrastructure needed to support technological innovation. Furthermore, it often occurs that even in countries that have the possibility of carrying out significant technological innovations, there is no business context capable of using these innovations to create new productive enterprises. It follows therefore that the generalized digital context and the presence of entrepreneurs able to grasp the business content of technological innovation are two essential elements in determining the path of the innovation index at a European level.
Non-R&D innovation expenditure: is a variable that considers the expenses for technological innovation that do not constitute research and development in percentage terms of turnover. This value takes into consideration the cost of technological innovation, both intramural and extramural, with the exclusion of research and development costs as a percentage of turnover. This indicator includes a set of values such as investments in equipment, machinery and the acquisition of patents and licenses. There is therefore a positive relationship between the innovation index and the value of enterprises' expenditure on technological innovation. However, it should be emphasized that not all companies have an interest and opportunity to invest in technological innovation if they do not have the possibility of referring to a market that is receptive to new products and new services. It follows that it is the countries that have the most advanced consumers and markets that also offer incentives to invest in technological innovation to make further profits(Figure 13).

Figure 13:The Relationship Between Innovation Index And Non-R&D Innovation Expenditures In European Countries. Source: Eis.
International co-publications: is an indicator that considers international scientific co-publications. Co-publications are representative of the quality and productivity of scientific research. There is a positive relationship between the innovation index and the value of international scientific co-publications. This positive relationship may be essentially since international scientific co-publications generally refer to the presence of international scientific projects involving various researchers, research institutes and universities. In this regard, it must be considered that this variable is nevertheless very present especially in Northern European countries which have a higher degree of integration and where researchers have greater knowledge of the international research system. In the countries of Southern and Eastern Europe, both due to the lack of human capital and to the low internationalization of research, there may be a lower level of international co-publications.
Enterprises providing ICT training: consider the number of companies offering IT training to their employees. Technological innovations are typically associated with the development of IT skills as these are connected to the digital economy. For this reason, the companies that are more active tend to invest significantly in the training of their employees by increasing their digital and IT skills both with vocational courses and with partnerships with organizations and institutes that deal with the training of workers. Since the knowledge economy has an essential component in competences and skills, it follows that the very ability of companies to compete depends on the increase in the qualitative value of the human capital employed in production processes, especially in the service sector connected to the intangible economy. In this sense, the most innovative companies tend to select their employees also based on their ability to learn new skills and new competences.
Innovators: is a variable made up of three different variables: "SMEs with product of process innovations", "SMEs with marketing or organisational innovations", "SMEs innovating in-house". This variable takes into consideration the set of companies that carry out technological, marketing, or organizational innovation activities. There is a positive relationship between the value of the innovation index and the value of the "Innovators" variable. Obviously, if companies can innovate in their products, in their processes, and in customer relations, they also can actively participate in the innovation index calculated at country level. However, it should be borne in mind that not all companies can invest in innovation both because there are dimensional limits, and for reasons related to human capital and the innovativeness of consumers. In fact, some companies operating in very traditional markets have a low degree of innovation also because it is the consumers themselves who are reluctant to accept product or marketing innovations.
Foreign doctorate students: it is a variable that considers the percentage of foreign doctoral students out of the total number of doctoral students. the most innovative countries are also able to attract a higher number of foreign doctoral students. There is a positive relationship between the degree of innovation index and the value of foreign PhD students. Obviously, this value is since many countries that are innovation leaders in Northern Europe also have PhD programs that are open to international students, also offering them suitable scholarships. It is therefore necessary to consider that the ability of a country to attract PhD students who come from abroad depends significantly on the ability to prepare financial instruments, courses of study in English, and lasting international relations that can generate a constant flow. of foreign PhD students in the country concerned. In this regard, the European Union could carry out funded PhD projects for foreigners to ensure that even in countries that are not innovation leaders, there are results in terms of internationalization.
Design applications: it is a variable that considers the number of design applications per billion of GDP divided by the value of GDP by purchasing power. Design constitutes a dimension that enhances the products that come to be made. Through design it is possible to improve the appearance of innovative products, and in many cases the innovative value of a product is precisely constituted by the design. There is a positive relationship between the value of the innovation index and the value of the design application in European countries. It should be borne in mind that design is generally associated with product and service innovations. Since product innovation is often the most relevant part of technological innovation, it follows that the design application value is significantly and positively associated with the value of the innovation index calculated at national level. However, to increase the value of the design application it is necessary that companies have the adequate human capital to be able to improve their products from the design point of view(Table 1).
| Estimation of the Innovation Index in Europe | ||||||||||||
|---|---|---|---|---|---|---|---|---|---|---|---|---|
| Variables | Panel data | Pooled OLS | Fixed Effects | Random Effects | WLS | Mean | ||||||
| Label | const | 0,202675 | 0,0433284 | -0,133559 | -0,0921587 | 0,0329903 | 0,01066 | |||||
| A3 | Average annual population growth | 1,53922 | *** | 0,678653 | * | 1,15866 | *** | 1,00403 | *** | 0,713323 | *** | 1,01878 |
| A7 | Design applications | 0,0395124 | *** | 0,0130459 | ** | 0,0278575 | *** | 0,0212433 | *** | 0,0145029 | *** | 0,02323 |
| A9 | Employment fast-growing enterprises of innovative sectors | 0,0455434 | *** | 0,0528053 | *** | 0,0519717 | *** | 0,0534101 | *** | 0,0518442 | *** | 0,05111 |
| A11 | Employment MHT manufacturing KIS services | 0,0424438 | *** | 0,0502201 | *** | 0,0431201 | *** | 0,0437713 | *** | 0,0585374 | *** | 0,04762 |
| A15 | Enterprises providing ICT training | 0,0336792 | *** | 0,024678 | *** | 0,0300189 | *** | 0,0272909 | *** | 0,0210404 | *** | 0,02734 |
| A17 | Finance and support | 0,332687 | *** | 0,26583 | *** | 0,273552 | *** | 0,269952 | *** | 0,264648 | *** | 0,28133 |
| A19 | Foreign doctorate students | 0,0178313 | ** | 0,0177277 | *** | 0,0193724 | *** | 0,0181887 | *** | 0,0172043 | *** | 0,01806 |
| A21 | GDP per capita (Thousands of €) | -0,146768 | *** | -0,120709 | *** | -0,136785 | *** | -0,133542 | *** | -0,116457 | *** | -0,1309 |
| A22 | Government procurement of advanced technology products | 1,03721 | *** | 1,06179 | *** | 1,04315 | *** | 1,05716 | *** | 1,04464 | *** | 1,04879 |
| A23 | Human resources | 0,26223 | *** | 0,166216 | *** | 0,204146 | *** | 0,194849 | *** | 0,145546 | *** | 0,1946 |
| A25 | Innovation-friendly environment | 0,0393198 | *** | 0,0369538 | *** | 0,0417096 | *** | 0,0388992 | *** | 0,0401796 | *** | 0,03941 |
| A26 | Innovative sales share | 0,0451788 | *** | 0,0481567 | *** | 0,0482743 | *** | 0,0485911 | *** | 0,0486647 | *** | 0,04777 |
| A28 | Innovators | 0,0568503 | *** | 0,0219401 | *** | 0,0294458 | ** | 0,026439 | *** | 0,0392248 | *** | 0,03478 |
| A30 | International co-publications | 0,031608 | *** | 0,0250155 | *** | 0,0335392 | *** | 0,0307684 | *** | 0,0185735 | *** | 0,0279 |
| A31 | Knowledge-intensive services exports | 0,0309797 | ** | 0,0389279 | *** | 0,0258262 | ** | 0,0323188 | *** | 0,037924 | *** | 0,0332 |
| A32 | Lifelong learning | -0,0537332 | *** | -0,027111 | *** | -0,0456562 | *** | -0,038903 | *** | -0,020621 | *** | -0,0372 |
| A33 | Linkages | 0,121945 | *** | 0,103583 | *** | 0,112306 | *** | 0,106169 | *** | 0,105862 | *** | 0,10997 |
| A34 | Marketing or organisational innovators | 0,0833946 | *** | 0,107235 | *** | 0,0915801 | *** | 0,0970707 | *** | 0,0986837 | *** | 0,09559 |
| A36 | Most-cited publications | 0,0916326 | *** | 0,0701824 | *** | 0,0861074 | *** | 0,0791031 | *** | 0,062949 | *** | 0,07799 |
| A37 | New doctorate graduates | -0,0730159 | *** | -0,034662 | *** | -0,0484236 | *** | -0,044177 | *** | -0,025548 | *** | -0,0452 |
| A38 | Non-R&D innovation expenditure | 0,0190378 | *** | 0,0307581 | *** | 0,0264612 | *** | 0,0290613 | *** | 0,0246221 | *** | 0,02599 |
| A44 | Product or process innovators | 0,0316008 | ** | 0,0397638 | *** | 0,0478161 | *** | 0,0463457 | *** | 0,0332703 | *** | 0,03976 |
| A46 | R&D expenditure business sector | 0,0607867 | *** | 0,0717536 | *** | 0,0620442 | *** | 0,0655992 | *** | 0,075149 | *** | 0,06707 |
| A47 | R&D expenditure public sector | -0,146466 | *** | -0,084814 | *** | -0,101336 | *** | -0,0943825 | *** | -0,08344 | *** | -0,1021 |
| A48 | Rule of law | 0,0924321 | *** | 0,0802648 | *** | 0,078511 | *** | 0,0815436 | *** | 0,0771517 | *** | 0,08198 |
| A53 | Tertiary education | -0,0750842 | *** | -0,041961 | *** | -0,0569552 | *** | -0,0521181 | *** | -0,03179 | *** | -0,0516 |
| A56 | Trademark applications | 0,048955 | *** | 0,0629517 | *** | 0,0608313 | *** | 0,0614595 | *** | 0,0644115 | *** | 0,05972 |
| A59 | Venture capital | -0,102495 | *** | -0,067123 | *** | -0,0737003 | *** | -0,0701719 | *** | -0,066129 | *** | -0,0759 |
| A24(-1) | Innovation Index | -0,00707884 | -0,0071 | |||||||||
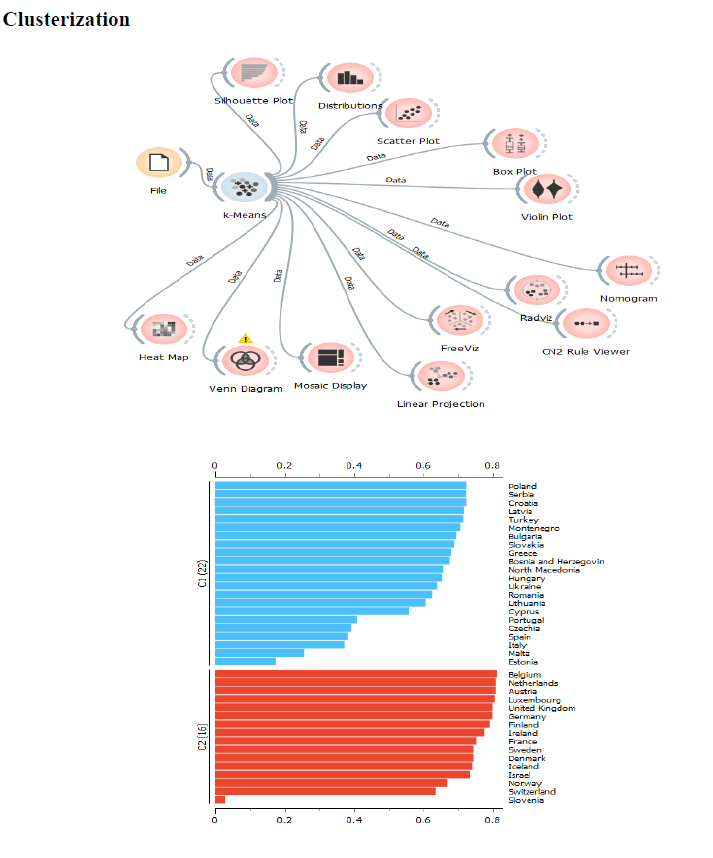
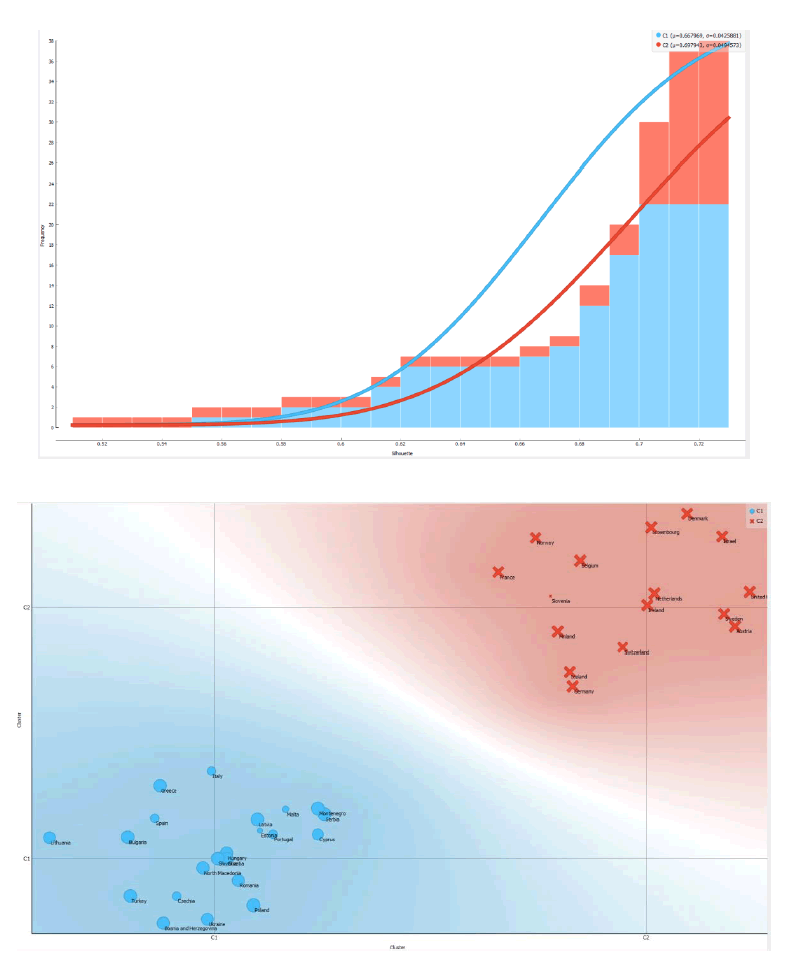
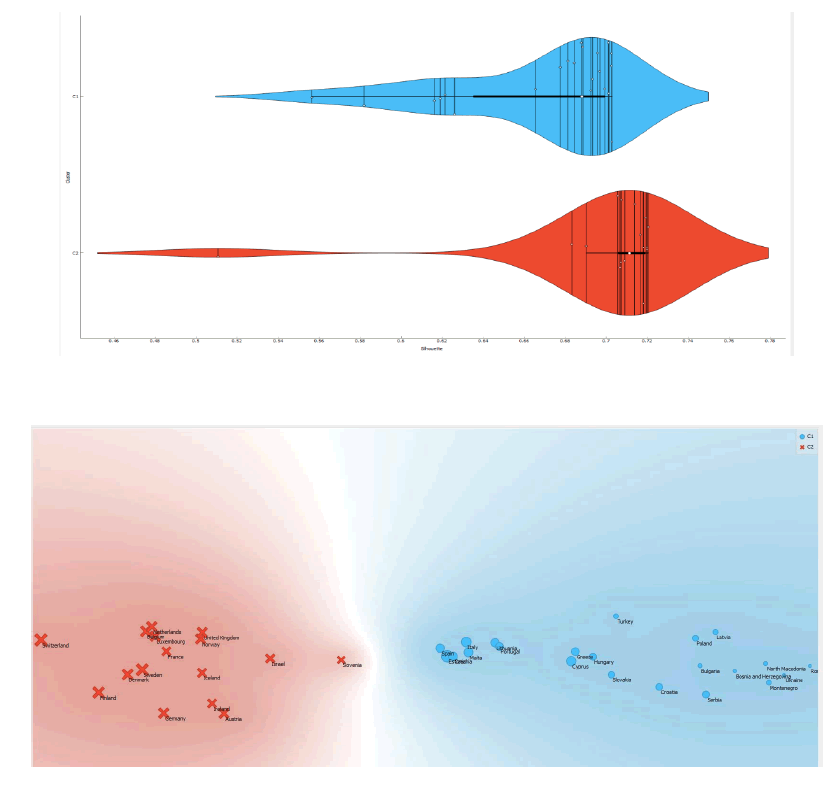
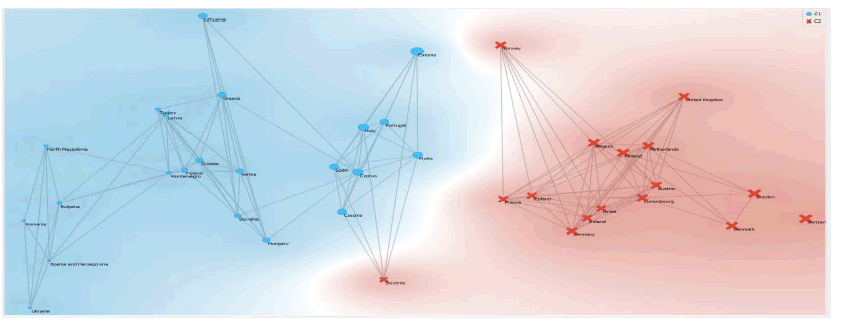
Clusterization
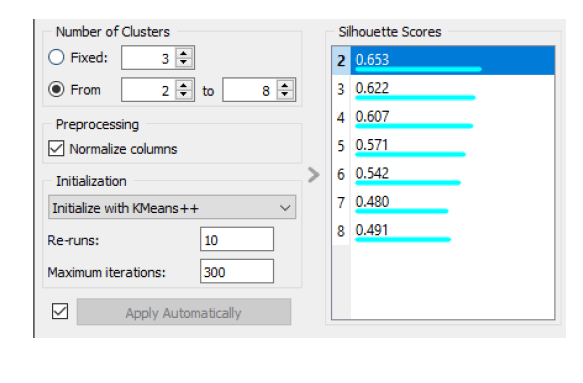
A clustering model is proposed below to identify groupings between European countries in terms of innovation index. The algorithm that is used for clustering is k-Means. However, the Silhouette coefficient is used to choose the optimal number of clusters. The Silhouette coefficient varies between -1 and 1. The preferred cluster in the sense of the Silhouette coefficient is the one with the value closest to 1. In the case analyzed, this value is associated with a 2-clusters model.
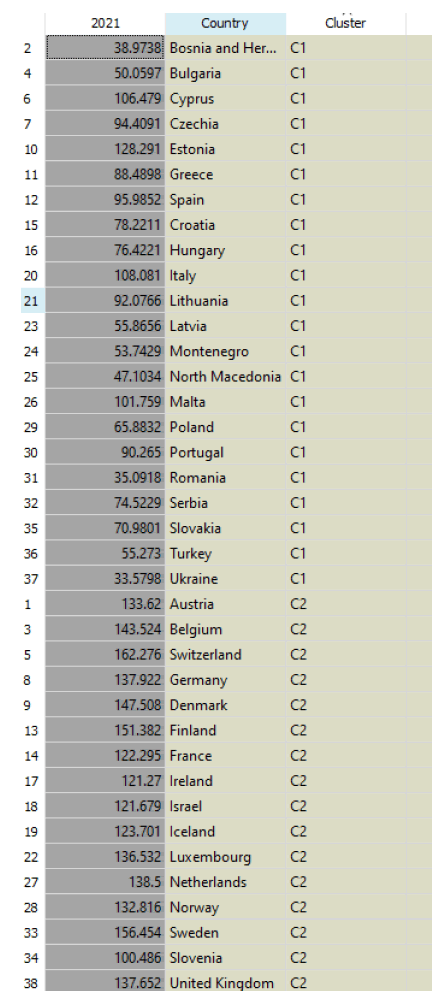
• Cluster 1: Poland, Serbia, Croatia, Latvia, Turkey, Montenegro, Bulgaria, Slovakia, Greece, Bosnia, North Macedonia, Hungary, Ukraine, Romania, Lithuania, Cyprus, Portugal, Czechia, Spain, Italy, Malta, Estonia;
• Cluster 2: Belgium, Netherlands, Austria, Luxembourg, United Kingdom, Germany, Finland, Ireland, France, Sweden, Denmark, Iceland, Israel, Norway, Switzerland, Slovenia.
Comparing the two clusters in terms of the median value of the innovation index, it results that the amount of the value of the countries of cluster 1 C1 is equal to 75.47, while the corresponding value of cluster 2-C2 is equal to an amount of 137.092. Therefore, the following ordering of clusters derives, namely: C2> C1.

Figure 14:Clusters Of Innovation Index In Europe. Source: European Innovation Scoreboard.
As can be seen in the clusters map, it appears that the countries of Central-Northern Europe have a very high value in terms of innovation index compared to the countries of Southern and Eastern Europe. This difference in terms of innovation index reflects a broader, differentiated and marked difference between Central-Northern and South-Eastern Europe regarding economic growth rates, the quality of institutions, human and social capital, and the degree of interconnection and internationalization. While it is certainly true that investment in technological innovation and research and development generates important effects in terms of Gross Domestic Product, the opposite is also true, namely that countries with a higher level of GDP also have greater opportunities to invest. in the production and accumulation of intangible assets. In this sense, the gap between the countries of Central-Northern Europe and the countries of Southern and Eastern Europe could be partially bridged using European economic policies aimed at investment in human capital and in the creation of infrastructures capable of maximizing production of intangible assets(Figure 14).
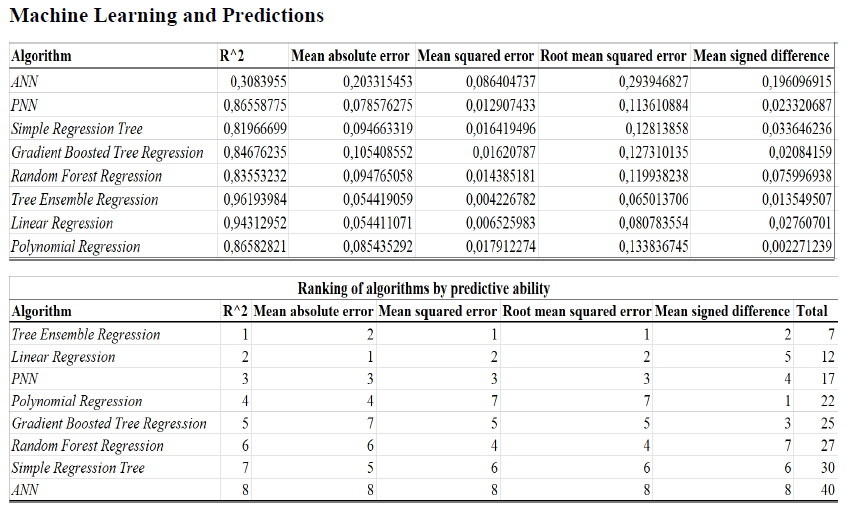
Machine Learning and Predictions
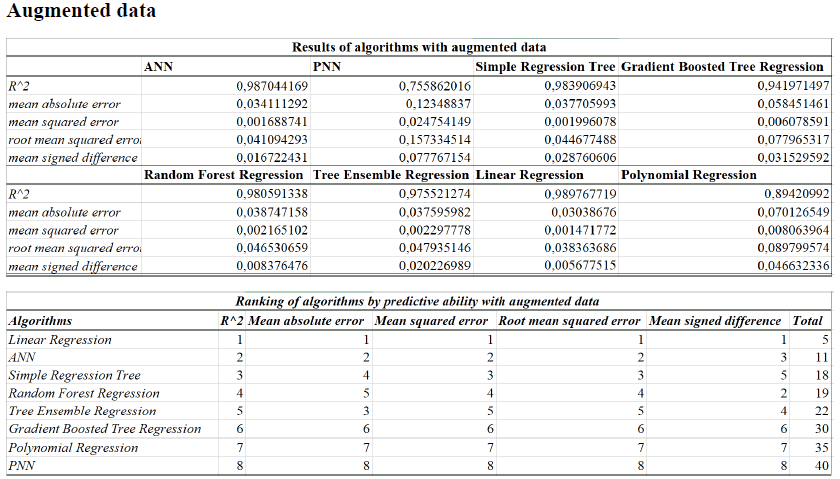
Various machine learning algorithms applied to predict the value of the innovation index among the European countries analyzed are analyzed below. The algorithms were compared on the basis of their ability to maximize the R-square and minimize the main statistical errors, namely: "Mean Absolute Error", "Mean Squared Error", "Root Mean Squared Error", "Mean Signed Difference". The algorithms were trained with 70% of the available data while the remaining 30% of the data was used for the actual prediction. The comparison of predictive performance between the various algorithms gave rise to the following ordering:
• Tree Ensemble Regression with a payoff value of 7;
• Linear Regression with a payoff value equal to an amount of 12;
• PNN-Probabilistic Neural Network with a payoff value of 17;
• Polynomial Regression with a payoff value of 22;
• Gradient Boosted Tree Regression with a payoff value of 25;
• Random Forest Regression with a payoff value of 27;
• Simple Regression Tree with a payoff value of 30;
• ANN-Artificial Neural Network with a payoff value of 40.

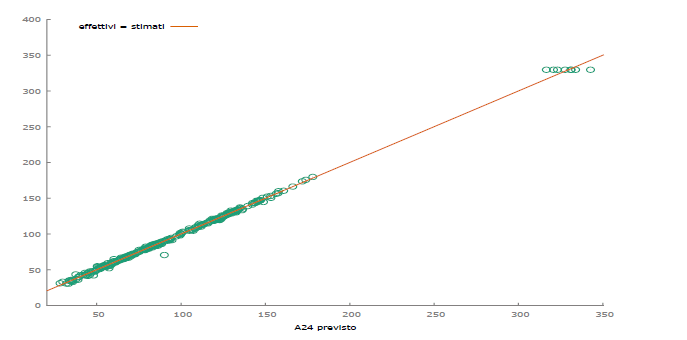
Figure 15: Results Of Predictions Of Eight Different Machine Learning Algorithms And Performance Order Base On Ranking.
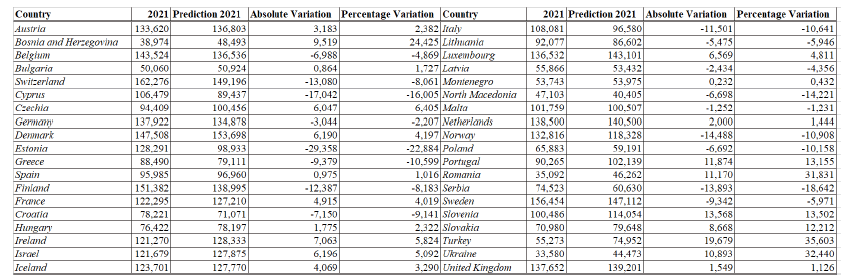
Based on the application of the Tree Ensemble Regression algorithm it was therefore possible to make the following predictions:
• Austria with an increase from an amount of 133.620 up to a value of 136.80 or equal to an amount of 3.18 units equal to a value of 2.3%;
• Bosnia with an increase from an amount of 38.97 up to a value of 48.49 or an increase of 9.51 units equal to an amount of 24.42%;
• Belgium with a decrease from an amount of 143.52 up to a value of 136.53 or equal to a variation of -6.98 or equal to an amount of -4.86%;
• Bulgaria with an increase from an amount of 50.060 up to a variation of 50.924 or equal to a variation of 0.864 units equal to a value of 1.72%;<
• Switzerland with a decrease from an amount of 162.27 up to a value of 149.19 or equal to a change of -13.080 units equal to an amount of -8.061%;
• Cyprus with a decrease from a value of 106.47 up to a value of 89.43 or equal to a variation of -17.04 units equal to a value of -16.005%;
• Czechia with an increase from an amount of 94,409 units up to a value of 100,455, or equal to a variation of 6.04 units equal to a value of 6.4%;
• Germany with a decrease from an amount of 137.922 units up to a value of 134.878 units or equal to a variation of -3.04 units equal to a value of -2.2%;
• Denmark with an increase from an amount of 147,508 units up to a value of 153,698 units or equal to a value of 6,190 units up to a value of 4,197%;
• Estonia with a decrease from an amount equal to 128,291 units up to a value of 98,933 units or equal to a variation of -29.35 units equal to a value of -22.884%;
• Greece with a decrease from an amount equal to 88.490 up to a value of 79.111 units or equal to a variation of -9.379 units equal to a value of -10.59%;
• Spain with an increase from an amount of 95.985 up to a change of 96.960 or equal to a value of 0.975 units equal to an amount of 1.016%;
• Finland with a variation of 151,382 units up to a value of 138,995 units or equal to a variation of -12,387 units equal to a value of -8.18%;
• France with an increase from an amount of 122.295 units up to a value of 127.21 units or equal to a value of 4.91 units equal to a value of 4.01%;
• Croatia with a decrease from an amount of 78.22 units up to a value of 71.071 units or equal to a variation of -7.1 units equal to a value of -9.14%;
• Hungary with an increase from an amount of 76,422 units up to a value of 78,197 units or equal to a variation of 1,775 units equal to a value of 2.322%;
• Ireland with an increase from an amount of 121,270 units up to a value of 128,333 units or equal to a variation of 7,063 units equal to a value of 5.82%;
• Israel with a variation from an amount of 121,679 units up to a value of 127,875 units or equal to a variation of 6,196 units equal to an amount of 5.092%;
• Iceland with an increase from an amount of 123.701 up to a change of 127.770 units or equal to a change of 4.069 units equal to an amount of 3.29%.
• Italy with a decrease from an amount of 108,081 units up to a variation of 96,580 units or equal to a variation of -11,501 units equal to an amount of -10.64%;
• Lithuania with a variation to an amount of 92,077 units up to a variation of 86,602 units equal to a value of -5.4 units equal to an amount of 5.9%;
• Luxembourg with a variation from an amount of 136,532 units up to a variation of 143,101 units equal to an amount of 6.56 units equal to an amount of 4.81%;
• Latvia with a decrease from an amount of 55.86 units up to a value of 53.43 units or equal to a variation of -2.43 units equal to an amount of -4.35%;
• Montenegro with an increase from a value of 53.74 units up to a value of 53.97 units or equal to a variation of 0.2 units equal to an amount of 0.4%;
• North Macedonia with a decrease from an amount of 47.1 units up to a value of 40.405 units or equal to an amount of -6.6 units equal to a value of -14.221%;
• Malta with a variation from an amount of 101.75 units up to a value of 100.50 units or equal to a variation of -1.2 units equal to an amount of -1.2%;
• Netherlands with an increase from an amount of 138.5 units up to a value of 140.5 units or equal to a variation of 2 units equal to an amount of 1.44%;
• Norway with a decrease from an amount of 132.8 units up to a value of 118.3 units or equal to a variation of -14.4 units equal to an amount of -10.9%;
• Poland with a variation of 65.88 units up to a value of 59.1 units or equal to a variation of -6.6 units equal to a variation of -10.15%;
• Portugal with a decrease from an amount of 90.26 up to a value of 102 units or equal to a change of 11.8 units equal to an amount of 13.15%;
• Romania with an increase from an amount of 35.09 units up to a variation of 46.2 units or equal to a variation of 11.17 units equal to a value of 31.8%;
• Serbia with a decrease from an amount of 74.5 units up to a value of 60.6 units or equal to a variation of -13.8 units equal to a variation of -18.6%;
• Sweden with a decrease from an amount of 156.4 units up to a value of 147.1 units equal to an amount of 9.3 units equal to a value of -5.9%;
• Slovenia with an increase from an amount of 100.48 units up to a value of 114.05 units or equal to a value of 13.5 units equal to a value of 13.5%;
• Slovakia with an increase from an amount of 70.9 units up to a value of 79.6 units or equal to a variation of 8.6 units equal to an amount of 12.2%;
• Turkey with an increase from an amount of 55.27 units up to a value of 74.9 units or equal to a variation of 19.6 units equal to a value of 35.6%;
• Ukraine with an increase from an amount of 33.5 units up to a value of 44.47 units or equal to a variation of 10.8 units equal to 32.4%;
• United Kingdom with an increase from an amount of 137.6 units up to a value of 139.2 units or equal to a variation of 1.54 units equal to an amount of 1.12%.
On average, the value of the innovation index in Europe is expected to decrease from an amount of 100.24 units up to a variation of 99.36 units or equal to a variation of -0.87 units equal to an amount of -0, 8%(Figure 15).
.
Machine Learning and Predictions with Augmented Data
Subsequently, the prediction data were used as augmented data to make a prediction on the predicted data. Again, eight different machine learning algorithms were compared. The data was trained using 70% of the data while the remaining 30% of the data was used for actual prediction. The algorithms were selected based on their ability to maximize the R-square and minimize the main statistical errors, namely: "Mean absolute error", "Mean squared error", "Root mean squared error", "Mean signed difference". Based on the use of the criteria used, it was possible to identify the following ordering of the algorithms, that is:
25 1939-4675-27-2-168
Citation Information: Leogrande, A., Laureti, L., Costantiello, A. (2023). The Innovation Index in Europe. International Journal of
Entrepreneurship, 27(2), 1-45.
• Linear Regression with a payoff of 5;
• ANN-Artificial Neural Network with a payoff of 11;
• Simple Regression Tree with a payoff of 18;
• Random Forest Regression with a payoff of 19;
• Tree Ensemble Regression with a payoff of 22;
• Gradient Boosted Tree Regression with a payoff of 30;
• Polynomial Regression with a payoff of 35;
• PNN-Probabilistic Neural Network with a payoff equal to 40.
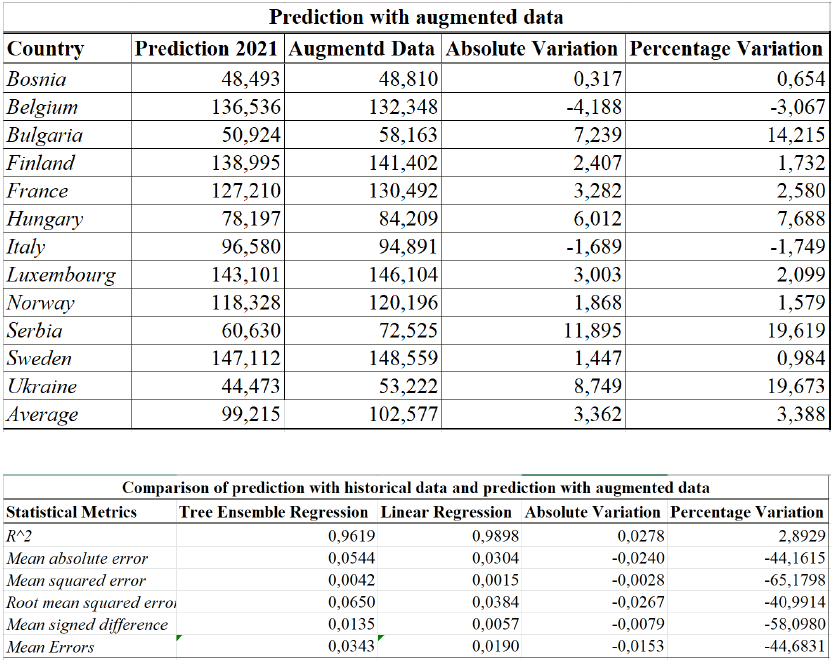
Therefore, based on the use of the Linear Regression algorithm, which is the best performer, the following predictions are:
• Bosnia with an increase from an amount of 48.49 units up to a value of 48.81 units or equal to a variation of 0.3 units equal to an amount of 0.65%;
• Belgium with an increase from an amount of 136.5 units up to a value of 132.3 units or equal to a variation of -4.1 units equal to an amount of -3.06%;
• Bulgaria with an increase from an amount of 50.9 units up to a value of 58.16 units or equal to a variation of 7.23 units equal to a value of 14.2%;
• Finland with an increase from an amount of 138.99 units up to a value of 141 units or equal to a value of 2.4 units equal to an amount of 1.73%;
• France with an increase from an amount of 127.2 units up to a value of 130.4 units equal to a variation of 3.2 units equal to a value of 2.58%;
• Hungary with a variation from 78.1 units up to a value of 84.2 units or open to a variation of 6.02 units equal to an amount of 7.6%;
• Italy with a decrease from an amount of 96.5 units up to a value of 94.8 units or equal to a variation of -1.68 units equal to a variation of -1.74%;
• Luxembourg with an increase from an amount of 143.1 units up to a value of 146.1 units equal to a value of 3.03 units equal to an amount of 2.09%;
• Norway with an increase from an amount of 118.3 units up to a value of 120.1 units or equal to a value of 1.86 units equal to a value of 1.57%;
• Serbia with an increase from an amount of 60.6 units up to a value of 72.5 units equal to an amount of 11.8 units equal to a value of 19.6%;
• Sweden with an increase from an amount of 147.1 up to an amount of 148.5 units or equal to a change of 1.4 units equal to an amount of 0.98%;
• Ukraine with an increase from an amount of 44.4 units up to a value of 53.2 units or equal to a value of 8.7 units equal to a value of 19.6%.

Figure 16:Prediction With Augmented Data.
On average in the prediction with augmented data, the value of the innovation index in the countries considered is predicted to grow from an amount of 99.2 units up to a value of 102.57% or equal to a value of 3.3 units equal to a value of 3.38%. Finally, by comparing the prediction made with Tree Ensemble Regression and the prediction with augmented data made using Linear Regression, it is possible to verify that the efficiency of the prediction increases. In fact, it is possible to verify the following values:
• Increase in R-squared by an amount equal to 2.89%;
• Reduction of the Mean Absolute Error by an amount equal to -44.16%;
• Reduction of the Mean Squared Error by an amount equal to -65.17%;
• Reduction of Root Mean Squared Error by an amount equal to -40.99%;
• Reduction of the Mean Signed Difference by an amount equal to -58.09%
Overall, by averaging the percentage variation of statistical errors in the passage between the prediction with real data and the prediction with augmented data, it is possible to verify a reduction of -44.68%(Figure 16).
Conclusion
Technological innovation is very relevant for the economic growth of countries. At the macro level, technological innovation can help Europe play a role in the technological conflict between the US and China. However, it is also necessary for the EU to resolve the technological gap between Central-Northern Europe and Southern and Eastern Europe. There are many levers that policy makers can use to increase the innovation index at a European level, starting from public investment to improving the education and training systems of human capital. Predictive analysis with augmented data shows a positive trend in the future of the innovation index in Europe. However, it is necessary that European institutions and European policy makers develop adequate economic policies to ensure that Europe has a role in the production and accumulation of technological innovation in the global context.
References
AlQararah, K., (2022). Assessing the robustness of composite indicators: The case of the Global Innovation Index.
Andabaka, A., Basarac Sertic, M. & Harc, M., (2019). Eco-innovation and economic growth in the European Union. Zagreb International Review of Economics & Business, 22(2), 43-54.
Indexed at, Google Scholar, Cross Ref
Bacon, D., Forner, D. & Ozcan, S., (2019). Machine learning approach for national innovation performance data analysis. 8th International Conference on Data Science, Technology and Applications, 325-331.
Indexed at, Google Scholar, Cross Ref
Boldrin, M. & Levine, D., (2002). The case against intellectual property. American Economic Review, 92(2), 209-212.
Indexed at, Google Scholar, Cross Ref
Bukreieva, D.S., (2020). Peculiarities of Formation of the Country's Innovative Environment Based on Complex Analysis of Resources of Innovation. Scientific Bulletin of National Mining University, 5.
Indexed at, Google Scholar, Cross Ref
Costantiello, A., Laureti, L. & Leogrande, A., (2021). The Innovation-Friendly Environment in Europe. SSRN Electronic Journal.
Indexed at, Google Scholar, Cross Ref
Costantiello, A., Laureti, L. & Leogrande, A., (2021). The Intellectual Assets in Europe. SSRN Electronic Journal.
Indexed at, Google Scholar, Cross Ref
Costantiello, A., Laureti, L. & Leogrande, A., (2021). The SMEs Innovation in Europe. SSRN Electronic Journal.
Costantiello, A., Laureti, L., Leogrande, A. & Matarrese, M., (2022). The Innovation Linkages in Europe. International Journal of Entrepreneurship, 26(S4), 1-13.
Indexed at, Google Scholar, Cross Ref
Costantiello, A., Laureti, L., Matarrese, M. & Leogrande, A., (2022). The innovation-sales growth nexusin Europe. Academy of Accounting and Financial Studies Journal, 26(2), 1-14.
Indexed at, Google Scholar, Cross Ref
Costantiello, A. & Leogrande, A., (2020). The innovation-employment nexus in Europe. American Journal of Humanities and Social Sciences Research (AJHSSR), 4(11), 166-187.
Costantiello, A., Leogrande, A. & Laureti, L., (2022). The corporate innovation in Europe. International Journal of Entrepreneurship, 26(S4), 1-9.
Indexed at, Google Scholar, Cross Ref
Dotta, V. & Munyo, I., 2019. Trade openness and innovation. The Innovation Journal, 24(2), 1-13.
Harsono, A.A. & Fitri, S., (2020). Innovation mindset: SMES vs startups. International Journal of Business and Economy, 2(2), 54-61.
Janoskova, K. & Kral, P., (2019). An in-depth analysis of the summary innovation index in the V4 countries. Journal of competitiveness, 11(68).
Indexed at, Google Scholar, Cross Ref
Khan, R. & Cox, P., (2017). Country culture and national innovation. Archives of Business Research, 5(2).
Indexed at, Google Scholar, Cross Ref
Laureti, L., Costantiello, A. & Leogrande, A., (2021). The Finance-Innovation Nexus in Europe. IJISET - International Journal of Innovative Science, Engineering & Technology, 7(12).
Laureti, L., Costantiello, A., Leogrande, A. & Leogrande, D., (2022). Creative Intangible Products andServices for Industry in Europe. Academy of Entrepreneurship Journal, 28(55), 1-9.
Laureti, L., Costantiello, A., Matarrese, M. & Leogrande, A., (2022). Foreign Doctorate Students in Europe. SSRN Electronic Journal.
Indexed at, Google Scholar, Cross Ref
Laureti, L., Costantiello, A., Matarrese, M. & Leogrande, A., (2022). Enterprises Providing ICT Training in Europe. SSRN Electronic Journal.
Indexed at, Google Scholar, Cross Ref
Laureti, L., Costantiello, A., Matarrese, M. & Leogrande, A., (2022). The Employment in Innovative Enterprises in Europe. SSRN Electronic Journal.
Indexed at, Google Scholar, Cross Ref
Leogrande, A. & Costantiello, A., (2021). Human Resources in Europe. Estimation, Clusterization, Machine Learning and Prediction. American Journal of Humanities and Social Sciences Research (AJHSSR), 5(9), 240-259.
Leogrande, A., Costantiello, A. & Laureti, L., (2021). The Broadband Penetration in Europe. Journal of Applied Economic Sciences, 16(3).
Indexed at, Google Scholar, Cross Ref
Leogrande, A., Costantiello, A. & Laureti, L., (2021). The Impact of Venture Capital Expenditures on Innovation in Europe. SSRN Electronic Journal.
Indexed at, Google Scholar, Cross Ref
Nomani, M.Z.M. & Hussain, Z., (2020). Innovation technology in health care management in the context of Indian environmental planning and sustainable development. International journal on emerging technologies, 11(2), 560-564.
Omer, M., El-Amin, M., Nasr, A. & Ahmed, R., (2020). Modeling, visualization, and analysis of african innovation performance. arXiv preprint arXiv:2008.07882.
Reich, R.W., Feng, W. & Sheng, S., (2018). Factors of global innovation index. New Orleans, LA., s.n.
Romer, P.M., (1944). The origins of endogenous growth. Journal of Economic perspectives, 8(1), 3-22.
Indexed at, Google Scholar, Cross Ref
Roszko-Wójtowicz, E. & Bialek, J., (2018). Diverse approaches to the multidimensional assessment of innovation in the European Union. Acta Oeconomica, 68(4), 521-547.
Indexed at, Google Scholar, Cross Ref
Samoilikova, A., (2020). Financial Policy of Innovation Development Providing: The Impact Formalization. Financial Markets, Institutions and Risks, 4(2), 5-15.
Indexed at, Google Scholar, Cross Ref
Schumpeter, J.A., (1934). The theory of economic development: An inquiry into profits, capital, credit, interest, and the business cycle. Transaction Publishers, 244.
Sener, S. & Delican, D., (2019). The causal relationship between innovation, competitiveness and foreign trade in developed and developing countries. Procedia Computer Science, Volume 158, 533-540.
Indexed at, Google Scholar, Cross Ref
Solow, R.M., (1956). A contribution to the theory of economic growth. The quarterly journal of economics, 70(1), 65-94.
Indexed at, Google Scholar, Cross Ref
Stavbunik, Y. & Pelucha, M., (2019). The innovation system of Kazakhstan in the context of the global innovation index. Innov. J. Public Sector Innov. J.(TIJ), 24(1), 1-24.
Stefan, R., (2021). Proposing An Aggregated Measurement Of Innovation: The Composite Innovation Index (Cii). Bucharest, Romania , s.n., p. Bucharest.
Indexed at, Google Scholar, Cross Ref
Received: 31-Dec-2022, Manuscript No. IJE-23-13143; Editor assigned: 02-Jan-2023, PreQC No. IJE-23-13143(PQ); Reviewed: 16-Jan-2023, QC No. IJE-23-13143; Revised: 19-Jan-2023, Manuscript No. IJE-23-13143(R); Published: 27-Jan-2023
Appendix
| Modello 679: Panel dinamico a un passo, usando 286 osservazioni Incluse 36 unità cross section Lunghezza serie storiche: minimo 7, massimo 8 Matrice H conforme ad Ox/DPD Variabile dipendente: A24 |
|||||
|---|---|---|---|---|---|
| Coefficiente | Errore Std. | z | p-value | ||
| A24(-1) | -0,00707884 | 0,00520883 | -1,359 | 0,1741 | |
| const | 0,202675 | 0,0949371 | 2,135 | 0,0328 | ** |
| A3 | 1,53,922 | 0,585297 | 2,630 | 0,0085 | *** |
| A7 | 0,0395124 | 0,00707264 | 5,587 | <0,0001 | *** |
| A9 | 0,0455434 | 0,00568277 | 8,014 | <0,0001 | *** |
| A11 | 0,0424438 | 0,00780954 | 5,435 | <0,0001 | *** |
| A15 | 0,0336792 | 0,00433718 | 7,765 | <0,0001 | *** |
| A17 | 0,332687 | 0,0699718 | 4,755 | <0,0001 | *** |
| A19 | 0,0178313 | 0,00717182 | 2,486 | 0,0129 | ** |
| A21 | -0,146768 | 0,0166825 | -8,798 | <0,0001 | *** |
| A22 | 1,03,721 | 0,0567282 | 18,28 | <0,0001 | *** |
| A23 | 0,262230 | 0,0572095 | 4,584 | <0,0001 | *** |
| A25 | 0,0393198 | 0,00654943 | 6,004 | <0,0001 | *** |
| A26 | 0,0451788 | 0,00751595 | 6,011 | <0,0001 | *** |
| A28 | 0,0568503 | 0,0109479 | 5,193 | <0,0001 | *** |
| A30 | 0,0316080 | 0,00923234 | 3,424 | 0,0006 | *** |
| A31 | 0,0309797 | 0,0124066 | 2,497 | 0,0125 | ** |
| A32 | -0,0537332 | 0,0152730 | -3,518 | 0,0004 | *** |
| A33 | 0,121945 | 0,0195697 | 6,231 | <0,0001 | *** |
| A34 | 0,0833946 | 0,0179647 | 4,642 | <0,0001 | *** |
| A36 | 0,0916326 | 0,0237086 | 3,865 | 0,0001 | *** |
| A37 | -0,0730159 | 0,0240850 | -3,032 | 0,0024 | *** |
| A38 | 0,0190378 | 0,00449385 | 4,236 | <0,0001 | *** |
| A44 | 0,0316008 | 0,0134024 | 2,358 | 0,0184 | ** |
| A46 | 0,0607867 | 0,00815688 | 7,452 | <0,0001 | *** |
| A47 | -0,146466 | 0,0437969 | -3,344 | 0,0008 | *** |
| A48 | 0,0924321 | 0,0291980 | 3,166 | 0,0015 | *** |
| A53 | -0,0750842 | 0,0178670 | -4,202 | <0,0001 | *** |
| A56 | 0,0489550 | 0,00747378 | 6,550 | <0,0001 | *** |
| A59 | -0,102495 | 0,0273677 | -3,745 | 0,0002 | *** |
Somma quadr. residui
1485,395
E.S. della regressione
2,408802
Numero di strumenti = 50 Test per errori AR(1): z = -1,92183 [0,0546]
Test per errori AR(2): z = 0,667316 [0,5046]
Test di sovra-identificazione di Sargan: Chi-quadro(20) = 58,1968 [0,0000]
Test (congiunto) di Wald: Chi-quadro(29) = 1,15817e+006 [0,0000]
| Modello 680: Pooled OLS, usando 357 osservazioni Incluse 36 unità cross section Lunghezza serie storiche: minimo 8, massimo 10 Variabile dipendente: A24 |
|||||
|---|---|---|---|---|---|
| Coefficiente | Errore Std. | rapporto t | p-value | ||
| const | 0,0433284 | 0,287512 | 0,1507 | 0,8803 | |
| A3 | 0,678653 | 0,382845 | 1,773 | 0,0772 | * |
| A7 | 0,0130459 | 0,00544920 | 2,394 | 0,0172 | ** |
| A9 | 0,0528053 | 0,00377319 | 13,99 | <0,0001 | *** |
| A11 | 0,0502201 | 0,00727522 | 6,903 | <0,0001 | *** |
| A15 | 0,0246780 | 0,00289748 | 8,517 | <0,0001 | *** |
| A17 | 0,265830 | 0,0186567 | 14,25 | <0,0001 | *** |
| A19 | 0,0177277 | 0,00335671 | 5,281 | <0,0001 | *** |
| A21 | -0,120709 | 0,0152340 | -7,924 | <0,0001 | *** |
| A22 | 1,06,179 | 0,0156644 | 67,78 | <0,0001 | *** |
| A23 | 0,166216 | 0,0196354 | 8,465 | <0,0001 | *** |
| A25 | 0,0369538 | 0,00426453 | 8,665 | <0,0001 | *** |
| A26 | 0,0481567 | 0,00486535 | 9,898 | <0,0001 | *** |
| A28 | 0,0219401 | 0,00738898 | 2,969 | 0,0032 | *** |
| A30 | 0,0250155 | 0,00479408 | 5,218 | <0,0001 | *** |
| A31 | 0,0389279 | 0,00690502 | 5,638 | <0,0001 | *** |
| A32 | -0,0271113 | 0,00590935 | -4,588 | <0,0001 | *** |
| A33 | 0,103583 | 0,0103675 | 9,991 | <0,0001 | *** |
| A34 | 0,107235 | 0,00881122 | 12,17 | <0,0001 | *** |
| A36 | 0,0701824 | 0,00952741 | 7,366 | <0,0001 | *** |
| A37 | -0,0346624 | 0,00763081 | -4,542 | <0,0001 | *** |
| A38 | 0,0307581 | 0,00291769 | 10,54 | <0,0001 | *** |
| A44 | 0,0397638 | 0,00822019 | 4,837 | <0,0001 | *** |
| A46 | 0,0717536 | 0,00702976 | 10,21 | <0,0001 | *** |
| A47 | -0,0848143 | 0,0111153 | -7,630 | <0,0001 | *** |
| A48 | 0,0802648 | 0,00994546 | 8,071 | <0,0001 | *** |
| A53 | -0,0419613 | 0,00671948 | -6,245 | <0,0001 | *** |
| A56 | 0,0629517 | 0,00540857 | 11,64 | <0,0001 | *** |
| A59 | -0,0671234 | 0,00727085 | -9,232 | <0,0001 | *** |
| Media var. dipendente | 79,32,081 | SQM var. dipendente | 61,45,036 |
| Somma quadr. residui | 21,41,837 | E.S. della regressione | 25,55,385 |
| R-quadro | 0,998407 | R-quadro corretto | 0,998271 |
| F(28, 328) | 73,40,671 | P-value(F) | 0,000000 |
| Log-verosimiglianza | -826,3765 | Criterio di Akaike | 17,10,753 |
| Criterio di Schwarz | 18,23,207 | Hannan-Quinn | 17,55,481 |
| rho | 0,538520 | Durbin-Watson | 0,919016 |
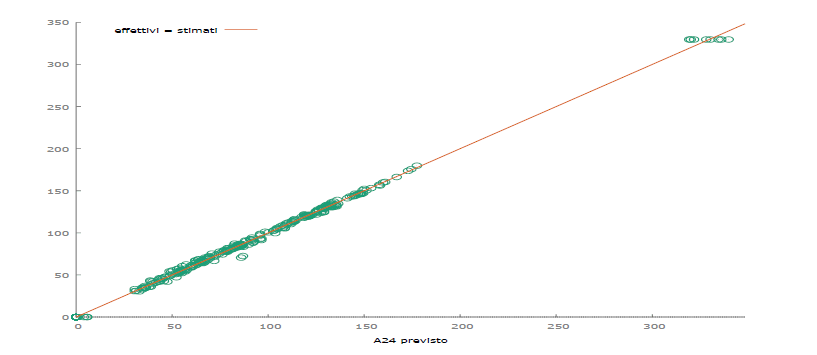
| Modello 681: Effetti fissi, usando 357 osservazioni Incluse 36 unità cross section Lunghezza serie storiche: minimo 8, massimo 10 Variabile dipendente: A24 |
|||||
|---|---|---|---|---|---|
| Coefficiente | Errore Std. | rapporto t | p-value | ||
| const | -0,133559 | 0,261346 | -0,5110 | 0,6097 | |
| A3 | 1,15,866 | 0,363606 | 3,187 | 0,0016 | *** |
| A7 | 0,0278575 | 0,00680004 | 4,097 | <0,0001 | *** |
| A9 | 0,0519717 | 0,00541362 | 9,600 | <0,0001 | *** |
| A11 | 0,0431201 | 0,00957706 | 4,502 | <0,0001 | *** |
| A15 | 0,0300189 | 0,00456770 | 6,572 | <0,0001 | *** |
| A17 | 0,273552 | 0,0240634 | 11,37 | <0,0001 | *** |
| A19 | 0,0193724 | 0,00510480 | 3,795 | 0,0002 | *** |
| A21 | -0,136785 | 0,0145844 | -9,379 | <0,0001 | *** |
| A22 | 1,04,315 | 0,0240673 | 43,34 | <0,0001 | *** |
| A23 | 0,204146 | 0,0258861 | 7,886 | <0,0001 | *** |
| A25 | 0,0417096 | 0,00504782 | 8,263 | <0,0001 | *** |
| A26 | 0,0482743 | 0,00568629 | 8,490 | <0,0001 | *** |
| A28 | 0,0294458 | 0,0118681 | 2,481 | 0,0137 | ** |
| A30 | 0,0335392 | 0,00587721 | 5,707 | <0,0001 | *** |
| A31 | 0,0258262 | 0,0111700 | 2,312 | 0,0215 | ** |
| A32 | -0,0456562 | 0,00857157 | -5,326 | <0,0001 | *** |
| A33 | 0,112306 | 0,0132718 | 8,462 | <0,0001 | *** |
| A34 | 0,0915801 | 0,0118435 | 7,733 | <0,0001 | *** |
| A36 | 0,0861074 | 0,0126459 | 6,809 | <0,0001 | *** |
| A37 | -0,0484236 | 0,0104943 | -4,614 | <0,0001 | *** |
| A38 | 0,0264612 | 0,00381464 | 6,937 | <0,0001 | *** |
| A44 | 0,0478161 | 0,0111466 | 4,290 | <0,0001 | *** |
| A46 | 0,0620442 | 0,00936696 | 6,624 | <0,0001 | *** |
| A47 | -0,101336 | 0,0150897 | -6,716 | <0,0001 | *** |
| A48 | 0,0785110 | 0,0161378 | 4,865 | <0,0001 | *** |
| A53 | -0,0569552 | 0,00863513 | -6,596 | <0,0001 | *** |
| A56 | 0,0608313 | 0,00697373 | 8,723 | <0,0001 | *** |
| A59 | -0,0737003 | 0,00923637 | -7,979 | <0,0001 | *** |
| Media var. dipendente | 79,32,081 | SQM var. dipendente | 61,45,036 |
| Somma quadr. residui | 14,70,129 | E.S. della regressione | 22,39,979 |
| R-quadro LSDV | 0,998906 | R-quadro intra-gruppi | 0,997955 |
| LSDV F(63, 293) | 42,48,106 | P-value(F) | 0,000000 |
| Log-verosimiglianza | -759,2045 | Criterio di Akaike | 16,46,409 |
| Criterio di Schwarz | 18,94,584 | Hannan-Quinn | 17,45,119 |
| rho | 0,336328 | Durbin-Watson | 11,65,889 |
Test congiunto sui regressori -
Statistica test: F(28, 293) = 5107,74
con p-value = P(F(28, 293) > 5107,74) = 0 Test per la differenza delle intercette di gruppo -
Ipotesi nulla: i gruppi hanno un'intercetta comune
Statistica test: F(35, 293) = 3,82494
con p-value = P(F(35, 293) > 3,82494) = 1,21044e-010
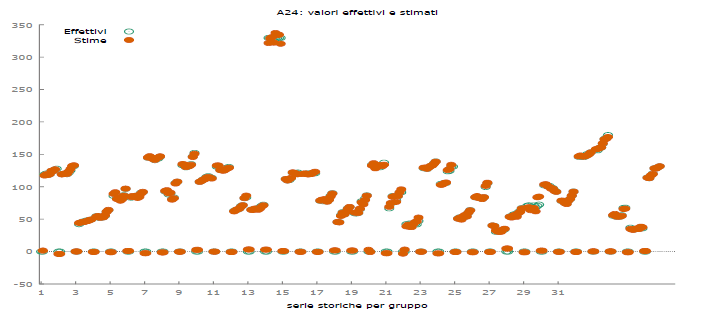
| Modello 682: Effetti casuali (GLS), usando 357 osservazioni Incluse 36 unità cross section Lunghezza serie storiche: minimo 8, massimo 10 Variabile dipendente: A24 |
|||||
|---|---|---|---|---|---|
| Coefficiente | Errore Std. | z | p-value | ||
| const | -0,0921587 | 0,346724 | -0,2658 | 0,7904 | |
| A3 | 1,00,403 | 0,356614 | 2,815 | 0,0049 | *** |
| A7 | 0,0212433 | 0,00611772 | 3,472 | 0,0005 | *** |
| A9 | 0,0534101 | 0,00457828 | 11,67 | <0,0001 | *** |
| A11 | 0,0437713 | 0,00838395 | 5,221 | <0,0001 | *** |
| A15 | 0,0272909 | 0,00371784 | 7,341 | <0,0001 | *** |
| A17 | 0,269952 | 0,0210988 | 12,79 | <0,0001 | *** |
| A19 | 0,0181887 | 0,00422313 | 4,307 | <0,0001 | *** |
| A21 | -0,133542 | 0,0142390 | -9,379 | <0,0001 | *** |
| A22 | 1,05,716 | 0,0198246 | 53,33 | <0,0001 | *** |
| A23 | 0,194849 | 0,0223633 | 8,713 | <0,0001 | *** |
| A25 | 0,0388992 | 0,00459325 | 8,469 | <0,0001 | *** |
| A26 | 0,0485911 | 0,00522549 | 9,299 | <0,0001 | *** |
| A28 | 0,0264390 | 0,00959307 | 2,756 | 0,0059 | *** |
| A30 | 0,0307684 | 0,00531326 | 5,791 | <0,0001 | *** |
| A31 | 0,0323188 | 0,00898610 | 3,597 | 0,0003 | *** |
| A32 | -0,0389030 | 0,00714994 | -5,441 | <0,0001 | *** |
| A33 | 0,106169 | 0,0116442 | 9,118 | <0,0001 | *** |
| A34 | 0,0970707 | 0,0103985 | 9,335 | <0,0001 | *** |
| A36 | 0,0791031 | 0,0111435 | 7,099 | <0,0001 | *** |
| A37 | -0,0441770 | 0,00896007 | -4,930 | <0,0001 | *** |
| A38 | 0,0290613 | 0,00338475 | 8,586 | <0,0001 | *** |
| A44 | 0,0463457 | 0,00966971 | 4,793 | <0,0001 | *** |
| A46 | 0,0655992 | 0,00820966 | 7,990 | <0,0001 | *** |
| A47 | -0,0943825 | 0,0129469 | -7,290 | <0,0001 | *** |
| A48 | 0,0815436 | 0,0129689 | 6,288 | <0,0001 | *** |
| A53 | -0,0521181 | 0,00749973 | -6,949 | <0,0001 | *** |
| A56 | 0,0614595 | 0,00615828 | 9,980 | <0,0001 | *** |
| A59 | -0,0701719 | 0,00810637 | -8,656 | <0,0001 | *** |
| Media var. dipendente | 79,32,081 | SQM var. dipendente | 61,45,036 |
| Somma quadr. residui | 22,90,715 | E.S. della regressione | 26,38,685 |
| Log-verosimiglianza | -838,3717 | Criterio di Akaike | 17,34,743 |
| Criterio di Schwarz | 18,47,198 | Hannan-Quinn | 17,79,471 |
| rho | 0,336328 | Durbin-Watson | 11,65,889 |
Varianza 'between' = 1,8395
Varianza 'within' = 5,0175
theta medio = 0,53538
Test congiunto sui regressori -
Statistica test asintotica: Chi-quadro(28) = 166563
con p-value = 0 Test Breusch-Pagan -
Ipotesi nulla: varianza dell'errore specifico all'unità = 0
Statistica test asintotica: Chi-quadro(1) = 33,6245
con p-value = 6,68438e-009 Test di Hausman -
Ipotesi nulla: le stime GLS sono consistenti
Statistica test asintotica: Chi-quadro(28) = 40,7439
con p-value = 0,0566776
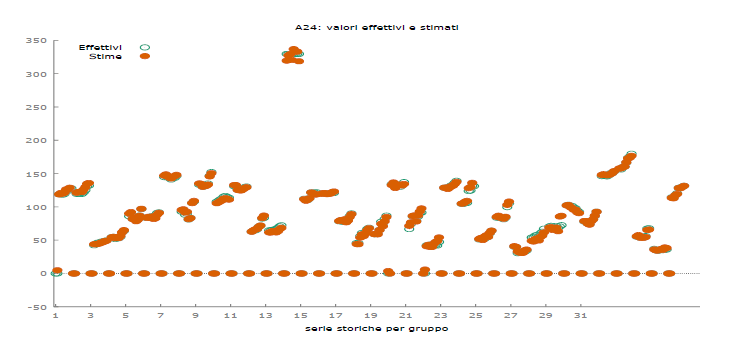
| Modello 683: WLS, usando 357 osservazioni Incluse 36 unità cross section Variabile dipendente: A24 Pesi basati sulle varianze degli errori per unità |
|||||
|---|---|---|---|---|---|
| Coefficiente | Errore Std. | rapporto t | p-value | ||
| const | 0,0329903 | 0,128876 | 0,2560 | 0,7981 | |
| A3 | 0,713323 | 0,232464 | 3,069 | 0,0023 | *** |
| A7 | 0,0145029 | 0,00347240 | 4,177 | <0,0001 | *** |
| A9 | 0,0518442 | 0,00243023 | 21,33 | <0,0001 | *** |
| A11 | 0,0585374 | 0,00478544 | 12,23 | <0,0001 | *** |
| A15 | 0,0210404 | 0,00167984 | 12,53 | <0,0001 | *** |
| A17 | 0,264648 | 0,00936483 | 28,26 | <0,0001 | *** |
| A19 | 0,0172043 | 0,00190826 | 9,016 | <0,0001 | *** |
| A21 | -0,116457 | 0,00841135 | -13,85 | <0,0001 | *** |
| A22 | 1,04,464 | 0,0160648 | 65,03 | <0,0001 | *** |
| A23 | 0,145546 | 0,0115567 | 12,59 | <0,0001 | *** |
| A25 | 0,0401796 | 0,00230868 | 17,40 | <0,0001 | *** |
| A26 | 0,0486647 | 0,00226729 | 21,46 | <0,0001 | *** |
| A28 | 0,0392248 | 0,00630418 | 6,222 | <0,0001 | *** |
| A30 | 0,0185735 | 0,00239718 | 7,748 | <0,0001 | *** |
| A31 | 0,0379240 | 0,00360427 | 10,52 | <0,0001 | *** |
| A32 | -0,0206206 | 0,00351129 | -5,873 | <0,0001 | *** |
| A33 | 0,105862 | 0,00597274 | 17,72 | <0,0001 | *** |
| A34 | 0,0986837 | 0,00589812 | 16,73 | <0,0001 | *** |
| A36 | 0,0629490 | 0,00523852 | 12,02 | <0,0001 | *** |
| A37 | -0,0255475 | 0,00449288 | -5,686 | <0,0001 | *** |
| A38 | 0,0246221 | 0,00166584 | 14,78 | <0,0001 | *** |
| A44 | 0,0332703 | 0,00462430 | 7,195 | <0,0001 | *** |
| A46 | 0,0751490 | 0,00421412 | 17,83 | <0,0001 | *** |
| A47 | -0,0834400 | 0,00545302 | -15,30 | <0,0001 | *** |
| A48 | 0,0771517 | 0,00504120 | 15,30 | <0,0001 | *** |
| A53 | -0,0317899 | 0,00411283 | -7,729 | <0,0001 | *** |
| A56 | 0,0644115 | 0,00347511 | 18,54 | <0,0001 | *** |
| A59 | -0,0661286 | 0,00335355 | -19,72 | <0,0001 | *** |
Statistiche basate sui dati ponderati:
| Somma quadr. residui | 31,82,887 | E.S. della regressione | 0,985085 |
| R-quadro | 0,999537 | R-quadro corretto | 0,999498 |
| F(28, 328) | 25307,41 | P-value(F) | 0,000000 |
| Log-verosimiglianza | -486,0734 | Criterio di Akaike | 10,30,147 |
| Criterio di Schwarz | 11,42,601 | Hannan-Quinn | 10,74,875 |
Statistiche basate sui dati originali:
| Media var. dipendente | 79,32,081 | SQM var. dipendente | 61,45,036 |
| Somma quadr. residui | 22,57,018 | E.S. della regressione | 26,23,195 |