Research Article: 2021 Vol: 25 Issue: 5S
Innovative Statistical Methods in Financial Management of Enterprises
Sylvia Jencova, University of Presov
Petra Vasanicova, University of Presov
Marta Lukacova, University of Presov
Abstract
At present, there is an increasing emphasis on the use of innovative statistical methods in financial management, specifically in the financial and economic analysis of companies in various sectors. The aim of the paper is to identify the groups of financial ratios that can be used to measure the financial performance of the enterprises operating in the Slovak agriculture sector. The statistical analysis is performed by applying the Principal Component Analysis (PCA) and Factor Analysis (FA). Financial indicators were compiled from absolute indicators obtained from the Register of Financial Statements of the Slovak Republic, while the research sample consisted of economic entities within NACE Rev. 2 Class 01.11-Growing of cereals (except rice), leguminous crops and oil seeds. The analysis included 7 financial ratios: total assets turnover (in days), inventory turnover (in days), accounts receivables turnover ratio (in days), accounts payable turnover ratio (in days), return on assets, return on equity, and return on sales. Results show 3 common factors: factor of profitability, factor of receivables and payables, and factor of activity. If the companies operating in the examined sector focus on these factors, they can improve their competitive position.
Keywords
Innovative Methods, Statistical Methods, Financial Management, Factor Analysis, Principal Component Analysis
Introduction
The role of innovations in entrepreneurship is indisputable. To improve the conditions, market value, and competitiveness of the decision-making unit, it is necessary to implement innovations in each area of management, especially, in financial management. As is stated in Blach (2011), financial innovations are applied when the traditional financial solutions are no longer available.
Analyzing the financial and economic situation of companies in any area and any focus provides important images of the efficiency of operation and use of resources in companies, as well as valuable information for making key decisions for targeted management, the existence of the company, and influencing its market value. The equal importance of financial outcomes is to ensure the financial health of the company, stability, and prosperity. The data obtained from financial and economic research often talk about many dimensions, properties, and relationships, so their further processing by deeper analyzes can help identify key connections of success, within the individual specifications of each unique company with unique conditions of existence.
The financial and economic conditions of the company are a complex system of many factors, where inconspicuous deviations of their specifications and hidden connections of minor changes can represent key factors for further success or failure of made decisions. These relationships, therefore, deserve a deeper level of observation and the application of mathematical and statistical methods, which could identify these essential aspects and thus put an effective tool for achieving the desired states in the hands of management. They build on past connections and experiences in a particular company, allowing them to approximate the possible consequences of the realized changes through future decisions.
To minimize the negative threat to financial health and thus the existence of the company, it is appropriate to examine these changes and connections, quantify and streamline the process of using existing resources to achieve greater effects through appropriate management. It is necessary to constantly examine possibilities of simplifying and quantifying the extensive changes in phenomena by using an application of mathematical and statistical methods.
It is very important to specify the financial indicators that will determine the financial performance of companies operating in the agriculture sector. However, we have no knowledge about the existence of research that studies the financial performance of the Slovak agriculture companies using factor analysis; in this paper, we fill this gap.
Specifically, the main aim of this paper is to identify the groups of financial ratios that can be used to measure the financial performance of the selected companies operating among Agriculture, forestry and fishing industry, specifically belonging to Class 01.11 od NACE Rev. 2-Growing of cereals (except rice), leguminous crops and oil seeds.
Literature Review
Employment of financial statements data to the ratio financial metrics is the main principle, which expands the explanatory power of absolute indicators and allows discovering possible causal relationships between them for the functioning of the financial and economic dimension of the company. Financial metrics are divided into four groups of indicators: liquidity, activity, indebtedness, and profitability indicators (Kubickova & Jindrichovska, 2015).
Many authors (Stefko, Horvathova & Mokrisova, 2021; Stefko, Horváthová & Mokrišová, 2020; Jencova, 2018) argue that the analysis of ratio metrics is the most widely used method with a focus on evaluating the financial analysis and performance of an economic unit, and therefore, it is often titled the core of the financial analysis.
Exploring the nature of the relationships between variables is a very important part of any scientific field. In developed disciplines, the variables are precisely defined and accepted by the general scientific community as important research subjects. The interrelationships between such variables are often mathematically specified, and in some cases, these mathematical relationships are further organized into complex theories involving several interrelated variables. Variables are often not precisely defined, and therefore, across the scientific community, there is no agreement in identifying the variables, which should be interrelated, and a clear idea of the nature of the relationship between them (Comrey & Howard, 1992).
In the initial phase of research, the number of analyzed indicators is often very high. For simplicity, it is effective to replace them with a smaller range of essential factors, in order to preserve as much of information as possible by simplifying statistical analyzes. In this context, multidimensional statistical methods are used. Specifically, Principal Component Analysis (PCA) and Factor Analysis (FA) have been developed to identify and analyze the hidden relationships between variables, and thus understand how they correlate. Both methods are based on the analysis of the covariance (correlation) matrix of the initial variables and look for the existence of latent variables (Stankovicova & Mojsejova, 2000)..
PCA was used in several studies connected with the financial area, e.g., Qu & Li (2021) assessed the financial risk; Sabau-Popa et al. (2020) studied financial health; Nobre & Neves (2019) and Nadkarni & Ferreira Neves (2018) employed the PCA in the financial markets; Yang & Li (2017) and Homsud & Choksuchat (2012) examined financial ratios of listed companies; Li & Zhang (2011) studied financial health of real estate listed companies; and Tung, et al., (2009) evaluated financial performance of airline companies. FA is the second often used method connected with the PCA. Table 1 introduces other studies, where the FA was employed. Specific country, research sample, and resulting factors are presented for each study.
| Table 1 Factors Calculated in the Existing Literature |
|||
|---|---|---|---|
| Authors | Country | Sample | Factors |
| Öcal et al. (2007) | Turkey | construction companies for a 5-year period | LiquidityCapital structure and profitabilityActivity efficiencyProfit margin and growthAssets structure |
| Czillingová, Petruška & Tkác (2012) | world | selected global steel producers in years 2003-2007 | Liquidity factorProfitability factorFactor of indebtednessActivity factor |
| Erdogan (2013) | Turkey | top 500 industrial enterprises | ProductivityProfitability and Capital structureEfficiencyExport intensity and proportion of sales from production |
| Ming et al. (2014) | China | 38 companies in the pharmaceutical industry from 2007 to 2012 | Operating capacitySolvencyProfit abilityGrowth ability |
| Hornungová (2015) | Czech Republic | 56 IT companies (CZ NACE J–Information and Communication Activities) with the number of employees over 250 | ProfitabilityCash-FlowReturns |
| Hornungová & Milichovský (2016) | Czech Republic | 1985 agricultural companies | Operational factorProfit factorReturn factorAverage cost per employee factor |
| Štefko et al. (2021) | Slovak Republic | 236 companies in mechanical engineering industry in 2017 | LiquidityProfitabilityIndebtednessActivity |
PCA, also called the dimension reduction method, was introduced by Pearson as a statistical method of multidimensional analysis as early as 1901. Its essence is the transformation of multidimensional input data in such a way that we obtain output data with the most important linear directions. In the process of applying this method, the directions with the lowest weight are subject to filtration and are neglected. Therefore, by applying the procedure, we extract characteristic directions (factors) from the original data and, at the same time, reduce the dimension of the data. This reduces the number of coordinates necessary for an effective description of the required subjects, considering only directions with considerable variance (Jolliffe, 2002).
The method can also be used to detect outliers, i.e., significantly atypical objects, which occasionally need to be disqualified from further analysis for their significant impact on the resulting values of analyzes. It allows to visually analyzing the original multidimensional data in two-dimensional, respectively three-dimensional space while maintaining the greatest possible degree of their initial variability. This analysis is one of the basic methods of data compression, where we can represent the original quantity of "n" variables with a smaller number of variables while clarifying the substantial range of variability of the original data set. The system of new variables, referred to as the principal components, consists of linear combinations of the original variables and we create it gradually. The first principal component captures the largest part of the variability of the original data set; the other principal components contribute to the overall variance with a smaller share. All pairs of principal components are perpendicular to each other (Stankovicová & Vojtková, 2007).
Although this method was originally designed to work with quantitative input variables, Král, et al., (2009) state that its application is also possible for binary variables. However, binary variables cause the so-called horseshoe effect, which means that even if the data is transformed to the axis of the first two principal components, the graph displays the arrangement in the shape of a horseshoe. The input variables need to be standardized, thus removing the influence of the different units and scales in which the values were measured.
The input data should also meet the condition that the number of monitored input variables is at least smaller by one than the number of objects on which we monitored the variables. Optimally, the number of objects should be approximately the square of the number of variables (Krzanowski, 2000).
Essentially, PCA is a method for generating new variables that are the result of linear combinations of primary input variables. The highest possible number of new variables that we can create using this method is equal to the number of original variables. The newly created variables, which we name the principal components, are no longer correlated with each other. In general, the PCA is mainly used to detect outliers, which sometimes have a very intense effect on the results of statistical analyzes. It is also important in reducing the dimension of multidimensional analyzes and eliminating the dependence between variables with the subsequent use of independent principal components in other methods (Stankovicová & Mojsejová, 2000).
The PCA has similar and different properties to FA. Stankovicová & Mojsejová (2000) summarized the advantages and disadvantages in the following points:
1. Neither method should not be used if the primary variables are not correlated.
2. FA aims to explain the correlations of the primary variables through a small number of latent variables. PCA explains only the variance of the variables.
3. Considering FA, it is possible to point out the source of uncertainty in a calculation, which allows taking into account many assumptions and methods of rotation, which can result in various solutions. In contrast, PCA calculations are much more straightforward.
4. PCA disadvantage lies in the dependence of analysis results from the transformation units of measurement variables. From this aspect, the FA acquires the advantage of the maximum likelihood method, where the consequences of the change on the course of the calculation are irrelevant.
| Table 2 Comparison of Principal Component Analysis and Factor Analysis |
||
|---|---|---|
| Differences | PCA | FA |
| Correlation between the original characters | yes | yes |
| Model | no | yes |
| Increasing the number of used characters | the original components don´t change | other factors will change |
| Calculation | simple | more complicated |
| Correlation between principal components/factors | no | yes |
| Residue correlation | yes | no |
Agriculture, Forestry, and Fishing In Slovakia
The agriculture sector in Slovakia uses approximately 19,350 km2 of agricultural land (39.5% of the country's surface). At present, agriculture and related industries employ only about 3% of the economically active population (up to 100,000 employees). Total sales of agricultural products in 2018 reached €1.82 billion, with crop production predominating with a share of almost 60%. Imports of agricultural and food products in 2018 amounted to €4.468 billion. Compared to 2017, imports of agri-food products were 5.5% higher. In the same period, exports of agri-food products from the Slovak Republic were €2.819 billion, which represents a year-on-year decrease of 1.1%. Slovakia imported the most food from the Czech Republic (32%), Poland (14%), and Germany (12%). On the contrary, most exports were to the Czech Republic (24%), Hungary (20%), and Poland (15%) (Strapác, 2019).
Agriculture achieved, in 2019, positive Earnings Before Tax (EBT) of € 83.0 million. Compared to 2018, its level decreased by €20.6 million. A faster decrease in revenues (by 7.3%) than costs (by 6.9%) contributed to a decrease in cost-effectiveness. Revenues reached the level of €2,812.3 million and were by € 83.0 million higher than costs (€2,729.3 million). The increase in input prices was reflected in the cost of income, which reached €97.0 million. Revenues in 2019 decreased by 10.8% to €1,628.2 million, while product prices increased by 1.8%. In 2019, the number of workers in agriculture increased by 20.9% to 53.2 thousand workers. The average monthly wage in agriculture increased to € 820. The total indebtedness of assets reached 47.4% (MARD SR, 2020).
According to NACE Rev. 2, agriculture sector belongs to the Section A–Agriculture, forestry and fishing. Detailed structure of this Section is in Table 3.
| Table 3 Divisions and Subdivisions of Agriculture, Forestry and Fishing |
|
|---|---|
| Number | Name |
| 01 | Crop and animal production, hunting and related service activities |
| 011 | Growing of non-perennial crops |
| 012 | Growing of perennial crops |
| 013 | Plant propagation |
| 014 | Animal production |
| 015 | Mixed farming |
| 016 | Support activities to agriculture and post-harvest crop activities |
| 017 | Hunting, trapping and related services |
| 02 | Forestry and logging |
| 021 | Silviculture and other forestry activities |
| 022 | Logging |
| 023 | Gathering of wild growing non-wood products |
| 024 | Support services to forestry |
| 03 | Fishing and aquaculture |
| 031 | Fishing |
| 032 | Aquaculture |
Within the territory of Slovakia, agriculture has its history in each region. According to the Report on Agriculture and Food in the Slovak Republic for 2019 created by the Ministry of Regional Development of the Slovak Republic (2020), production performance (specifically, total agricultural production–both plant and animal, but with a deep difference in plant) decreased again. This occurred mainly due to a decline in hectare yields and livestock production, despite an increase in the volume of investment in gross fixed capital formation and employment in the sector, where total expenditure on agriculture and food reached €980.4 million (a year-on-year increase of 11.9%), considered from European and national sources. The reason may also be a reduction in agricultural land and a decline in the condition of all livestock, despite the increased consumption of milk and dairy products, pork, potatoes, and fruit by the population of the Slovak Republic.
Considering the structure of enterprises operating in Slovak agriculture, legal entities (commercial companies) dominated. Their number had an increasing tendency, as well as the number of registered natural persons (self-employed farmers), compared to the decrease in the number of agricultural cooperatives. The increasing intensity of food products imports through retail chains deepens the food dependence of the Slovak Republic on imported commodities, even though Slovakia also has suitable conditions for their production (Statistical Office SR, 2021).
Materials and Methods
Research Aim and Hypothesis
The aim of this paper is to identify the groups of financial ratios that can be used to measure the financial performance of the selected companies operating among Agriculture, forestry and fishing industry, specifically belonging to Class 01.11 od NACE Rev. 2-Growing of cereals (except rice), leguminous crops and oil seeds that are part of Division 01-Crop and animal production, hunting and related service activities and Group 01.1-Growing of non-perennial crops. For this purpose, factor analysis will be used, which belongs to the innovative statistical methods of financial management.
Research hypothesis H1 is formulated as follows:
H1 Financial ratios of the non-financial companies operating in the Slovak agriculture sector show common factors.
Research Sample
The research sample consists of 15 non-financial enterprises operating in the NACE Rev. 2 class 01.11 Growing of cereals (except rice), leguminous crops and oil seeds. Used financial data of 2019 were obtained through the Register of Financial Statements of the Slovak Republic. For each enterprise, we calculated seven financial ratios that were entering into the analysis. Used variables with the abbreviation and calculation formula are in the following Table 4.
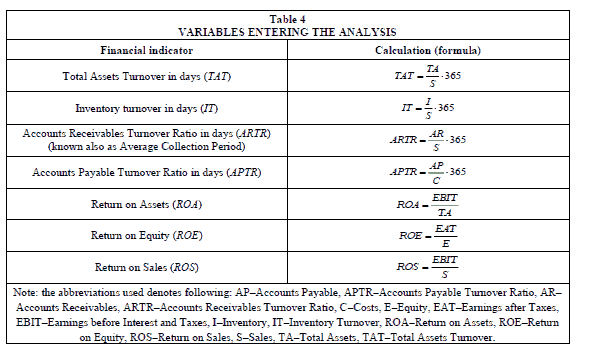
Turnover indicators express the average time that individual types of assets go from the moment of the start of production to its end. The firm aims to minimize turnover ratio indicators in days (Jencová, 2020). Return On Assets (ROA) measures the operating efficiency of the company and provides evidence as to how well are used the assets to generate income (Friedlob & Plewa, 1996). Return On Equity (ROE) indicates how much profit is generated with the money shareholders have invested in the firm (Fourmier, 2008, p. 207). Return On Sales (ROS) is used to evaluate the operational efficiency of the firm. It measures how much profit is being produced per euro of sales. In other words, how efficiently a company transforms sales into profits. ROS is sometimes called profit margin (Pride et al., 2010). Decreasing ROS could indicate impending financial problems (Štefko et al., 2021).
Methods
When applying the PCA or FA, it is common to start by examining the correlations between the data variables and end by analyzing the factor loadings, which can then be interpreted as correlations between the data variables and the hypothetical construct under study, i.e. "factors". The most used option when selecting variables is to perform the so-called analysis of the suitability (adequacy) of input variables (Khattree & Naik, 2000).
From the point of view of this possibility, the selected variables should be dependent because only then is it possible to reduce the dimension of the data. For this purpose, we use a correlation matrix analysis based on Kaiser-Meyer-Olkin (KMO) statistics (Kaiser, 1970), which compares simple pairwise correlation coefficients with partial correlation coefficients (Somarriba, 2009). KMO statistics are calculated as an overall measure of adequacy/suitability of sampling data for methods of dimension reduction and, at the same time, as a partial measure of adequacy for individual indicators. The result is a measure of the homogeneity of the variables. Large differences between the corresponding pairwise and partial correlation coefficients signal strong dependencies in the group of variables. When the value of KMO statistics reaches 0.9, we consider the data (and their correlation) to be very good, in the range from 0.6 to 0.9 as appropriate, with a value below 0.6 as sufficient and with values below 0.5 as inappropriate for dimension reduction methods (Vojtková, 2014; Hair et al., 2006). Moreover, we use Bartlett’s test of sphericity (Bartlet, 1950), while a p-value less than 0.05 indicates that factor analysis is suitable.
Since the factor structure for the Slovak agriculture sector was not already provided in previous studies, we use the explanatory FA and PCA extraction method. To find the best distribution of the factor loadings in terms of the meaning of the factors (Štefko et al., 2021; Reinard, 2006; Aczel, 1989), we use varimax rotation and factors with an eigenvalue greater than 1. We also use the scree plot to determine the isolation of factors.
Results and Discussion
First, we present the descriptive statistics of variables entering the analysis (see Table 5).
| Table 5 Descriptive Statistics |
||||
|---|---|---|---|---|
| Variable | Mean | Standard Deviation | Minimum | Maximum |
| TAT | 786.03 | 280.03 | 373.49 | 1398.40 |
| IT | 173.30 | 88.49 | 76.11 | 412.03 |
| ARTR | 86.545 | 57.04 | 17.78 | 189.98 |
| APTR | 349.46 | 190.75 | 41.05 | 676.76 |
| ROA | 0.0291 | 0.0277 | -0.0364 | 0.0985 |
| ROE | 0.0437 | 0.0352 | -0.0768 | 0.2036 |
| ROS | 0.0658 | 0.0475 | -0.0928 | 0.2410 |
Before we verify the established hypothesis by using factor analysis, we provide the correlation matrix (see Table 6) of relations between analyzed financial ratios.
| Table 6 Correlation Matrix |
|||||||
|---|---|---|---|---|---|---|---|
| Variable | TAT | IT | ARTR | APTR | ROA | ROE | ROS |
| TAT | 1 | ||||||
| IT | 0.3594 | 1 | |||||
| ARTR | 0.3035 | -0.1469 | 1 | ||||
| APTR | 0.1610 | -0.2380 | 0.4853a | 1 | |||
| ROA | 0.1043 | -0.0214 | 0.2124 | -0.2043 | 1 | ||
| ROE | 0.0648 | -0.0028 | 0.2095 | 0.0787 | 0.7950d | 1 | |
| ROS | 0.3862 | 0.1020 | 0.3444 | -0.1063 | 0.9239d | 0.7113d | 1 |
KMO statistics is equal to 0.515, which is sufficient for factor analysis. The p-value of Bartlett’s test of sphericity is equal to 0.0000 (χ2 (21)=54.606) and indicated that variables are inter correlated. The PCA solution with the minimum eigenvalue criterion of 1.0 for factor extraction shows three common factors (see Table 7 and scree plot in Figure 1). In order to interpret the FA solution more easily, we computed factor loadings after varimax rotation (see Table 8). Factor loadings represent the degree to which each of the financial ratios correlates with each of the factors. In Table 8, marked loadings are higher than 0.81. Extracted two factors explain 82.86% of the variance.
| Table 7 Eigenvalues |
||||
|---|---|---|---|---|
| Factor | Eigenvalue | Difference | Proportion | Cumulative |
| 1 | 2.8267 | 1.2109 | 0.4038 | 0.4038 |
| 2 | 1.6158 | 0.2580 | 0.2308 | 0.6346 |
| 3 | 1.3578 | 0.7914 | 0.1940 | 0.8286 |
| 4 | 0.5665 | 0.1245 | 0.0809 | 0.9095 |
| 5 | 0.4420 | 0.2758 | 0.0631 | 0.9727 |
| 6 | 0.1661 | 0.1410 | 0.0237 | 0.9964 |
| 7 | 0.0251 | . | 0.0036 | 1.0000 |

Figure 1:Scree Plot
| Table 8 Factor Analysis-Factor Loadings After Varimax Rotation |
|||
|---|---|---|---|
| Variable | Factor 1 | Factor 2 | Factor 3 |
| TAT | 0.1457 | 0.3422 | 0.8198 |
| IT | -0.0194 | -0.3355 | 0.8159 |
| ARTR | 0.2677 | 0.8123 | 0.1066 |
| APTR | -0.1528 | 0.8702 | -0.0753 |
| ROA | 0.9813 | -0.0644 | -0.0186 |
| ROE | 0.8730 | 0.0959 | -0.0731 |
| ROS | 0.9335 | 0.0863 | 0.2433 |
| Variance | 2.7132 | 1.6676 | 1.4196 |
| Difference | 1.0456 | 0.2493 | --- |
| Proportion | 0.3876 | 0.2382 | 0.2028 |
| Cumulative | 0.3876 | 0.6258 | 0.8286 |
We can confirm the hypothesis that financial ratios of the non-financial companies operating in the Slovak agriculture sector show common factors. According to the financial theory, resulting factors can be named as follows:
1. Factor of profitability. The first factor is composed of profitability ratios–return on assets, return on equity, and return on sales. This factor indicates the profit earning capacity of a business and determines how effectively a business uses its resources.
2. Factor of receivables and payables. The second factor is composed of accounts receivable turnover ratio in days (known as average collection period) and accounts payable turnover ratio in days. The average collection period measures how many days, on average, the enterprise’s credit customers take to pay their accounts (see Gallagher & Andrew, 2007).
3. Factor of activity. The third factor is composed of total assets turnover in days and inventory turnover in days. Activity ratios measure how efficiently a firm uses its assets (see Megginson et al., 2008).
According to the previous studies (see Literature Review), although different sectors (industries) were studied in each study, we see that we extracted consistent factors of profitability (Czillingová, Petruška & Tkác, 2012; Erdogan, 2013; Ming et al., 2014; Hornungová, 2015; Hornungová & Milichovský; 2016; Štefko et al., 2021) and activity (Öcal et al., 2007; Czillingová, Petruška & Tkác, 2012; Štefko et al., 2021). However, in this paper, there was another separate factor that was named as factor of receivables and payables. Usually, financial ratios that are included into this factor is part of the factor of activity. In future research, it would be interesting to examine whether the presented results will be the same for another period or for an extended research sample.
Conclusion
At present, it is in the interest of perhaps every enterprise to acquire new professional knowledge and skills in the field of management, implementation, maintenance, and increasing the efficiency of each enterprise's processes. One of the essential and innovative elements in financial management is the use of various advanced and multicriteria statistical methods. Statistical methods help to identify, analyze but also solve many managerial problems. New innovative elements of financial management bring managers the opportunity to modify traditional practices.
This paper identified the groups of financial ratios that can be used to measure the financial performance of the enterprises operating in the Slovak agriculture sector. Specifically, PCA and FA were used to verify the hypothesis that financial ratios of the non-financial companies operating in the Slovak agriculture sector show common factors. According to the Agriculture, forestry and fishing industry of NACE Rev. 2, in this paper, there were examined only enterprises from Class 01.11 od NACE Rev. 2-Growing of cereals (except rice), leguminous crops and oil seeds. Results of FA extracted three common factors (profitability, receivables and payables, and activity), which were composed of seven financial ratios: total assets turnover (in days), inventory turnover (in days), accounts receivables turnover ratio (in days), accounts payable turnover ratio (in days), return on assets, return on equity, return on sales. This analysis is an important prerequisite for implementing innovative statistical methods in developing a realistic financial plan for companies operating in the analyzed sector.
Acknowledgement
This paper was supported by the research grant VEGA No. 1/0741/20–The application of variant methods in detecting symptoms of possible bankruptcy of Slovak businesses in order to ensure their sustainable development.
References
- Aczel, A.D. (1989). Complete business statistics. Homewood: Irwin, PA, USA.
- Bartlett, M.S. (1950). Tests of significance in factor analysis. British Journal of Statistical Psychology, 3(2), 77-85.
- Błach, J. (2011). Financial innovations and their role in the modern financial system-identification and systematization of the problem. e-Finanse: Financial Internet Quarterly, 7(3), 13-26.
- Comrey, A.L. & L.B. Howard (1992). A first course in factor analysis, (2nd edition). New Jersey: Lawrence Erlbaum Asociates, Inc.
- Czillingová, J., Petruška, I., & Tkác, M. (2012). Financial and economic analysis of steel industry by multivariate analysis. Ekonomický casopis, 60(4), 388-405.
- Erdogan, A. (2013). Applying factor analysis on the financial ratios of Turkey’s top 500 industrial enterprises. International Journal of Business and Management, 8(9), 134-139.
- Fourmier, D. (2008). The young investor: The North American guide to investing online. Canada: Trafford.
- Friedlob, G.R. & Plewa Jr., F. J. (1996). Understanding return on investment. New York: John Wiley & Sons.
- Gallagher, T.J. & Andrew, J.D. (2007). Financial management: Principles and practice. St. Paul: Freeload Press.
- Hair, J.F., Black, B., Babin, B., Anderson, R.E. & Tatham, R.L. (2006). Multivariate data analysis. London: Pearson.
- Homsud, N., & Choksuchat, R. (2012). The operation efficiency evaluation by financial ratio of listed company in food and beverage industry by grey principal component analysis. European Journal of Economics, Finance and Administrative Sciences, 45, 148-152.
- Hornungová, J. (2015). Methodology for selection of economic performance factors in the area of information and communication activities. University of Agriculture and Silviculturae Mendelianae Brunensis, 63(2), 533-537.
- Hornungová, J., & Milichovský, F. (2016). Financial performance evaluation of the Czech agricultural companies with factor analysis. Scientific Papers of the University of Pardubice. Series D: Faculty of Economics and Administration, 23(37), 26-38.
- Jencová, S. (2018). Application of advanced methods in financial and economic analysis of the electrical engineering industry of the Slovak Republic. SAEI, 54. Ostrava: VSB-TU Ostrava.
- Jencová, S. (2020). Financial and economic analysis of business entities. Prešov: Bookman.
- Jolliffe, I.T. (2002). Principal component analysis, (2nd edition). New York: Springer-Verlag.
- Kaiser, H.F. (1970). A second generation little jiffy. Psychometrika, 35, 401-415.
- Khattree, R. & Naik, N.D. (2000). Multivariate data reduction and discrimination with SAS® software, (1st edition). Cary, NC: SAS Institute Inc.
- Král, P., Kanderová, M., Kašcáková, A., Nedelová, G., & Bojdová, V. (2009). Multidimensional statistical methods with a focus on solving problems of economic practice, (1st edition). Banská Bystrica: Matej Bel University, Faculty of Economics.
- Krzanowski, W.J. (2000). Principles of multivariate analysis: A user’s perspective, (2nd edition). New York: Oxford University Press Inc.
- Kubícková, D., & Jindřichovská, I. (2015). Financial analysis and evaluation of company performance, (1st edition). Praha: C.H. Beck.
- Li, Y., & Zhang, Q. (2011). The application of principal component analysis on financial analysis in real estate listed company. Procedia Engineering, 15, 4499-4503.
- Megginson, W.L., Smart, S.B., & Lucey, B.M. (2008). Introduction to corporate finance. Cengage Learning EMEA: London, UK.
- Ming, H., Juqin, S. & Lu, C. (2014). An empirical study of factor analysis on M&A performance of listed companies of Chinese pharmaceutical industry. Journal of Chemical and Pharmaceutical Research, 6(4), 963-968.
- Ministry of the Agriculture and Rural Development of the Slovak Republic (2020). Report on agriculture and food industry in the Slovak Republic for the year 2019.
- NACE. (2021). Statistical classification of economic activities in the European community.
- Nadkarni, J., & Ferreira Neves, R. (2018). Combining neuroevolution and principal component analysis to trade in the financial markets. Expert Systems with Applications, 103, 184-195.
- Nobre, J., & Neves, R.F. (2019). Combining principal component analysis, discrete wavelet transform and XGBoost to trade in the financial markets. Expert Systems with Applications, 125, 181-194.
- Öcal, M.E., Oral, E.L., Erdis, E., & Vural, G. (2007). Industry financial ratios—Application of factor analysis in Turkish construction industry. Building and Environment, 42(1), 385–392.
- Qu, M., & Li, Y. (2021). Financial risk early-warning model based on kernel principal component analysis in public hospitals. Mathematical Problems in Engineering, 2021, Article number 5525354.
- Pride, W.M., Hughes, R.J., & Kapoor, J.R. (2010). Business South-Western Cengage learning. Mason, USA.
- Register of the Financial Statements of the Slovak Republic (2021). Register of the financial statements of the Slovak Republic.
- Reinard, J.C. (2006). Communication research statistics. Sage Publications: Thousand Oaks, CA, USA.
- Sabau-Popa, C.D., Simut, R., Droj, L., & Bente, C.C. (2020). Analyzing financial health of the SMES listed in the aero market of bucharest stock exchange using principal component analysis. Sustainability, 12(9), Article number 3726.
- Somarriba, N., & Pena, B. (2009). Synthetic indicators of quality of life in Europe.
- Stankovicová, I., & Mojsejová, A. (2000). Index human development: evaluation and classification of European countries using multidimensional methods. Slovak statistics and demography, 30(3), 9-35.
- Stankovicová, I., & Vojtková, M. (2007). Multidimensional statistical methods with applications, (1st edition). Bratislava: Iura Edition.
- Statistical Office. (2021). Data cube. http://datacube.statistics.sk/
- Strapác, M. (2019). Agriculture sector in Slovakia. Bratislava: Euler Hermes.
- Štefko, R., Horváthová, J., & Mokrišová, M. (2020). Bankruptcy prediction with the use of data envelopment analysis: An empirical study of Slovak business. Journal of Risk and Financial Management, 13(9), 212.
- Štefko, R., Horváthová, J., & Mokrišová, M. (2021). The application of graphic methods and the DEA in predicting the risk of bankruptcy. Journal of Risk and Financial Management, 14(5), 220.
- Štefko, R., Vašanicová, P., Jencová, S., & Pachura, A. (2021). Management and economic sustainability of the Slovak industrial companies with medium energy intensity. Energies, 14(2), 267.
- Tung, C.T., Lee, Y.J., & Wang, K.H. (2009). Combining grey theory and principal component analysis to evaluate financial performance of the airline companies in Taiwan. Journal of Grey System, 21(4), 357-368.
- Vojtková, M. (2014). Analysis of the degree of attractiveness of national economies for foreign investors in the new globalized environment. Economic magazine, 62(6), 557-578.
- Yang, M., & Li, S.Z. (2017). Comparative Study of principal component and logistic regression analysis in financial early-Warning of listed companies in China´s garment industry. Journal of Beijing Institute of Clothing Technology, 37(4), 61-67.