Research Article: 2021 Vol: 25 Issue: 1S
Ipo Issuers Empire-Building and Cost Stickiness after the Offering: Evidence from Korea
Jeong-Ho Koo, Kumoh National Institute of Technology (KIT)
Daecheon Yang, Chung-Ang University
Keywords
Initial Public Offering (IPO), Cost Stickiness, Empire-building Behaviour
Abstract
The literature on managerial accounting documents that cost stickiness is asymmetric cost reduction not responding to demand declines, which is driven by empire-building behaviour undesirable for shareholders. We posit that cost stickiness is likely to be rampant around Initial Public Offering (IPO) firms, particularly in an emerging IPO market that the corporate governance structure weakens. This paper focuses on Korea's KOSDAQ market where IPOs have been frequent during recent decades because of the rapid growth of information technology and bio- industries. By using a sample of 14,424 firm-year observations from 2002 to 2016 in Korea's KOSDAQ market, we explore whether IPO issuers aggravate the degree of cost stickiness after the offering in comparison with their peer groups. Our results suggest that the cost stickiness of post-IPO firms is greater than that of non-IPO firms.
Introduction
Anderson, et al., (2003) empirically suggest the cost-stickiness phenomenon, in which costs act asymmetrically, falling less when demand decreases than rising when equivalent demand increases. As an agency explanation, it has been well documented that cost stickiness could result from empire-building behaviours for increasing managerial personal utility from status, power, and resources (Chen et al., 2012). Managers' empire-building tendencies could cause their companies to grow up beyond the optimal level, retain over-slack, and thus lead to excessive costs that should otherwise be cut.
Specifically, this cost stickiness phenomenon might be pervasive around initial public offering (IPO) firms. During the IPO offering, high information asymmetry occurs between issuers and investors (Teoh et al., 1998a, b) and issuers may have great opportunities to pursue empire-building under the pretext of the expansion of firms. Post-IPO firms might be highly susceptible to cost stickiness. Moreover, IPO environments might provide IPO issuers with a possible source of unwarranted optimism in the growth of companies (Teoh et al., 1998a; Shu et al., 2012). Empire-building issuers are expected to overestimate the growth of their young companies and overinvest beyond the optimal level with strong reluctance to downsize, thus inducing greater cost stickiness.
This paper centres on Korea's KOSDAQ market, where IPOs have been frequent during recent decades because of the rapid growth of information technology and bio- industries. The data obtained from the KOSDAQ’s IPO firms facilitates the observation of issuers' empire-building. In this study, we explore whether IPO issuers trigger the cost stickiness problem arising from empire-building opportunities after the offering. By using a sample of 14,424 firm-year observations covering post-IPO’s 1,308 firm-year observations during the period 2002–2016, we find that the cost stickiness of post-IPO firms is greater than that of non-IPO firms. This paper contributes to the literature by suggesting new evidence of IPO issuers’ reinforcing cost stickiness, which might result in excessive costs associated with over-slack so as not to be suboptimal to shareholders. We believe that the high asymmetry during the IPO offering raises the necessity of an active governance structure that restrains the wasteful managerial spending of valuable economic resources.
Theory and Proposition
By Anderson et al. (2003), cost-stickiness is defined as the phenomenon that operational costs increase when sales increase but does not decrease to the same extent when sales decline. Subsequent empirical studies demonstrated that cost stickiness is pervasive under various settings (e.g., Balakrishnan et al., 2004; Banker & Chen, 2006; Anderson et al., 2007; Weiss, 2010; Chen et al., 2012; Chen et al., 2013; Banker et al., 2014; Via & Perego, 2014; Yang, 2015). Relevant studies describe cost stickiness as asymmetric cost reduction that is derived from managers’ decision-making that pursue private utilities (e.g., Balakrishnan & Gruca, 2008; Chen et al., 2012; Dierynck et al., 2012; Kama & Weiss, 2012). In particular, Chen et al., (2012) specify that managers' empire-building, which reflects an unwarranted taste for larger firms, induces them to retain unutilized slack.
These empire-building preferences, addressing the agency problem, are expected to be greater under the context of high information asymmetry. It is well known that startup and growth companies are the most prone to asymmetric information (Fazzari et al., 1988; Hoshi et al., 1991). In particular, high asymmetry of information exists between IPO issuers and investors (Teoh et al., 1998a, b). This high asymmetry causes the issuer's empire-building behaviour to be undesirable to investors, particularly with the pretense of the expansion and growth of firms going public.
During and after the offering, all the participants tend to be overwhelmed by the atmosphere of rapid growth and the IPO issuers be intoxicated by post-IPO' prosperity. Our proposition concerns the possibility of the stickier costs of post-IPO firms compared with those of non-IPO firms. IPO issuers may pursue an excessive tendency to run large firms, using considerable information asymmetry. We expect that IPO issuers are more likely to run an oversized firm by retaining over-capacities and induce a greater degree of cost stickiness. Thus, we verify whether the cost stickiness of post-IPO firms is greater than that of non-IPO firms.1
Methodologies, Data and Statistics
Based on Anderson et al. (2003)’s model, we estimate a time-series regression at the firm-year level as the following:

Where, ΔCosti,t is the natural logarithm of change (Costi,t/Costi,t–1) in the cost elements of firm i in year t; ΔSalei,t is the natural logarithm of change (Sale,t/Salei,t–1) in sales in year t relative to year t–1; and DDi,t is the dummy variable that takes 1 if sales decrease (Salei,t<Salei,t–1), and zero otherwise.
According to this model, if β1 coefficient has a significantly positive value, a significantly negative β2 coefficient captures downwardly sticky costs where sales decrease.
Then, we separately include an IPO variable in Eq. (1) and interact it with other independent variables (see Eq. 2). In our test, the timeline of the post- IPO periods is the fiscal year including the IPO date and the subsequent year. In Eq. (2), the negative ��4 coefficient on Δ��������i�� * ����i�� * �������� − ������i�� implies that a firm's IPO intensifies the cost stickiness (if ��2<0) or a firm's IPO pushes SG&A costs in a downwardly sticky direction (if ��2>0).
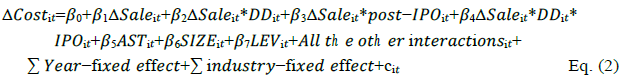
Where, post-IPO is a dummy variable that takes the value of 1 if the period t is the fiscal year including the IPO date or the subsequent year in post-IPO firm i and zero otherwise (i.e., industry control firm) for the equivalent periods. We control for the one-year change in asset intensity (ASTit), book value of assets (SIZEit), and book value of debts divided by the book value of assets (LEVit) (see Chen et al., 2012; Yang, 2015). ASTit is calculated as the ratio of total assets divided by sales revenue; SIZEit is calculated as the book value of assets; and LEVit is calculated as the book value of debts divided by the book value of assets. All the control variables are converted to the natural logarithm value to be normally standardized.
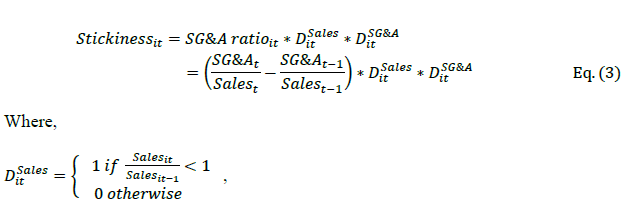
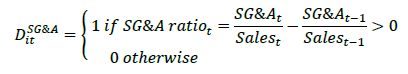
Next, we alternatively employ a cost-stickiness model developed by Homeburg and Nasev (H&N) (2008). Homburg and Nasev (2008) measure cost stickiness (Stickiness) as the positive cost-to-sale ratio (SG&A ratio) conditional on decreasing sales. In Eq. (3), the positive value of Stickiness means the cost stickiness and the degree of cost stickiness increase as its value increases.
Then, we adopt the following fixed-effects H&N regression by using Stickiness as the dependent variable. In Eq. (4), the value of the β_1 coefficient on Post-IPO is expected to be positive, thus suggesting the greater cost stickiness in Post-IPO firms.

Here, post-IPO is a dummy variable that takes the value of 1 if the period t is the fiscal year including the IPO date or the subsequent year in post-IPO firm i, and zero otherwise (i.e., industry control firm) for the equivalent periods. Refer to Eq. (2) for the definitions of other variables.
Our data strategies are as follows. We obtain IPO data together from the KIND system of the Korea Exchange and DART system provided by the Financial Supervisory Service of Korea during the period 2002–2016. Our cost and financial data are drawn from the intersection of Kis-Value II, TS 2000, and Dataguide Pro. (ver. 3) of FnGuide for companies listed in the KOSDAQ market. Our final sample consists of 14,424 firm-year observations covering the post-IPO sample of 1,308 firm-year observations.
In relation to the post-IPO firm sample, Panel A of Table 1 provides descriptive statistics for all the variables used in the regressions. The average of ΔSale is 0.1137, representing an 11.37% sale increase from the previous period. Also, the average of ΔCOST is 0.2068, indicating that the SG&A cost increased by 20.68% from the previous year. Meanwhile, the natural log of assets/sales, which is one of the main controls, shows an average value of 0.2285.
| Table 1 DESCRIPTIVE STATISTICS | |||||
|---|---|---|---|---|---|
| <Panel A> Descriptive statistics of the post-IPO sample | |||||
| Mean | Std. Dev. | 1st Quartile | Median | 3rd Quartile | |
| ΔSale | 0.1137 | 0.4034 | -0.0435 | 0.1118 | 0.2537 |
| ΔCost | 0.2068 | 0.3038 | 0.0577 | 0.1835 | 0.3224 |
| DD | 0.2973 | 0.4572 | 0 | 0 | 1 |
| HN Stickiness | 0.0196 | 0.0545 | 0 | 0 | 0.005 |
| AST | 0.2285 | 0.5431 | -0.1546 | 0.2106 | 0.5599 |
| SIZE | 24.563 | 0.7285 | 24.0497 | 4.5323 | 25.0239 |
| LEV | 0.3055 | 0.178 | 0.1627 | 0.2809 | 0.5494 |
| <Panel B> Descriptive statistics of the full sample | |||||
| Mean | Std. Dev. | 1st Quartile | Median | 3rd Quartile | |
| ΔSale | 0.128 | 0.44409 | -0.0531 | 0.0924 | 0.2677 |
| ΔCost | 0.1218 | 0.37234 | -0.0264 | 0.0986 | 0.2495 |
| DD | 0.3222 | 0.46734 | 0 | 0 | 1 |
| HN Stickiness | 0.0174 | 0.0602 | 0 | 0 | 0.0011 |
| AST | 0.1928 | 0.65807 | -0.2202 | 0.1379 | 0.5352 |
| SIZE | 24.5868 | 1.15058 | 23.9408 | 24.6949 | 25.3017 |
| LEV | 0.4173 | 0.21931 | 0.2461 | 0.41111 | 0.5678 |
| This table summarizes the descriptive statistics of the dependent and independent variables for the full sample of 14,424 firm-years and the post-IPO sample of 1,308 firm-year observations, sourced from the intersection of Kis-Value II, TS 2000, and Dataguide Pro. (ver. 3) of FnGuide over the period 2002–2016. | |||||
Results
If IPO issuers pursue their empire-building preferences after their firms go public, we can expect a greater level of cost stickiness in post-IPO firms. To examine this conjecture, we run fixed-effects panel estimations based on Anderson et al. (2003) and H&N (2008), respectively.
Table 2 presents the estimates for panel regressions based on Eq. (2). In Col. (1), the results of the baseline model show the significantly positive (��1) coefficient estimate of ΔSale and positive (��2) coefficient estimate of the interaction of the change in costs and the sale decrease dummy (ΔSale × DD). The results suggest that SG&A costs are downwardly elastic in response to sale change in firms listed in the KOSDAQ market.
| Table 2 | |||
|---|---|---|---|
| EFFECT OF IPO ON COST STICKINESS | |||
| Baseline model Col. (1) | Post-IPO Col. (2) | ||
| Predicted signals | Estimate (t-stat) | Estimate (t-stat) | |
| Intercept | 0.4925 (8.46)*** | 0.4919 (8.47)*** | |
| ∆Sale | 0.4237 (54.00)*** | 0.4207 (53.48)*** | |
| ∆Sale × DD | (+/-) | 0.0283 (1.74)* | 0.0444 (2.71)*** |
| ∆Sale × IPO | 0.2300 (5.23)*** | ||
| ∆Sale × DD ×post-IPO | (-) | -0.6084 (-8.48)*** | |
| AST | -0.0282 (-6.6)*** | -0.0276 (-6.48)*** | |
| SIZE | -0.0168 (-7.19)*** | -0.0170 (-7.27)*** | |
| LEV | -0.0115 (-0.95) | -0.0049 (-0.40) | |
| All the interaction terms | Yes | ||
| Year-fixed effects | Yes | Yes | |
| Industry-fixed effects | Yes | Yes | |
| N | 14,424 | 14,424 | |
| Adjusted R2 | 0.2946 | 0.2979 | |
| Note: This table presents the estimation results for the panel regression for the effects of IPO on the degree of cost stickiness. Cost stickiness is measured based on the method of Anderson et al. (2003). post-IPO is a dummy variable that takes the value of 1 if the period t is the fiscal year including the IPO date or the Subsequent year in post-IPO firm i, and zero otherwise (i.e., industry control firm) for the equivalent periods. ***, **, and * indicate statistical significance at the 1%, 5%, and 10% levels, respectively. |
|||
Next, in post-IPO periods, the results of Col. (2) show that β4 of ΔSale × DD × post-IPO is significantly negative (coefficient=−0.6084, t=−8.48) given a significantly positive β1 of ΔSale and positive β2 of ΔSale × DD. Thus, the results reveal that the SG&A costs in post- IPO firms are downwardly sticky, unlike the case of industry-controlled firms.
We run the alternative cost-stickiness model developed by H&N (2008) using Eq. (4). Our fixed-effects H&N specification could directly capture the impact of IPO on the change in the magnitude of cost stickiness without using many interactions. Table 3 reports the estimates for fixed-effects H&N regressions. The result shows that the β1 coefficient of post-IPO has a significantly positive value (coefficient=0.0065, t=2.96), thus revealing greater cost stickiness in post-IPO firms. The result is qualitatively are same compared with that of prior test in Table 2.
| Table 3 | ||
|---|---|---|
| IPO AND H&N'S STICKINESS | ||
| Predicted signals | H&N's Stickiness |
|
| Estimate (t-stat) | ||
| Intercept | 0.1746 (16.82)*** |
|
| Post-IPO | (+) | 0.0065 (2.96)*** |
| AST | 0.0289 (38.71)*** |
|
| SIZE | -0.0069 (-16.57)*** |
|
| LEV | 0.0180 (8.1)*** | |
| Industry-fixed assets | Yes | |
| Year-fixed effects | Yes | |
| N | 14,424 | |
| Adjusted-R2 | 0.097 | |
Conclusion
The literature on managerial accounting addresses that cost stickiness is a asymmetric cost reduction which might stem from by empire-building behaviour. We extend the literature by investigating the existence of the stickier costs in post-IPO firms. Hence, we postulate that IPO issuers are likely to pursue their empire-building behaviours by utilizing considerable information asymmetry during and after the offering and thus induce a greater degree of cost stickiness. As expected, the results suggest that cost stickiness is greater for post-IPO firms than for non- IPO firms. This important conclusion is robust to alternative methodologies for measuring the degree of cost stickiness.
Acknowledgement
• This work was supported by the Ministry of Education of the Republic of Korea and the National Research Foundation of Korea (NRF-2020S1A5A2A01044196)
• Address correspondence to Daecheon Yang, School of Business Administration, Chung-Ang University, Seoul Korea. E-mail: dcyang@cau.ac.kr
References
- Anderson, M., Banker, R., & Janakiraman, S. (2003). Are selling, general and administrative costs ‘sticky’? Journal of Accounting Research, 41(1), 47-63.
- Anderson, M., Banker, R.D., Huang, R., & Janakiraman, S.N. (2007). Cost behaviour and fundamental analysisof SG&A costs. Journal of Accounting, Auditing & Finance, 22(1), 1-28.
- Balakrishnan, R., Petersen, M., & Soderstrom, N. (2004). Does capacity utilization affect the “stickiness” ofcost? Journal of Accounting, Auditing & Finance, 19(3), 283-299.
- Balakrishnan, R., & Gruca, T. (2008). Cost stickiness and core competency: A note. Contemporary AccountingResearch, 25(4), 993-1006.
- Balakrishnan, R., Labro, E., & Soderstrom, N. (2014). Cost structure and sticky costs. Journal of ManagementAccounting Research, 26(2), 91-116.
- Banker, R.D., & Chen, L. (2006). Predicting earnings using a model based on cost variability and cost stickiness. The Accounting Review, 81(2), 285-307.
- Banker, R.D., & Byzalov, D. (2013). Asymmetric cost behaviour. Working paper, Temple University.
- Banker, R.D., Fang, S., & Mehta, M. (2013). Cost behaviour during the world economic crisis. Working paper, Temple University.
- Banker, R., Byzalov, D., Ciftci, M., & Mashruwala, R. (2014). The moderating effect of prior sales changes on asymmetric cost behaviour. Journal of Management Accounting Research, 26(2), 221-242.
- Chen, C.X., Lu, H., & Sougiannis, T. (2012). The agency problem, corporate governance and the asymmetrical behaviour of selling, general, and administrative costs. Contemporary Accounting Research, 29(1), 252-282.
- Chen, C.X., Gores, T., & Nasev, J. (2013). Managerial overconfidence and cost stickiness. Working Paper, University of Illinois at Urbana-Champaign.
- Dierynck, B., Landsman, W.R., & Renders, A. (2012). Do managerial incentives drive cost behaviour? Evidence about the role of the zero earnings benchmark for labor cost behaviour in Belgian private firms. The Accounting Review, 87(4), 121-146.
- Fazzari, S., Hubbard, R., & Petersen, B. (1988). Financing constraints and corporate investment. Brookings Papers on Economic Activity, 1988(1):141-95.
- Homeburg, C., & Nasev, J. (2008). How timely are earnings when costs are sticky? Implication for link betweenconditional conservatism and cost stickiness. Working Paper, University of Cologne.
- Hoshi, T., Kashyap, A., & Scharfstein, D. (1991). Corporate structure, liquidity, and investment: Evidence from Japanese industrial groups. The Quarterly Journal of Economics, 106(1), 33-60.
- Kama, I., & Weiss, D. (2012). Do earnings targets and managerial incentives affect sticky costs?. Journal of Accounting Research, 51(1), 201-224.
- Kim, J., Yang, D., & Baik, S. (2012). Asymmetric cost behaviour of initial public offering Firms. Korean Business Education Review, 27(6), 101-125.
- Kim, et al. (2012). Investigated the degree of cost stickiness centering around pre-IPO firms and industry control firms for the equivalent periods during the 2001-2008 period.
- Shu, P.G., Chiang, S.J., & Lin, H.Y. (2012). Earnings management, managerial optimism and IPO valuation. The Journal of Behavioural Finance, 13(2), 147-161.
- Teoh, S., Welch, I., & Wong, T.J. (1998a). Earnings management and the long-run market performance ofinitial public offerings. The Journal of Finance, 53(6), 1935-74.
- Teoh, S.H., Wong, T.J., & Rao, G.R. (1998b). Are earnings during initial public offerings opportunistic? Reviewof Accounting Studies, 3, 175-208.
- Via, N.D., & Perego, P. (2014). Sticky cost behaviour: Evidence from small and medium sized companies. Accounting and Finance, 54(3), 753-778.
- Weiss, D. (2010). Cost behaviour and analysts' earnings forecasts. The Accounting Review, 85(4), 1441-1471. Yang, D. (2015). Mergers, CEO hubris, and cost stickiness. Emerging Markets Finance & Trade, 51(5), S46-S63.