Research Article: 2020 Vol: 24 Issue: 1S
Key Factors Affecting Earning Management of Real Estate Listed Firms In Vietnam
Pham Tuan Anh, Thuongmai University
Abstract
The paper focuses on analyzing the impact of financial factors on the earning management of real estate companies listed on Vietnam's stock market. The study uses OLS estimation method based on data from financial statements of 58 real estate enterprises listed on Vietnam's stock market (in the period of 2013-2018). The research results show that there exists a statistically significant relationship between ROA, ROE and CR with DA. At the same time, listed real estate companies have heterogeneous levels of earnings management during the research period. Research findings are the basis for real estate business executives to provide the most effective financial management solutions; harmonize settlement of interests between the company and its managers and shareholders, and also serve as a basis to help real estate stock investors to make decisions on investing in companies with effective financial management. The research results are also the basis for making recommendations to the company control board to balance the interests of the parties related to earning management.
Keywords
ROA, ROE, Total accruals, Discretionary accruals.
Introduction
The real estate market is important, especially for a developing country like Vietnam. The development of the real estate market is closely related to the development of the construction market, the market of construction materials, the labor market.
Real estate businesses not only create more housing, more real estate to invest in the economy, but also allow other supporting industries to develop: construction materials, design, construction, banking and finance, interior business, insurance.
Therefore, stocks of real estate businesses also always attract investors, with the desire to have good opportunities to increase assets in the stock market.
Since the beginning of 2020, the outbreak of the COVID-19 epidemic has caused some disruptions to the real estate market and the reaction of investors in real estate stocks has clearly shown a cautious trend. Real estate market activities slowed down in the first quarter of 2020, but international investors already present in Vietnam continued to search for properties or cooperate with reputable domestic businesses. The difference in this phase is that they increase the level of caution more than before.
In the context that the Vietnamese government has well controlled the COVID-19 epidemic, investment psychology will improve. The real estate sector will continue to attract investors as Vietnam's government policy reforms are considered to be quality, stable and help real estate market become more and more sustainable.
Although the worry about the disease has subsided, cautious investors still have traditional concerns, one of the biggest concerns is the management of the profits of listed real estate companies in Vietnam.
Profit plays an important role in the production and business activities of the enterprise, both as a goal, as well as a motivation and a condition of existence and development of the business. The continuous improvement of profits is to ensure business efficiency demonstrating the capacity and level of production management of the production and business management staff in the enterprise. In terms of market-driven business, a profit-making enterprise proves to be adaptable to the market mechanism. Therefore, creating a profit is the ultimate goal of businesses.
Earning management is the means for business managers to develop profits and attract investment. However, earning management is affected by a number of factors in which the factors within the business are most obvious. Identifying and overcoming those factors are necessary for each business to reduce difficulties in the earning management process.
In this context, the study of the influence of internal factors on the earning management of real estate enterprises listed in the financial market is not only meaningful to corporate executives. in this sector, it also makes sense for investors interested in real estate stocks.
Literature Review
The Concept, Purpose and Methods of Earning Management
Earning management is to achieve the target profit. Earning management behavior of business managers in different stages has different motives to achieve certain goals. In Vietnam, the purpose of profit adjustment is usually: contracts, remuneration and bonuses, balancing profits between accounting periods, avoiding credit contract violations, attracting investment, issuing bonds. Stocks to the public, meet the expectations of market analysts, change managers.
According to Cohen & Zarowin (2010), earning management (EM) is divided into two basic categories: Earning management through accrual accounting variables and manage profits through mediation of actual transactions. One of the important factors that attracts the attention of investors is the profitability index, which evaluates business performance and growth prospects of the business. Investors tend to invest in businesses with economic efficiency and high growth prospects. Therefore, businesses, especially listed companies, tend to exaggerate business results in important periods. There are many reasons why business executives are always looking for every possible way to transfer profits between years through Earning management. Recognizing the factors that affect the management's Earning management and how the adjustment techniques will help the information users, especially investors, get accurate information to make right decisions.
There are many ways to conduct corporate earning management:
1. Accounting policy for inventories: selecting the method of calculating the cost of products and the method of evaluation of uncompleted products may change product prices, thereby being able to adjust the cost of goods sold; Selecting the method of calculating the cost of inventory can change the cost of goods sold in the period; changes in selling prices and estimated expenses to change the level of provision, to adjust expenses in the period;
2. Policy on setting up receivable bad debts provision: It is possible to adjust expenses and profits through the estimation of the extent of losses on undue debts and adjusting the provision for doubtful debts. ;
3. Policy on provision for devaluation of financial investment: may make provision less than necessary or increase provision level more than necessary to adjust costs and profits;
4. Policies on fixed assets accounting: based on asset recognition standards to adjust whether the assets are recognized as an asset or an expense; select depreciation methods or estimate the useful life of assets to adjust costs; Select the scale, nature of repair and number of periods appropriated or allocated to adjust costs; choose the time of buying or liquidating assets to adjust revenue and expenses;
5. Policy on prepayment of expenses: selecting the number of allocation periods will actively adjust the cost of each period;
6. Recognition of accrued expenses, payables provisions, unemployment fund: select the level of appropriation, reimbursement through the estimated values which can adjust the company's cost.
The relationship between internal factors and corporate earning management (EM) has attracted the attention of many researchers. The empirical research results show many heterogeneous conclusions about the influence of internal factors on the earning management of enterprises in different markets around the world.
One of the typical works showing that the result is the study of Muhammad Awais Akram et al. (2015) on the factors affecting the income management of 20 listed companies of Karachi Stock Exchange (Pakistan) and 20 of Bombay Stock Exchange (India) for the period of 2009-2013 and concluded: OLS technique was applied for hypothesis testing. This study indicates that there is a significant negative relationship between earnings management and organizational performance in Pakistan. On the other hand, there is an insignificant relationship between earnings management and organizational performance in India. Moreover, there is a significant mean difference of Pakistani and Indian construction sector firms’ discretionary accruals, return on assets and return on equity.
In addition, Nico Alexander & Hengky (2017) studied the effects of growth, leverage, fixed asset sales, profitability, firm size, firm age, industry, audit quality and Independent auditor in earning management. The sample used in this study is 309 data and the results show that from 9 variables, only profit has a positive impact on income management. Growth, leverage, fixed asset sales, size, age, audit quality, and the independence of the auditor and the industry have no effect on income management. Managers in a company will be involved in earnings management to receive bonuses from investors because they have received higher profits.
According to Gill et al (2013), the more intense the practice of earnings management, the greater it’s adverse effect on corporate rate of return on assets in the following year. They also found that to some extent, the market realizes that management acts with selfish motives and responds by lowering share prices and corporate market value. Their study contributes to the literature on the association between several features of earnings management and firm performance, and the value of the firm. It is confined to Indian firms where companies perform intense earnings management. The findings may be useful for financial managers, investors, financial management, consultants, and other stakeholders.
In fact, there exist different points of view in the studies on the effect of financial leverage on EM. However, most studies consider financial leverage as one of the key variables affecting EM.
Firm size may influence earnings management decisions. The bigger the business, the more distance there can be between the owner and the manager. The larger the gap, the more likely concerns that a manager might pursue an attractive personal interest that ignores the interests of shareholders and the company. On the other hand, the larger the business size, the higher the expected profit forecast. Barton & Simko (2002), point out that large enterprises face a lot of pressure to meet the demands of analysts as well as investors. Myers et al. (2007), demonstrated that the larger the business, the more inaccurate it is reported. Thus, Firm size is one of the factors positively affecting earning management decisions.
As can be seen, although the research works are conducted on different samples, in different markets and different time periods, they have the basic things in common:
1. The studies used a combination of qualitative analysis techniques and quantitative analysis techniques. In particular, qualitative research is used to identify problems, build research models; and quantitative techniques are used to test the research models and hypotheses.
2. The studies mainly exploit secondary data collected from financial statements, annual reports of companies listed on the stock market. The selection of listed companies facilitates data collection due to information transparency requirements.
3. Most studies use descriptive statistical analysis, correlation analysis and multivariate linear regression analysis with Balanced Panel data.
Research Design
Research approach
The process of analyzing the literature review of works related to the research topic of the topic shows that the research strategy used by the majority of researchers is based on secondary financial data. issued and collected from the financial statements of listed enterprises, which are officially announced according to the current law provisions of the host countries. Regarding the frequency of data usage, to ensure the centralized and orthodoxity of the data used, and at the same time overcome the seasonality of the research data due to the focused research topic, clarifying the influence of governance of capitalism refers to the rate of return of listed firms within the scope of the research, so while periodic data can be accessed, this study still uses the frequency of access. annual data, both to fix the seasonality, and to ensure the ability to cross-check data cross-checking between enterprise financial parameters and official information published in the report. Annually, audited financial statements of listed businesses within the study area. Secondary data, after being collected and cleaned, will be used as an input to quantitative analysis techniques using appropriate informatics tools. The research strategy is mainly based on secondary data from financial reports, annual reports, and market reports, allowing this research to come up with general conclusions, helping to visualize the overall picture of the whole market, creating a basis for measuring earning management and exploring the relationship between earning management and some internal elements of corporate finance of real estate firms currently listed in Vietnam.
Research models
This research use Modified Jones model to calculate the level of earning management of real estate businesses currently listed on Vietnam's stock market,
Where: 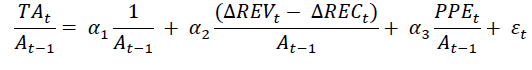
 Total accruals in the year t (Dependent variable of the model)
 Total asset in the year (t-1)
 Change in revenue from year t to year (t-1)
 Short-term receivables change from year t to year (t-1)
 Fixed assets in the year t
 The parameters need to be estimated
 errors of the model
Subsequently, the regression of the Modified Jones model in accordance with the regression technique appropriated with the balanced data will allow the procedure of extracting the residual value of each observation, which reflects the earning management situation. The residual values are extracted from the regression results assigned to the variable DA (Table 1).
| Table 1 Description of Research Variables | |
| Variable | Formula |
| TA | ΔCA-ΔC-ΔCL+DCL-Dep |
| ΔreV | Net Salet – Net Salet-1 |
| ΔreC | Short-term ARt - Short-term ARt-1 |
| PPE | Fixed assets |
| DA | residual values are extracted from the Modified Jones regression results |
| ROA | Total profit before tax / Total assets |
| ROE | Total profit after tax / Total Equity |
| FS | Ln(Total Assets) |
| FL | Total Debt/Total asset |
| CR | (Current assets - Current liabilities)/ Total assets |
| Source: Research design of the author | |
To consider the relationship between internal financial variables and earning management of listed companies in the real estate industry, the following two research models:
(1) DAit = β0 + β1*ROAit + β2*FLit + β3*CRit + β4*FSit + ui
(2) DAit = β0 + β1*ROEit + β2*FLit + β3*CRit + β4*FSit + ui
Data and Methods
Data
The study was conducted based on secondary data collected from financial statements, prospectus and annual reports of real estate joint stock companies currently listed on Vietnam's stock market. with frequency of once a year based on figures published at the end of the year.
Actual data survey shows that, from 2009 to 2019, the data lacks uniformity among companies. Many cases of data are missing, or there is no data, so the author decided to collect the data of listed companies in the real estate industry from 2013 to the end of 2018. Research data is the balanced-panel data of 58 companies from 2013 to 2018, with a total of 348 observations. The internal financial information of 58 real estate companies was checked against the financial statements, annual reports for 6 years from 2013 to 2018.
Analysis Method
First, the author uses descriptive statistics to see the basic characteristics of the data collected in order to have the most general view of the sample. Through description and statistical summary of independent and dependent variables of real estate enterprises listed on the Vietnam Stock Exchange in the period of 2013-2018, we found the average value, the largest value and the smallest of each study variable; The range of variance between the minimum and maximum value.
Modified Jones model is used with OLS regression technique after which the extracted amount shows the value of DA variable (earning management measured variable)
Next, correlation analysis is used to detect the relationships in each pair of research variables, focusing on the relationship between DA and each remaining research variable.
Finally, regression models were implemented to find the impact of internal financial factors on the DA.
Findings and Discussion
Descriptive Statistics
The study also examines the financial status of 58 real estate companies listed on Vietnam's stock market from 2013 to 2018, reflected by descriptive statistical values of the research variables including CR, FL, FS, ROA and ROE.
The earning management status of companies in the study area was analyzed through descriptive statistical values of TA and DA variables.
Descriptive statistical values of each variable are presented in the following data Table 2.
| Table 2 Descriptive Statistical Values of Variables | |||||||
| TA | DA | CR | FL | FS | ROA | ROE | |
| Mean | 0.024177 | 1.29E-17 | 0.244867 | 0.551042 | 14.52669 | 0.030775 | 0.035302 |
| Median | 0.00238 | -0.02006 | 0.241923 | 0.587394 | 14.39977 | 0.026379 | 0.056017 |
| Maximum | 1.189529 | 1.161492 | 0.828331 | 0.946017 | 19.47838 | 0.610223 | 0.790978 |
| Minimum | -1.03103 | -1.0189 | -0.49611 | 0.01099 | 11.34789 | -0.82252 | -3.16863 |
| Std. Dev. | 0.22492 | 0.222465 | 0.265109 | 0.196128 | 1.454296 | 0.086989 | 0.32018 |
| Observations | 348 | 348 | 348 | 348 | 348 | 348 | 348 |
| Source: research data processing results | |||||||
Based on the research data, we can see some of the following highlights:
Regarding TA (total accrual), the study of 348 observations on real estate companies listed on the stock market of the real estate industry had an inconsistent level of accrual in the research period, average value. The cumulative average is 2% of the total assets of the previous year, while the highest and lowest values are very far apart, there are companies at one point of view that have a very large negative (-) cumulative value, deviation. TA standards are also high (over 22% of total assets of the previous year).
Meanwhile, the average value of ROA and ROE of real estate enterprises in the research period were above 3%, low but still not negative, and the ROE was slightly higher than the ROA somewhat. The fact that real estate businesses do not generate a high return on total assets but still try to take advantage of the leverage to earn a slightly better ROE than ROA.
With the characteristics of the real estate industry, businesses largely depend on loans. This fact also shows the descriptive statistical values for the variable Financial Leverage (FL), the highest value of FL up to 94.6% (DLR company in 2018), the lowest is 1 , 09% (IDJ company 2015), and the average value of FL is 55.1% and the standard deviation is approximately 19.6%. The data show the similarity of the majority of companies in the sample observed about the use of large financial leverage in real estate businesses.
Despite the high use of loans, the current solvency of the businesses in the study area is at a high level of safety. The average value of CR reached over 24% of total assets, the lowest was -24% but the highest value reached over 82%, this shows that real estate businesses in the study area although use a large leverage, but at the same time ensure a good current solvency.
The statistical analysis values describing the DA variable show that the situation of the earning management of real estate enterprises in the research scope is not really worrying, in terms of average. The average value of the observed DA is very small, no matter what regression technique. However, the standard deviation of the DA variable is very high, showing the heterogeneity of DA data obtained from 58 real estate listed companies during the period from 2013 to 2018. In particular, the lowest observed value of DA is -100% while the highest observed value of the DA is + 116%.
Correlation Between Research Variables
To discuss the relationship between financial factors within the company and corporate profit management, the study was based on analyzing the correlation coefficient between the DA and each independent research variable in the research model.
The data of correlation analysis between the study variables are detailed in the Data Table 3 below.
| Table 3 Correlation Coefficient for each pair of Research Variables | ||||||
| Correlation | ||||||
| Probability | DA | CR | FL | FS | ROA | ROE |
| DA | 1 | |||||
| ----- | ||||||
| CR | 0.355495 | 1 | ||||
| 0 | ----- | |||||
| FL | -0.06335 | -0.20787 | 1 | |||
| 0.2385 | 0.0001 | ----- | ||||
| FS | 0.039774 | 0.122217 | 0.175991 | 1 | ||
| 0.4595 | 0.0226 | 0.001 | ----- | |||
| ROA | 0.198001 | 0.225009 | -0.15304 | 0.133689 | 1 | |
| 0.0002 | 0 | 0.0042 | 0.0126 | ----- | ||
| ROE | 0.211051 | 0.236492 | -0.11985 | 0.16296 | 0.705589 | 1 |
| 0.0001 | 0 | 0.0254 | 0.0023 | 0 | ----- | |
| Source: research data processing result | ||||||
The statistically significant correlation coefficient between ROA and ROE is very high (0.705589), showing that the initial research model design choice is reasonable. The introduction of ROA and ROE variables into two different models (model 1 and model 2) has helped to avoid multi-collinear phenomena due to the high correlation coefficient between ROA and ROE.
The analysis results do not find correlation coefficients between DA and FL as well as between DA and FS, because the p-value of the correlation coefficients is greater than 0.05. Therefore, there is no statistically significant evidence to evaluate the relationship between the DA and FL as well as there is no statistically significant evidence to evaluate the relationship between the DA and the FS.
The correlation coefficient between DA and ROA is positive (+) and the correlation coefficient between DA and ROE is also positive (+) at slightly higher level than ROE, but all are low, showing the relationship between DA with ROA and the relationship between DA and ROE, although supporting the research hypothesis that companies with high ROA and ROE also tend to implement earning management more clearly, but the relationship is not close.
When considering the correlation between the DA and current solvency (measured by CR), the p-value is less than 0.05, showing that the relationship is statistically significant, but the correlation coefficient found is also quite low. The relationship between DA and CR is tighter than considering the correlation between DA variables with ROA or ROE, but it is still low, showing a positive correlation coefficient (+) but all below 0.4.
Regression Results of the Research Model 1
Regression results of model 1 (Table 4) show that there are two independent variables that are not statistically significant with DA (because p-value is greater than 0.05). Subsequent regressions will remove the FS variable, and continue to remove the FL variable if FL still does not have a statistically significant relationship with the DA (Table 5 & 6).
| Table 4 Regression Result of Model | ||||
| Dependent Variable: DA | ||||
| Method: Panel Least Squares | ||||
| Date: 01/05/20 Time: 12:50 | ||||
| Sample: 2013 2018 | ||||
| Periods included: 6 | ||||
| Cross-sections included: 58 | ||||
| Total panel (balanced) observations: 348 | ||||
| Variable | Coefficient | Std. Error | t-Statistic | Prob. |
| C | -0.044881 | 0.11268 | -0.398308 | 0.6907 |
| ROA | 0.333522 | 0.133336 | 2.501371 | 0.0012 |
| CR | 0.281485 | 0.0442 | 6.36851 | 0 |
| FL | 0.034674 | 0.059855 | 0.579301 | 0.5628 |
| FS | -0.003677 | 0.007954 | -0.462301 | 0.6442 |
| R-squared | 0.742178 | Mean dependent var | 2.10E-17 | |
| Adjusted R-squared | 0.732174 | S.D. dependent var | 0.222465 | |
| S.E. of regression | 0.207242 | Akaike info criterion | -0.295592 | |
| Sum squared resid | 14.73165 | Schwarz criterion | -0.240244 | |
| Log likelihood | 56.43298 | Hannan-Quinn criter. | -0.273557 | |
| F-statistic | 14.21241 | Durbin-Watson stat | 1.758446 | |
| Prob(F-statistic) | 0 | |||
| Source: research data processing result | ||||
| Table 5 Regression result of model 1 after removing FS variable | ||||
| Dependent Variable: DA | ||||
| Method: Panel Least Squares | ||||
| Date: 01/05/20 Time: 12:56 | ||||
| Sample: 2013 2018 | ||||
| Periods included: 6 | ||||
| Cross-sections included: 58 | ||||
| Total panel (balanced) observations: 348 | ||||
| Variable | Coefficient | Std. Error | t-Statistic | Prob. |
| C | -0.09396 | 0.037704 | -2.49213 | 0.0132 |
| ROA | 0.325093 | 0.131932 | 2.464091 | 0.0014 |
| CR | 0.278696 | 0.043736 | 6.372272 | 0 |
| FL | 0.02852 | 0.058289 | 0.489279 | 0.625 |
| R-squared | 0.741643 | Mean dependent var | 2.10E-17 | |
| Adjusted R-squared | 0.734157 | S.D. dependent var | 0.222465 | |
| S.E. of regression | 0.207005 | Akaike info criterion | -0.30072 | |
| Sum squared resid | 14.74082 | Schwarz criterion | -0.25644 | |
| Log likelihood | 56.3246 | Hannan-Quinn criter. | -0.28309 | |
| F-statistic | 18.92189 | Durbin-Watson stat | 1.755558 | |
| Prob(F-statistic) | 0 | |||
| Source: research data processing result | ||||
| Table 6 Regression Result of Model 1 After Removing Fl Variable | ||||
| Dependent Variable: DA | ||||
| Method: Panel Least Squares | ||||
| Date: 01/05/20 Time: 12:59 | ||||
| Sample: 2013 2018 | ||||
| Periods included: 6 | ||||
| Cross-sections included: 58 | ||||
| Total panel (balanced) observations: 348 | ||||
| Variable | Coefficient | Std. Error | t-Statistic | Prob. |
| C | -0.077083 | 0.01519 | -5.074428 | 0 |
| ROA | 0.317895 | 0.130965 | 2.427332 | 0.0015 |
| CR | 0.274842 | 0.042973 | 6.395682 | 0 |
| R-squared | 0.741046 | Mean dependent var | 2.10E-17 | |
| Adjusted R-squared | 0.736066 | S.D. dependent var | 0.222465 | |
| S.E. of regression | 0.206777 | Akaike info criterion | -0.305768 | |
| Sum squared resid | 14.75108 | Schwarz criterion | -0.272559 | |
| Log likelihood | 56.20355 | Hannan-Quinn criter. | -0.292547 | |
| F-statistic | 28.32559 | Durbin-Watson stat | 1.755505 | |
| Prob(F-statistic) | 0 | |||
| Source: research data processing result | ||||
The research model has no autocorrelation phenomenon (Durbin-Watson stat: 1.755505), the model does not have multi-collinear phenomenon because the correlation coefficient between the independent variables is not high. The final regression results for model 1 show that the profit management (DA) status of companies is affected by the return on assets (ROA) and the current ratio of liquidity to total assets (CR). 1% increase in ROA will lead to 0.317895% increase in DA, while 1% increase of CR will lead to 0.274842% increase of DA. The level of explanation of the research model is 73.6%.
Regression Results of the Research Model 2
Regression results of model 2 (Table 7) show that there are two independent variables that are not statistically significant with DA (because p-value is greater than 0.05). Subsequent regressions will remove the FS variable, and continue to remove the FL variable if FL still does not have a statistically significant relationship with the DA (Table 8).
| Table 7 Regression Result of Model 2 | ||||
| Dependent Variable: DA | ||||
| Method: Panel Least Squares | ||||
| Date: 01/05/20 Time: 13:12 | ||||
| Sample: 2013 2018 | ||||
| Periods included: 6 | ||||
| Cross-sections included: 58 | ||||
| Total panel (balanced) observations: 348 | ||||
| Variable | Coefficient | Std. Error | t-Statistic | Prob. |
| C | -0.02542 | 0.11324 | -0.22449 | 0.8225 |
| ROE | 0.097688 | 0.036267 | 2.693558 | 0.0074 |
| CR | 0.27811 | 0.044267 | 6.282564 | 0 |
| FL | 0.031083 | 0.059536 | 0.522091 | 0.6019 |
| FS | -0.00435 | 0.007968 | -0.54646 | 0.5851 |
| R-squared | 0.744623 | Mean dependent var | 2.10E-17 | |
| Adjusted R-squared | 0.734648 | S.D. dependent var | 0.222465 | |
| S.E. of regression | 0.206947 | Akaike info criterion | -0.29845 | |
| Sum squared resid | 14.68965 | Schwarz criterion | -0.2431 | |
| Log likelihood | 56.92967 | Hannan-Quinn criter. | -0.27641 | |
| F-statistic | 14.49817 | Durbin-Watson stat | 1.763557 | |
| Prob(F-statistic) | 0 | |||
| Source: research data processing result | ||||
| Table 8 Regression Result Of Model 2 After Removing Fl Variable | ||||
| Dependent Variable: DA | ||||
| Method: Panel Least Squares | ||||
| Date: 01/05/20 Time: 13:15 | ||||
| Sample: 2013 2018 | ||||
| Periods included: 6 | ||||
| Cross-sections included: 58 | ||||
| Total panel (balanced) observations: 348 | ||||
| Variable | Coefficient | Std. Error | t-Statistic | Prob. |
| C | -0.02037 | 0.112707 | -0.18074 | 0.8567 |
| ROE | 0.09567 | 0.036023 | 2.655842 | 0.0083 |
| CR | 0.273291 | 0.043248 | 6.31913 | 0 |
| FS | -0.00344 | 0.007764 | -0.44267 | 0.6583 |
| R-squared | 0.743943 | Mean dependent var | 2.10E-17 | |
| Adjusted R-squared | 0.736477 | S.D. dependent var | 0.222465 | |
| S.E. of regression | 0.206728 | Akaike info criterion | -0.3034 | |
| Sum squared resid | 14.70133 | Schwarz criterion | -0.25912 | |
| Log likelihood | 56.79145 | Hannan-Quinn criter. | -0.28577 | |
| F-statistic | 19.2808 | Durbin-Watson stat | 1.763433 | |
| Prob(F-statistic) | 0 | |||
| Source: research data processing result | ||||
The research model (Table 9) has no autocorrelation phenomenon (due to Durbin-Watson stat = 1.760250), the model does not have multi-collinear phenomenon because the correlation coefficient between the independent variables is not high.
| Table 9 Regression Result of Model 2 After Removing FS Variable | ||||
| Dependent Variable: DA | ||||
| Method: Panel Least Squares | ||||
| Date: 01/05/20 Time: 13:16 | ||||
| Sample: 2013 2018 | ||||
| Periods included: 6 | ||||
| Cross-sections included: 58 | ||||
| Total panel (balanced) observations: 348 | ||||
| Variable | Coefficient | Std. Error | t-Statistic | Prob. |
| C | -0.06981 | 0.015128 | -4.61449 | 0 |
| ROE | 0.093454 | 0.035631 | 2.622799 | 0.0091 |
| CR | 0.27162 | 0.043033 | 6.311913 | 0 |
| R-squared | 0.743455 | Mean dependent var | 2.10E-17 | |
| Adjusted R-squared | 0.73849 | S.D. dependent var | 0.222465 | |
| S.E. of regression | 0.206487 | Akaike info criterion | -0.30858 | |
| Sum squared resid | 14.7097 | Schwarz criterion | -0.27537 | |
| Log likelihood | 56.69236 | Hannan-Quinn criter. | -0.29536 | |
| F-statistic | 28.89055 | Durbin-Watson stat | 1.76025 | |
| Prob(F-statistic) | 0 | |||
The final regression results for model 1 show that the profit management (DA) status of companies is affected by the return on equity (ROE) and the current ratio of liquidity to total assets (CR).
1% increase in ROE will lead to 0.093454% increase in DA, while 1% increase of CR will lead to 0.271620% increase of DA.
The level of explanation of the research model is 73.8%.
Conclusion and Recommendations
For corporate Financial Managers
Although the average level of earning management is not high, in reality there is a huge difference in the earning management of enterprises in the research area. On average, earning management is not recognized as a major problem, but at each specific observation, to specific businesses, at specific times, if independent analysts use it. Modified Jones model to measure the level of earning management of real estate listed companies, the level of earning management will be assessed as not low, and there is a big difference between the observations. This can lead to doubts about the motive behind financial management decisions regarding accrual lines of accounting. The research results also provide suggestions to corporate financial administrators, despite good compliance with regulations on accounting, auditing and corporate finance (as evidenced by this study. (based on audited corporate financial statements), they should still be concerned about the impact of financial management decisions on the corporate image on earning management. Because it is not necessary to know the cause, a business that is perceived to perform earning management may receive mixed reviews from analysts, the board of directors, shareholders, and the investment public like the policy maker and managers.
For the Board and the Supervisory Board
With its role, members of the Board of Directors, especially independent members, and members of the Supervisory Board of real estate listed companies in Vietnam should further strengthen their cooperation. control, promote transparency and comply with regulations on accounting and corporate finance, and pay special attention to the management of profits if incurred, to ensure leadership. of the Board of Directors, the role of the Supervisory Board is to represent the General Meeting of Shareholders overseeing the activities of the Board of Directors and Board of Directors. Proper attention to earning management practices both helps increase compliance, and helps build a more transparent corporate financial image.
Limitations and Future Research
The limitation of this study is that the samples focus only on the real estate sector listed on the stock exchange in Vietnam, so the results of the study may not be representative of other sectors in Vietnam.
Research use balanced-panel, the estimation model of DA is the OLS regression model. In subsequent studies in the near future, based on the same data set, others researchers can use the tests select regression techniques that will be appropriated with the data.
Another limitation of the study is the use of secondary data on corporate financial situation without taking into account corporate governance factors, especially the culture, style and ambition of the business. administration. Therefore, the use of secondary data on business situation, corporate financial situation, and coordination with primary data obtained from surveys, and interviews with administrators, will be one of research directions of this topic in the near future.
References
- Akram. (2015). Earnings management and organizational performance: Pakistan VS India. Basic Research Journal of Business Management and Accounts, 4(9), 211-220.
- Daniel A., Cohen., & Paul, Z. (2010). Accrual-based and real earnings management activities around seasoned equity offerings. Journal of Accounting and Economics, 50(1), 2-19.
- Dechow, P.M., Sloan, R.G., & Sweeney, A. (1995). Detecting earnings management. The Accounting Review, 70(2), 193-225.
- DeAngelo, L.E. (1986). Accounting numbers as market valuation substitutes: A study of management buyouts of public stockholders. The Accounting Review, 61(3), 400-420.
- Farzaneh. (2012). A study of the factors affecting earnings management: Iranian overview. Science Series Data Report, 4(2).
- Gill. (2013). Earnings management, firm performance, and the value of indian manufacturing firms. International Research Journal of Finance and Economics, 116, 120-131.
- Huy, D.T.N (2012). Estimating beta of viet nam listed construction companies groups during the crisis. Journal of Integration and Development, 15(1), 57-71.
- Iatridis, G., & Kadorinis, G. (2009). Earnings management and firm financial motives, a financial investigation of UK listed firms. International Review of Financial Analysis, 18(4), 164-173.
- Mashadi, M.M., Abdollahi, A., Talebiyan, S.M., Baygi, S.J., & Chaharmahali, M.V. (2012). The impact of earnings management on the value-relevance of earnings and book Value in Tehran stock exchange. American Journal of Scientific Research, 59, 79-90.
- Nico, A., & Hengky. (2017). Factors affecting earnings management in the indonesian stock exchange. Journal of Finance and Banking Review, 2(2), 8-14 .
- Silvy, C., & Nico, A. (2018). Corporate governance, corporate social responsibility disclosure and earnings management. Proceedings of the 5th Annual International Conference on Accounting Research (AICAR 2018)
- Stubben, S.R. (2010). Discretionary revenues as a measure of earnings management. TheAccounting Review, 85(2), 695-717.
- Teoh, S.H., Welch, I., & Wong, T.J. (1998). Earnings management and the long-run market performance of initial public offerings. The Journal of Finance, 53(6), 1935-1974.