Research Article: 2021 Vol: 25 Issue: 3
Key performance drivers of small enterprises in the manufacturing sector in kwazulu natal province, South Africa
Helper Zhou, Durban University of Technology
Victor Gumbo, University of Botswana Gaborone
Citation Information: Zhou H., Gumbo V. (2021). Key Performance Drivers of Small Enterprises in the Manufacturing Sector in Kwazulu Natal Province, South Africa. International Journal of Entrepreneurship, 25(3), 1-12.
Abstract
This paper sought to establish key performance drivers for small, medium and micro enterprises (SMMEs) in the manufacturing sector in KwaZulu Natal (KZN) province, South Africa. A quantitative approach was adopted, utilising three-year panel data of manufacturing small enterprises. The results utilising Fixed Effects panel data modelling technique, revealed that productivity, permanent and temporary workers have a positive effect, whilst company age and unemployment have a negative effect on SMMEs sales performance. Based on these results, it was recommended that SMMEs should leverage their human resources to drive sustainable performance. It is also important that key interventions targeting the SMME sector should not only focus on internal but external environment drivers like unemployment which have a significant impact on the performance and thus long-term survival.
Keywords
Kwazulu Natal, Manufacturing, Performance Drivers, Small Medium and Micro Enterprises.
Introduction
Over the years there has been significantly growing interest related to the drivers of firm performance. As such governments are interested in key drivers of performance as they appreciate the role played by Small Medium and Micro Enterprises (SMMEs) in driving economic development, through inter alia, employment creation, improved living standards and innovation (Mascarenhas et al., 2002; Masenyetse, 2017; Moo & Eyiah, 2019). Internal stakeholders strive for the survival of their firms, often with limited success, as achieving such requires a strategy informed by key factors influencing their business performance (Mascarenhas et al., 2002). Inevitably, various stakeholders like research and development institutions have increased their interest to ensure support and sustainability of small enterprises (Coad, Frankish, et al., 2016). Such research is important in developing countries which are grappling with continued small firm failure rates (Nemaenzhe, 2010). However, notwithstanding such growing interest, research on the sector in developing countries remains fragmented due to data limitations (Gumede, 2000; International Finance Corporation, 2019). This is the case in South Africa as there are few studies on the area to inform entrepreneurship and industrial development policies (Masenyetse, 2017). Majority of studies in South Africa and particularly in KZN, the country’s second largest province on the subject have largely relied on cross-sectional data (Ayandibu & Houghton, 2017; Gumede, 2000; Lekhanya, 2016; Mahohoma, 2018). This type of data however tend to provide a truncated view on performance drivers as it does not provide insight on how they relate with SMME performance over time (Davies, 1994). As such, this paper aims to address this gap utilising a panel dataset covering three years between 2015 and 2017, to investigate key performance drivers of manufacturing SMMEs in KZN province. The study aims to provide both SMMEs and policy makers with an informed basis on key factors to focus on in order to enhance small enterprises’ sustainable performance in the province.
Literature Review
Theories on firm performance abound and have been widely discussed in literature over the years (Coad et al., 2016; Gupta et al., 2013; O'Farrell & Hitchens, 1988). Researchers continue to explore models that best explain this complex phenomenon, which is of interest to various stakeholders like governments, academics and practitioners themselves (Machado, 2016; Nemaenzhe, 2010). Penrose’s growth of the firm theory and the strategic management theoretical models has been widely harnessed by various studies in order to understand firm performance (O'Farrell & Hitchens, 1988; Penrose, 2009). Penrose place much emphasis on internal drivers whist the strategic management recognise that external drivers also have an impact on organisational performance (Machado, 2016; O'Farrell & Hitchens, 1988). This indicates that firm performance is a function of both internal and external factors (Hansen & Wernerfelt, 1989). The next subsection unpacks various internal and external factors within the context of SMME performance.
Firm Internal Factors
Both the strategic management perspective and Penrosian worldview appreciates the fundamental role of internal factors like firm entrepreneurs’ attributes, size, age, productivity on firm growth and survival (Gupta et al., 2013; Jofre, 2011; Panda, 2015; Penrose, 2009). Hermelo and Vassolo (2007) noted that previous studies on firm growth mainly concentrated on external factors with less focus on organisational specific variables.
Entrepreneur Age
The role of the entrepreneur’s age has for a long time attracted the interest of various researchers (Essel et al., 2019; Tanveer et al., 2013; Zhou & de Wit, 2009). Amran (2011) found that old entrepreneurs had an adverse effect on business performance. Levesque and Minniti (2006) argued that age adversely impact entrepreneurial activity and thus older SMME owners would struggle to innovate compared to the younger age group. De Kok et al. (2010) observed a significant nonlinear inverted U-shaped relationship between the entrepreneur’s age and performance. Their results indicated that firms owned by younger entrepreneurs performed better than those owned by older entrepreneurs. In this light we hypothesise the following:
Hypothesis 1: SMMEs owned by young entrepreneurs perform better than those owned by old entrepreneurs. A concave relationship is thus expected between entrepreneur age and firm performance.
Labour Productivity
Labour productivity has not received as much attention compared to other internal drivers in the past (Van Biesebroeck, 2005). Various studies have shown that labour productivity has a positive influence on firm performance (Beheshti & Beheshti, 2010; Shiferaw, 2009). This is consistent with the passive learning model, which asserts that efficient firms experience sustainable growth, whilst less efficient ones perform poorly before contracting and exiting the market (Bigsten & Gebreeyesus, 2007). Against this backdrop we posit the following:
Hypothesis 2: Labour productivity has positive impact on the performance of SMMEs in KZN.
Permanent Workers
Permanent workers also known as a full-time workforce, is a critical driver for both small and big firms’ performance (Roca- Puig et al., 2012; Zhou & de Wit, 2009). This makes human resources; especially full-time workers form an important component of the organisation and provide a unique advantage owing to its social complexity and thus inimitable as argued by both the Penrosian and strategic management theoretical perspectives (Jofre, 2011; Omalaja & Eruola, 2011; Penrose, 2009). As such, based on reviewed literature, we hypothesise the following:
Hypothesis 3: Permanent workers have a positive impact on the performance of SMMEs in KZN.
Temporary Workers
Utilisation of temporary workers also known as part time workers has become a widespread practice over the years (Pauka, 2015). Notwithstanding their widespread use across different types of organisations, temporary workers have been tagged as the “missing persons” of organisational research because of fragmented research on them (Clinebell & Clinebell, 2007). Recent studies established that lower levels of temporary workers have a positive effect whilst higher levels have negative impact on firm performance (Chadwick & Flinchbaugh, 2016; Roca- Puig et al., 2012). Also, it’s key to note that previous studies on this area have so far been conducted in developed countries and in order to contribute to literature in this area in the South African context, the following hypothesis is investigated:
Hypothesis 4: There is an inverted U-shaped relationship between part-time workers and SMME performance in KZN province. Implying that utilisation of low proportions of part-time employees has positive impact on the SMMEs’ performance, but high levels of part-time employees negatively impact performance.
Total Assets
Manufacturing companies largely depends on their asset base to run their operations, with the main two sets of assets being non-current and current. Non-current assets which mainly include plant, property and equipment are used to transform raw materials into finished items (Al-Ani, 2013; Maggina & Tsaklanganos, 2012). Clearly, showing that the sales performance of a typical manufacturing company largely hinges on its asset base compared to other organisational level attributes (Gupta et al., 2013). Loderer and Waelchli (2010) also established that older firms tend to have antiquated machinery which results in overheads increasing and thus deleteriously impacting performance. To find this out on KZN SMMEs, we test the following hypotheses:
Hypothesis 5(a): Total assets have a positive effect on the performance of SMMEs in KZN province.
Hypothesis 5(b): As firms age total assets tend to have a deleterious effect on the performance of SMMEs in KZN province.
Company Age
Various studies have indicated a positive relationship between performance and firm age (Buyinza, 2011; Hiatt & Sine, 2014; Shiferaw, 2009). Tanveer et al. (2013) noted that firm age has a positive relationship with success. However, some studies in line with the ‘liability of obsolescence’ claim that older firms tend to perform poorly due to failure in keeping up with changes in the environment (Coad et al., 2018). Owing to organisational rigidities Loderer and Waelchli (2010) found that older firms perform poorly compared to their industry peers. The findings clearly show the reality of corporate geriatrics as firm’s age. As has been pointed, older firms suffer from inertia thus constraining ability and willingness to change (Coad, Segarra, et al., 2016). In this regard we posit the following:
Hypothesis 6: There is an inverted U-shaped relationship between performance and the age of SMMEs in KZN province. We would expect that performance of SMMEs will initially improve with age due to learning effects as they mature and then ultimately decreases due to the liability of obsolescence.
External Environment Factors
In their elaboration of the strategic management perspective O'Farrell and Hitchens (1988) highlighted the need for small firms to understand the external environment. This is key to inform the development of an effective strategy to drive sustainable performance (Moreno et al., 2014; Omalaja & Eruola, 2011). Teruel-Carrizosa (2006) argued that less attention was given to the role external driver’s play on small business performance. As such we reviewed some of the macroeconomic variables that have been found to affect firm performance.
Unemployment
The impact of unemployment on the performance of small enterprises remains a subject of debate over the years. Olawale and Garwe (2010) noted that high levels of unemployment have an adverse impact on the small enterprises’ performance (Hiatt & Sine, 2014; Huggins et al., 2017). This could be attributed to increased competition as unemployed individuals, leading to increased competition (Kitson, 1995). Based on extant literature the following hypothesis is thus postulated:
Hypothesis 7: The national unemployment rate has a negative impact on the performance of SMMEs in KZN province.
Gross Domestic Product (GDP)
The fundamental role of the country’s economic activity, as proxied by the GDP on the performance not only of small but also large enterprises cannot be over-elaborated. The GDP rate indicates the prevailing state of the country’s economic cycle and thus the overall performance of the business sector (Egbunike & Okerekeoti, 2018). Klapper and Richmond (2011) found that a percentage increase in the country’s GDP almost doubles manufacturing firm’s survival chances. In this light we thus hypothesise the following:
Hypothesis 8: There is a positive relationship between the country’s GDP growth rate and the performance of SMMEs in KZN province.
Purchasing Manager Index (PMI)
Various studies have established that there is a strong positive linear relationship between the index and performance of the manufacturing firms (Bureau for Economic Research, 2019; Harris, 1991; Koenig, 2002). Despite a study by (Mudgal, 2014) on Johannesburg Stock Exchange listed manufacturing firms there are limited studies in South African, particularly in KZN context investigating the relationship between PMI and manufacturing SMMEs performance. This study thus provides new knowledge in this area by investigating the following hypothesis:
Hypothesis 9: The Purchasing Managers Index has a positive effect on the performance of SMMEs in KZN province.
Data and Measures
The study utilised the three-year longitudinal dataset of 191 manufacturing SMMEs in KZN province from McFah Consultancy, a Durban based business and tax consulting company. The external economic data for the three years between 2015 and 2017 was obtained from two different sources, unemployment and GDP from Statistics South Africa (2019), whilst the PMI was accessed from the Bureau for Economic Research (2019). The panel data and external data provided adequate information to construct factors to test the above hypothesis as per our literature review. Independent variables under each category were defined and their specific measurements indicated.
Firm Internal Drivers
Entrepreneur Age (AGE), this is the actual age of the business owner, measured as the difference between the owner’s year of birth and the panel period (2015, 2016 and 2017). Entrepreneur Age Squared (AGE2), is the squared age of the entrepreneur for each of the three years. Permanent employees (Pemp), these are workers employed by the SMME on a full-time basis and are measured by the whole number as per the survey response. Temporary employees (Temp) are workers employed by the SMME on a part time basis, whilst Total Assets (LogTA), are the log transformed firms’ total assets. Productivity (Prod), this variable proxy the efficiency of an SMME and is measured by taking firm sales divided by total number of workers. Company Age, (CoAge), is the actual age of the business, measured as the difference between the year of SMME’s registration and the panel period (2015, 2016 and 2017) and finally, company Age, (CoAge), is the squared version of the SMME age.
External drivers
Purchasing Manager Index (PMI), this indicator measures the general performance of the manufacturing sector in an economy. Growth Domestic Product (GDP) measures the country’s economic performance for the three years between 2015 and 2017. Unemployment (UMP) measures the country’s annual unemployment rate. The unemployment rates for the three years between 2015 and 2017 were used.
Firm Performance
In line with previous related studies (Adegbite et al., 2007; Buyinza, 2011; Hyder & Lussier, 2016), firm performance measure in this study is proxied by annual sales turnover (log transformed). Richard et al. (2009) established that sales revenue is one of the key measures used in research as a measure of firm performance. Hermelo and Vassolo (2007) asserted that sales provide a good measure of the general performance of the business. It has also been argued that entrepreneurs tend to place emphasis on sales as a performance indicator compared to any other metric (Olawale & Garwe, 2010).
Econometric Framework
This study harnessed Fixed Effects (FE) and Random Effects (RE), which are the two most dominant panel data modelling techniques (Dieleman & Templin, 2014; Gil-García & Puron- Cid, 2014). The former is regarded as the default ‘gold standard’ of clustered data modelling in economics and related fields (Bell & Jones, 2015). With FE technique each firm’s individual characteristics is captured over time (Gil-García & Puron-Cid, 2014; Zulfikar, 2019). As per equation (1), the FE estimator essentially assesses how changes in (the dependant variable) y, relates with changes in x (the explanatory variable) within each group (Dieleman & Templin, 2014):
 (1)
(1)
where the subscripts  indicate the observed unit and
  is the time at
which each observation is sampled, the marginal effect which is considered to be homogeneous
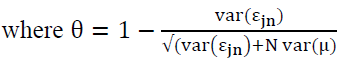
is captured by β, whilst is the error term which is i.i.d over firm and time, with mean being
equal to zero and variance equal to
is the time at
which each observation is sampled, the marginal effect which is considered to be homogeneous
is captured by β, whilst is the error term which is i.i.d over firm and time, with mean being
equal to zero and variance equal to  and the single, aggregated unobserved group-level effect
is measured by μ.
and the single, aggregated unobserved group-level effect
is measured by μ.
On the other hand, The RE technique is used in cases where interference variables could be interconnected between time and individuals. With this approach, the problem of heteroscedasticity is eliminated (Zulfikar, 2019). The modelling approach employs Feasible General Least Squares (FGLS) as per equation (2) which is an efficient way to addressing heteroscedasticity (Dieleman & Templin, 2014):
 (2)
(2)
Finally, the Hausman test was used to select an appropriate model between FE and RE which best explains firm performance phenomenon (Zulfikar, 2019). The plm package in R software version 3.6.3 was used to both the FE and RE models. To ensure all predictors are on common scale, the dataset was first called using the scaling function in R (Gelman, 2008).
Empirical Results
Table 1 below shows the results obtained using FE and RE as per equations (1) and (2), respectively. The Hausman test was also computed for the two models (Masenyetse, 2017) and showed that compared to the RE, FE estimator is consistent. As such our main interest and conclusions were based on the latter (Model 1) whilst the former (Model 2) was presented for comparison purposes. Consequently, the Breusch-Godfrey/Wooldridge and Breusch-Pagan techniques were used to test for serial correlation and heteroskedasticity respectively; these techniques are in the lmtest package available in R software (Torres-Reyna, 2010; Zeileis, 2006). The tests showed the presence of serial correlation and heteroscedasticity in the FE model. As such the robust covariance matrix within the sandwich estimator in R software was utilised to control for both heteroscedasticity and serial correlation in the dynamic model (Zeileis 2006; Torres-Reyna 2010).
| Table 1 Smmes Performance Drivers | ||
| Explanatory Variable | Model 1: Fixed Effects | Model 2: Random Effects |
| Intercept | - | 0.01 (0.018) |
| EntAge | 0.135 (0.298) |
-0.095 (0.114) |
| EntAge2 | -0.193 (0.281) |
0.096 (0.00) |
| Prod | 0.879*** (0.072) |
0.859*** (0.065) |
| Pemp | 0.296*** (0.063) |
0.319*** (0.035) |
| Temp | 0.171** (0.066) |
0.202*** (0.041) |
| Temp2 | -0.068 (0.081) |
-0.00* (0.046) |
| LogTA | 0.017 (0.068) |
0.059 (0.060) |
| CoAge*TA | -0.027 (0.036) |
-0.059*** (0.016) |
| CoAge | -0.530** (0.213) |
0.068 (0.047) |
| CoAge2 | -0.323** (0.152) |
-0.008 (0.045) |
| PMI | - | - |
| UMP | -0.280** (0.107) |
-0.015*** (0.006) |
| GDP | - | - |
| R2:0.974 Adj. R2: 0.960 |
R2:0.961 Adj. R2: 0.960 |
|
| Hausman test: chisq = 144.32p-value = 0.000 | ||
| Source: Authors’ own calculations | ||
The finding as per the selected Model 1 as show in Table 1 indicates that entrepreneur’s age has no effect on the sales performance of SMMEs in KZN. The result does not provide evidence for hypothesis 1, which claimed a non-linear concave relationship between performance and entrepreneur age. The finding is contrary to other previous studies, which established a significant effect of entrepreneur age on performance (Amran, 2011; De Kok et al., 2010), however it is related to a previous study by Essel et al. (2019).Firm productivity, as postulated by hypothesis 2, have a significant impact on sales performance and this aligns with the passive learning model (Bigsten & Gebreeyesus, 2007). The coefficient of productivity reflects its importance in driving SMMEs’ performance in the province ahead of other drivers with positive impact. Permanent workforce has a positive impact on firm sales as expected (hypothesis 3). The analysis shows that its effect is stronger and significant than that of temporary workers. The results indicate that this form of employment has a positive effect on SMMEs’ performance, as alluded to by previous studies (Pauka, 2015; Thorsteinson, 2003).
The results partially provided evidence for hypothesis 4, as only the linear term of temporary workers was significant. On the other hand, the polynomial term, which aimed at assessing the effect of increased utilisation of temporary workers on performance, was not significant in Model 1. In this light the claim of a concave relationship between the numbers of temporary workers could not be satisfied. These findings are contrary to previous findings (Chadwick & Flinchbaugh, 2016; Pauka, 2015; Roca- Puig et al., 2012). Both hypothesis 5(a) and 5(b) could not be confirmed, as total assets and the interaction effects between company age and the former have no impact on SMME sales performance. This finding differs with a previous study on the manufacturing sector, establishing the positive impact of total assets on firm performance (Al-Ani, 2013). The result indicates that firm assets do not have influence on the performance of SMMEs and the former does not negatively impact the latter as firms grow as was established by Loderer and Waelchli (2010).
For hypothesis 6, a concave relationship between firm age and performance was expected; however, Model 1 shows that firm age has a strong inverse relationship with performance which strengthens as age increases. The finding is contrary to other studies (Agostini et al., 2015; Loderer & Waelchli, 2010). Finally, the only significant external variable was unemployment, which as was posited (hypothesis 7) have a negative relationship with performance. The result is aligned with previous research (Huggins et al., 2017; Olawale & Garwe, 2010), contending that unemployment adversely impacts firm performance. Other external variables, GDP and PMI were automatically dropped to enhance model performance and thus both hypothesis 8 and 9 could not be established.
Discussion and Conclusion
Using a balanced panel of 191 manufacturing SMMEs in KZN, this study established key drivers behind these enterprises’ performance. The results show that only the trio of productivity, permanent workers and temporary workers have a positive conjoint effect on SMME performance. This finding highlights the fundamental role played by human resources in driving firm performance as postulated by the Penrosian worldview (Penrose, 2009). Firm age showed a strong negative effect on SMME performance, which is contrary to Penrose’s claim, that older firms are at an advantage compared to younger ones (Penrose, 2009). The significant effect of national unemployment rate on firm performance sustained the strategic management theory assertions, that firm performance is a function of both internal and external variables (Jofre, 2011; Løwendahl & Revang, 1998). The importance of paying attention to external factors is amplified by the adverse impact which unemployment has on SMMEs performance. This indicates that SMMEs should incorporate the negative impact of this driver on their performance when formulating strategic plans.
Based on these findings, it is recommended that SMMEs should focus on human resources in order to enhance performance. Interventions to improve productivity are key for SMMEs to achieve higher sales levels. On the other hand, manufacturing SMMEs owners should be agile and continuously adapt to new changes to avoid the challenge of irrelevance as marked by the negative impact of age on their performance. Key stakeholders in the SMME sector in KZN province should thus develop support schemes to help old firms adapt and improve their performance. Finally, the government should promote policies that reduce unemployment levels in the country in order to boost manufacturing SMMEs performance in KZN. It is however noteworthy that this study only focused on the manufacturing sector in KZN and thus the results may not be generalised to other sectors and provinces in South Africa. On that note, future studies should be extended to other sectors and provinces across the country. It is also recommended that future studies utilise panel data with longer time frame to cater for external variables which do not vary over short periods.
References
- Adegbite, S., Ilori, M., Irefin, I., Abereijo, I., & Aderemi, H. (2007). Evaluation of the impact of entrepreneurial characteristics on the performance of small scale manufacturing industries in Nigeria. Journal of Asia Entrepreneurship and Sustainability, 3(1), 1. Retrieved from https://pdfs.semanticscholar.org/932e/d5171179a5b3923dbac58efced95b6492e2c.pdf
- Agostini, L., Filippini, R., & Nosella, A. (2015). Brand-building efforts and their association with SME sales performance. Journal of Small Business Management, 53, 161-173. Retrieved from https://onlinelibrary.wiley.com/doi/abs/10.1111/jsbm.12185
- Al-Ani, M.K. (2013). Effects of assets structure on the financial performance: Evidence from sultanate of Oman. Paper presented at the 11th EBES Conference proceedings in Ekaterinburg, Russia.
- Amran, N.A. (2011). The effect of owner’s gender and age to firm performance: a review on Malaysian public listed family businesses. Journal of global business and economics, 2(1), 104-116. Retrieved from:
- http://citeseerx.ist.psu.edu/viewdoc/download?doi=10.1.1.460.2132&rep=rep1&type=pdf#page=108
- Ayandibu, A.O., & Houghton, J. (2017). External forces affecting Small businesses in South Africa: A case study. Journal of Business Retail Management Research, 11(2), 49-64.
- Beheshti, H.M., & Beheshti, C.M. (2010). Improving productivity and firm performance with enterprise resource planning. Enterprise Information Systems, 4(4), 445-472. doi:10.1080/17517575.2010.511276
- Bell, A., & Jones, K. (2015). Explaining fixed effects: Random effects modeling of time-series cross-sectional and panel data. Political Science Research and Methods, 3(1), 133-153.
- Bigsten, A., & Gebreeyesus, M. (2007). The small, the young, and the productive: Determinants of manufacturing firm growth in Ethiopia. Economic Development and Cultural Change, 55(4), 813-840.
- Bureau for Economic Research. (2019). South African Absa Bank manufacturing Purchasing Managers’ Index™: A monthly index of business conditions in the manufacturing sector.
- Buyinza, F. (2011). Performance and Survival of Ugandan Manufacturing firms in the context of the East African Community. Retrieved from:
- https://ideas.repec.org/p/ags/eprcrs/150477.html
- Chadwick, C., & Flinchbaugh, C. (2016). The effects of part-time workers on establishment financial performance. Journal of Management, 42(6), 1635-1662. Retrieved from https://journals.sagepub.com/doi/abs/10.1177/0149206313511116
- Clinebell, S.K., & Clinebell, J.M. (2007). Differences Between Part-Time and Full-Time Employees in the Financial Services Industry. Journal of Leadership & Organizational Studies, 14(2), 157-167. doi:10.1177/1071791907308053
- Coad, A., Frankish, J.S., Roberts, R.G., & Storey, D.J. (2016). Predicting new venture survival and growth: Does the fog lift? Small Business Economics, 47(1), 217-241.
- Coad, A., Holm, J.R., Krafft, J., & Quatraro, F. (2018). Firm age and performance. Journal of Evolutionary Economics, 28(1), 1-11. doi:10.1007/s00191-017-0532-6
- Coad, A., Segarra, A., & Teruel, M. (2016). Innovation and firm growth: Does firm age play a role? Research Policy, 45(2), 387-400. doi:10.1016/j.respol.2015.10.015
- Davies, R.B. (1994). From cross-sectional to longitudinal analysis. Analyzing social & political change: A casebook of methods, 20-40.
- De Kok, J., Ichou, A., & Verheul, I. (2010). New firm performance: Does the age of founders affect employment creation. Zoetermeer: EIM Research Reports, 12, 42-63. Retrieved from: https://www.researchgate.net/profile/Jan_Kok/publication/46455751_New_Firm_Performance_Does_the_Age_of_Founders_Affect_Employment_Creation/links/00463524bcce65066b000000.pdf
- Dieleman, J. L., & Templin, T. (2014). Random-effects, fixed-effects and the within-between specification for clustered data in observational health studies: a simulation study. PloS one, 9(10). Retrieved from:
- https://journals.plos.org/plosone/article/file?type=printable&id=10.1371/journal.pone.0110257
- Egbunike, C.F., & Okerekeoti, C.U. (2018). Macroeconomic factors, firm characteristics and financial performance. Asian Journal of Accounting Research.
- Essel, B.K.C., Adams, F., & Amankwah, K. (2019). Effect of entrepreneur, firm, and institutional characteristics on small-scale firm performance in Ghana. Journal of Global Entrepreneurship Research, 9(1), 55.
- Gelman, A. (2008). Scaling regression inputs by dividing by two standard deviations. Statistics in Medicine, 27(15), 2865-2873. doi:10.1002/sim.3107
- Gil-García, J.R., & Puron-Cid, G. (2014). Using panel data techniques for social science research: an illustrative case and some guidelines. CIENCIA ergo-sum, Revista Científica Multidisciplinaria de Prospectiva, 21(3), 203-216. Retrieved from https://www.redalyc.org/pdf/104/10432355004.pdf
- Gumede, V. (2000). Growth and exporting of small and medium enterprises in South Africa, some thoughts on policy and scope for further research. Trade and Industrial Policy Strategies, South Africa. Retrieved from:
- https://www.researchgate.net/profile/Vusi_Gumede/publication/242022564_Small_manufacturing_enterprises_and_exporting_in_South_Africa_A_preliminary_assessment_of_key_export_success_factors/links/568169ec08aebccc4e0bdeb2.pdf
- Gupta, P.D., Guha, S., & Krishnaswami, S.S. (2013). Firm growth and its determinants. Journal of Innovation and Entrepreneurship, 2(1), 15. Retrieved from https://link.springer.com/article/10.1186/2192-5372-2-15
- Hansen, G.S., & Wernerfelt, B. (1989). Determinants of firm performance: The relative importance of economic and organizational factors. Strategic management journal, 10(5), 399-411.
- Harris, E.S. (1991). Tracking the Economy with the Purchasing Managers Index: Federal Reserve Bank.
- Hermelo, D.F., & Vassolo, R. (2007). The determinants of firm's growth: an empirical examination. Revista Abante, 10(1), 3-20.
- Hiatt, S.R., & Sine, W. (2014). Clear and present danger: Planning and new venture survival amid political and civil violence. Strategic Management Journal, 35(5), 773-785. Retrieved from http://nrs.harvard.edu/urn-3:HUL.InstRepos:12534949
- Huggins, R., Prokop, D., & Thompson, P. (2017). Entrepreneurship and the determinants of firm survival within regions: human capital, growth motivation and locational conditions. Entrepreneurship & Regional Development, 29(3-4), 357-389. doi:10.1080/08985626.2016.1271830
- Hyder, S., & Lussier, R.N. (2016). Why businesses succeed or fail: A study on small businesses in Pakistan. Journal of Entrepreneurship in Emerging Economies, 8(1), 82-100. doi:10.1108/JEEE-03-2015-0020
- International Finance Corporation. (2019). The unseen sector: A report on the MSME opportunity in South Africa. Retrieved from Washington: https://www.ifc.org/wps/wcm/connect/2dddbf2b-bd44-4965-a7bf-b71475602649/2019-01-MSME-Opportunity-South-Africa.pdf?MOD=AJPERES&CVID=mxxxHod
- Jofre, S. (2011). Strategic Management: The theory and practice of strategy in (business) organizations. DTU Management. Retrieved from https://pdfs.semanticscholar.org/6348/a23ee3648797a93ce9d54bb6dc1ca1c709fa.pdf
- Kitson, M. (1995). Seedcorn Or Chaff?: Unemployment and Small Firm Performance: ESRC Centre for Business Research, University of Cambridge.
- Klapper, L., & Richmond, C. (2011). Patterns of business creation, survival and growth: Evidence from Africa: The World Bank.
- Koenig, E.F. (2002). Using the purchasing managers’ index to assess the economy’s strength and the likely direction of monetary policy. Federal Reserve Bank of Dallas Economic and Financial Policy Review, 1(6), 1-14. Retrieved from https://core.ac.uk/download/pdf/6971097.pdf
- Lekhanya, L.M. (2016). Business characteristics of small and medium enterprises in rural areas: a case study on southern region of KwaZulu-Natal province of South Africa. Problems and perspectives in management, 14, (Iss. 3), 108-114. Retrieved from http://www.irbis-nbuv.gov.ua/cgi-bin/irbis_nbuv/cgiirbis_64.exe?C21COM=2&I21DBN=UJRN&P21DBN=UJRN&IMAGE_FILE_DOWNLOAD=1&Image_file_name=PDF/prperman_2016_14_3_13.pdf
- Levesque, M., & Minniti, M. (2006). The effect of aging on entrepreneurial behavior. Journal of business venturing, 21(2), 177-194.
- Loderer, C.F., & Waelchli, U. (2010). Firm age and performance. SSRN 1342248. Retrieved from https://papers.ssrn.com/sol3/papers.cfm?abstract_id=1342248
- Løwendahl, B., & Revang, Ø. (1998). Challenges to Existing Strategy Theory in a Postindustrial Society. Strategic Management Journal, 19(8), 755-773. doi:10.1002/(SICI)1097-0266(199808)19:8<755::AID-SMJ968>3.0.CO;2-A
- Machado, H.P.V. (2016). Crescimento de pequenas empresas: revisão de literatura e perspectivas de estudos. Gestão & Produção, 23(2), 419-432. doi:10.1590/0104-530x1759-14
- Maggina, A., & Tsaklanganos, A. (2012). Asset growth and firm performance evidence from Greece. The International Journal of Business and Finance Research, 6(2), 113-124. Retrieved from https://papers.ssrn.com/sol3/papers.cfm?abstract_id=1949262
- Mahohoma, T. (2018). The impact of entrepreneurial competencies on the performance of SMEs in the eThekwini Municipal Region, KwaZulu-Natal, South Africa. Retrieved from http://openscholar.dut.ac.za/handle/10321/3145
- Mascarenhas, B., Kumaraswamy, A., Day, D., & Baveja, A. (2002). Five strategies for rapid firm growth and how to implement them. Managerial and Decision Economics, 23(4-5), 317-330. doi:10.1002/mde.1068
- Masenyetse, R. F. (2017). Firm Growth, Survival and Productivity in South Africa. (PhD). University of Cape Town, Cape Town. Retrieved from:
- https://open.uct.ac.za/handle/11427/27099
- Moo, F., & Eyiah, A. (2019). Factors Influencing the Growth of Small and Medium Construction Firms in Northern Ghana. Journal of African Business, 1-16.
- Moreno, M.A., Zarrias, A.J., & Barbero, L.J. (2014). The relationship between growth and volatility in small firms. Management Decision, 52(8), 1516-1532. doi:10.1108/MD-10-2013-0509
- Mudgal, N. (2014). An empirical analysis of the relationship between the Purchasing Managers' Index (PMI) and share prices in the manufacturing sector of South Africa. Retrieved from https://pdfs.semanticscholar.org/ad49/816c88445d9623ae976836d6cd62746ceba2.pdf
- Nemaenzhe, P.P. (2010). Retrospective analysis of failure causes in South African small businesses. University of Pretoria,
- O'Farrell, P.N., & Hitchens, D.M. (1988). Alternative theories of small-firm growth: a critical review. Environment and Planning 20(10), 1365-1383.
- Olawale, F., & Garwe, D. (2010). Obstacles to the growth of new SMEs in South Africa: A principal component analysis approach. African Journal of Business Management, 4(5), 729-738. Retrieved from http://www.academicjournals.org/journal/AJBM/article-abstract/A1AFDEC23302
- Omalaja, M.A., & Eruola, O. (2011). Strategic management theory: Concepts, analysis and critiques in relation to corporate competitive advantage from the resource-based philosophy. Economic analysis, 44(1-2), 59-77. Retrieved from http://www.library.ien.bg.ac.rs/index.php/ea/article/view/194
- Panda, D. (2015). Growth determinants in small firms: drawing evidence from the Indian agro-industry. International Journal of Commerce Management, 25(1), 52-66.
- Pauka, K. (2015). How does Part-time Work Affect Firm Performance and Innovation Activity? Retrieved from https://www.econstor.eu/handle/10419/123473
- Penrose, E. (2009). The Theory of the Growth of the Firm (4th;4; ed.). GB: Oxford University Press.
- Richard, P.J., Devinney, T.M., Yip, G.S., & Johnson, G. (2009). Measuring organizational performance: Towards methodological best practice. Journal of management, 35(3), 718-804. Retrieved from:
- https://www.researchgate.net/publication/228133369_Measuring_Organizational_Performance_Towards_Methodological_Best_Practice
- Roca-Puig, V., Beltrán-Martín, I., & Cipres, M.S. (2012). Combined effect of human capital, temporary employment and organizational size on firm performance. Personnel Review.
- Shiferaw, A. (2009). Survival of private sector manufacturing establishments in Africa: The role of productivity and ownership. World Development, 37(3), 572-584.
- Statistics South Africa. (2019). Discouragement decreases and unemployment increases in the second quarter of 2019.
- Tanveer, M.A., Akbar, A., Gill, H., & Ahmed, I. (2013). Role of personal level determinants in entrepreneurial firm’s success. Journal of Basic and Applied Scientific Research, 3(1), 449-458.
- Teruel-Carrizosa, M. (2006). Firm growth, persistence and multiplicity of equilibria: an analysis of Spanish manufacturing and service industries. Universitat Rovira i Virgili,
- Thorsteinson, T.J. (2003). Job attitudes of part-time vs. full-time workers: A meta-analytic review. Journal of Occupational and Organizational Psychology, 76(2), 151-177. Retrieved from https://onlinelibrary.wiley.com/doi/abs/10.1348/096317903765913687
- Torres-Reyna, O. (2010). Getting started in fixed/random effects models using R. Data & Statistical Services. Princeton University.
- Van Biesebroeck, J. (2005). Firm size matters: Growth and productivity growth in African manufacturing. Economic Development and Cultural Change, 53(3), 545-583.
- Zeileis, A. (2006). Object-oriented computation of sandwich estimators. Journal of Statistical Software, 16(9), 1-16.
- Zhou, H., & de Wit, G. (2009). Determinants and dimensions of firm growth. SCALES EIM Research Reports (H200903).
- Zulfikar, R. (2019). Estimation model and selection method of panel data regression: an overview of common effect, fixed effect, and random effect model. Retrieved from https://osf.io/download/5b24301a8b4bed0011b5b80f/