Research Article: 2023 Vol: 27 Issue: 2
K−Means Clusterization and Machine Learning Prediction of European Most Cited Scientific Publications
Angelo Leogrande, LUM University Giuseppe Degennaro
Alberto Costantiello, LUM University Giuseppe Degennaro
Lucio Laureti, LUM University Giuseppe Degennaro
Citation Information: Leogrande A. (2023). K-Means Clusterization and Machine Learning Prediction of European Most Cited Scientific Publications. International Journal of Entrepreneurship, 27(2),1-43.
Abstract
In this article we investigate the determinants of the European “Most Cited Publications”. We use data from the European Innovation Scoreboard-EIS of the European Commission for the period 2010-2019. Data are analyzed with Panel Data with Fixed Effects, Panel Data with Random Effects, WLS, and Pooled OLS. Results show that the level of “Most Cited Publications” is positively associated, among others, to “Innovation Index” and “Enterprise Birth” and negatively associated, among others, to “Government Procurement of Advanced Technology Products” and “Human Resources”. Furthermore, we perform a cluster analysis with the k-Means algorithm either with the Silhouette Coefficient and the Elbow Method. We find that the Elbow Method shows better results than the Silhouette Coefficient with a number of clusters equal to 3. In adjunct we perform a network analysis with the Manhattan distance, and we find the presence of 4 complex and 2 simplified network structures. Finally, we present a confrontation among 10 machine learning algorithms to predict the level of “Most Cited Publication” either with Original Data-OD either with Augmented Data-AD. Results show that the best machine learning algorithm to predict the level of “Most Cited Publication” with Original Data-OD is SGD, while Linear Regression is the best machine learning algorithm for the prediction of “Most Cited Publications” with Augmented Data-AD.
Keywords
Innovation, and Invention, Processes and Incentives, Management of Technological Innovation and R&D, Diffusion Processes, Open Innovation.
JEL Classification
O30; O31, O32; O33; O36.
Introduction
The determinants of the most cited scientific publications at international level are analyzed below. This is obviously an important variable both because it represents excellence from the point of view of scientific research at the country level, and because the most cited scientific publications are also those that establish the trends and perspectives of scientific disciplines. However, it is also a variable that can be criticized from various points of view. First, since it is not representative of the innovative trends of a given disciplinary sector. In fact, young researchers who generally have the most innovative ideas will hardly be able to publish on renowned journals or with co-authorships such as to be able to guarantee to enter the ranks of the most cited scientific publications. Therefore, this variable takes into consideration only the authors who are already established, in the most relevant journals, of the most productive countries in terms of scientific research. In addition, it is also necessary to consider the existence of significant financial limitations that can limit many researchers from having access to high-level journals since they often have very high fees to pay. It therefore follows that it is a variable that is certainly able to synthesize the themes, the most famous researchers of the discipline, and to give due recognition to institutions that invest significantly in scientific research. However, it is also a largely ineffective tool for measuring other elements such as the innovativeness of a research system, the ability of young researchers to change the setting of scientific disciplines with original discoveries. Finally, it does not allow to adequately recognize the research work carried out by institutions that do not have sufficient financial resources to publish in the most important scientific journals.
However, despite the limitations of variable cuttings, we believe that it is important to study the trend of the most cited publications to grasp the elements of context, economic policy and related to the institutional organization that can push countries to have more advantages in terms of high-level scientific publications.
The article proceeds as follows: the second paragraph presents a literature review, the third paragraph contains the analysis of the econometric model, the fourth paragraph presents the clustering model with the k-Means algorithm, the fifth paragraph contains the network analysis, the sixth paragraph refers to the use of machine learning for prediction with Original Data-OD, the seventh paragraph refers to prediction with Augmented Data-AD, and the eighth paragraph concludes. The appendix contains the metric, clustering, and machine learning results.
Literature Review
A summary of the literature relating to the most cited publications is presented below. As will be evident in the discussion, the number of journals, authors, themes, and countries that fall within the top 10% of the most cited scientific publications is very small regardless of the disciplinary sector of application. (Alsharif, 2020) Analyze about 137 journals articles between 2007 and 2018 related to neuromarketing. The authors verify that most of the published articles, i.e. 52% were published in the USA, Spain, UK, Italy and Germany compared to the remainder that was produced in 32 other countries. (Gaviria-Marin, 2020) Analyze the trend of publications for the Journal of Knowledge Management-JKM which in 2017 celebrated its 20th anniversary. It is a journal that in 2022 has an h-index of 124 reported in Scimago. The authors analyzed the publications between 1997 and 2016. It is a journal with a high standing in the following disciplines: Management of Technology and Innovation and Strategy and Management. The authors verify the presence of a positive evolution on the number of publications in the period considered. The countries that contribute most to scientific publications in the Journal of Knowledge Management are the United States, the United Kingdom. Europe is the most productive geographic area. (Patil, 2020) Use bibliometric analysis to verify the progress of publications on childhood caries between 1950 and 2019. The authors classified the articles based on citations. About 10,578 published articles were analyzed and among these only 100 were considered among the most cited. The results show that: the most cited articles appeared in 34 journals; items were from 25 countries; the USA participated more than others in publications with a number of articles equal to 54 out of 100; among the most cited studies are systematic reviews. (Yuan, 2020) Use the tools of bibliometric analysis to verify the technical characteristics of the scientific articles most cited in the scientific community with reference to gastric diseases. The 100 most cited articles were obtained through Web of Science analysis. The database used included approximately 484,281 articles published between 1965 and 2019. The article with the most citations obtained 4,017 citations and the least cited 604 citations. On average, the most cited articles obtained about 1,149 citations. Geographically, the authors verified that 69 articles were produced in the US, 17 in the UK and 11 in Japan. The institution with the most articles in the ranking of the most cited is the Royal Perth Hospital. The 100 most cited articles were published in 47 journals. 25% of the authors have at least 2 or 3 of the most cited articles. (Ahmad P, 2020) Analyze the 50 most cited articles in the journal Dental Traumatology. The data were obtained using Elsevier's Scopus. The articles were analyzed hierarchically based on the number of citations obtained. In total 2421 articles were analyzed. The top 50 articles by citation had between 117 and 580 citations. In 2002, 5 of the 50 most cited articles were published. The most prolific author in the top 50 wrote 12 articles. The United States and Denmark are among the largest contributors with a corresponding number of 12 and 6 articles. (Hodonu-Wusu, 2018) Carried out a bibliometric study with reference to the Library and Information Science-LIS between 1980 and 2017. The authors analyzed 500 articles. The results show that the most cited articles come from the US, the UK and China. 2016 was the year in which more articles were published in the LIS field. The total number of citations is equal to a value of 51,589 units in the period considered. (Ram, 2020) Consider the most cited articles related to biomass considering Web of Science. The analysis was carried out between 1900 and 2013 considering the articles that have at least 100 citations. The results show that the 3407 most cited articles were published between 1966 and 2011. The most cited article on biomass was published in the journal Ecology. The United States produced 49% of all the most cited items. The 13 institutions that have contributed most to the research are from the United States. (ElHawary, 2020) Verify the characteristics of the 50 most cited articles with reference to Covid 19. The authors collected the data considering three sources, namely: Web of Science, Scopus, and Google Scholar. The results show that the 50 most cited articles relating to Covid 19 were cited about 63,849 times in the four months prior to the analysis. A group of 14 authors is the most profiled. Half of the most cited articles were published in 3 journals. (M. Castillo-Vergara, 2018) Analyze the role of creativity in business studies with a historical analysis. The results show that while creativity was initially understood as a characteristic of individuals. Creativity was later defined as a characteristic of organizations. The authors analyzed the 100 most cited articles in the field of endodontic to verify their bibliometric characteristics. (B. Y?lmaz, 2010) the data was acquired through the analysis of the Web of Science database. The results show that the most cited article got 2115 citations. The articles have been published by 28 different journals among which the one that has obtained the most articles is the Journal of Endodontics. Among the main contributor countries in first place are the United States with a value of 41, in second place Sweden with a number of 17 and in third place Switzerland with a value of 8. The most profiled university is turned out to be the University of Umea with about 9 publications. (L.Valenzuela-Fernandez, 2019) Present a bibliometric analyte from the Journal of Business-to-Business Marketing-JBMM on the 25th anniversary. 329 articles are selected in the writings in the period between 1992 and 2016 for the JBBM. The main contributors are the USA, Germany, Norway, and the UK. (Hassona, 2019) Use bibliometrix to identify the characteristics of the most cited articles related to squamous cell carcinoma of the mouth, lips, and oropharynx. The Web of Science database was used to find the 100 most cited scientific articles. To find the articles, the following keywords were used: "Oral cancer", "Mouth cancer", "Oral squamous cell carcinoma", "Oropharyngeal carcinoma", "Oropharyngeal squamous cell carcinoma", "Lip cancer", "squamous cell carcinoma of the lip". The results show that the most cited articles obtained a number of citations equal to 38,215 units. The first article was published in 1984 and the last in 2013, most of the articles were published between 2000 and 2010. There are 46 journals in which the articles considered have been cited the most. Articles were cited an average of 33.2 times. The articles were from 19 countries. The US contributed the most to the literature among the most cited articles. The authors investigate the most cited articles that address the topic of scientific research on rice between 2008 and 2018 and include about 1219 of the most cited articles. (J. Sun e B. Z. Yuan, 2020) the authors selected around 5,100 authors from 84 countries with 277 leading journals from the most cited group. 10 of the selected articles received more than 1000 citations. among the most cited journals are "Plant Cell", "Plant Physiology", PNAS, Food Chemistry and Journal of Experimental Botany. Among the most cited countries are China, the US, Japan, the UK, and Germany. Among the institutions that have contributed most to scientific advancement are the Chinese Academy of Sciences, the Chinese Academy of Agricultural Sciences, Huazhong Agricultural University, Nanjing Agricultural University and Zhejiang Univ. (M. Gaviria-Marin, 2019) analyze the management of knowledge in the scientific and managerial literature with bibliometric tools. The authors used scientific references using the Web of Science. The authors found that the number of publications in knowledge management has grown significantly over the past decade. The first country by number of publications is the United States. (Yu Y, 2020) Consider the trend of citations of articles referring to Covid 19 using a bibliometric approach. The authors selected an issue of 3,626 on the covid theme. Of the 3,626 publications, about 2,649 have shown a connection with the words pneumonia and epidemiology. The Lancet magazine was the one with the highest publications, with a number equal to 211, and with the highest number of citations, for a value of 2,485 units. The most cited author was Christian Drosten of the Berlin virology institute with 389 references. The most cited institution is the Chinese Academy of Sciences with 1,597 citations. The nations that contributed most to the scientific literature on the subject were China, the USA, the UK, and Germany. (K. Ahmad, 2020) Quantify the importance of bibliometric analysis considering the impact of publications related to digital libraries. The authors used 4,206 articles in the period between 2002-2016 collected using the Web of Science. The results show that the most productive year of publication was 2016. From the point of view of scientific research, the USA is the country with the highest number of publications and citations while the University of Illinois ranks first among the institutions.
Econometric Model to Estimate the Determinants of Most Cited Publications in Europe
The results of some econometric models used to estimate the value of the most cited scientific publications at international level are presented below. The models used for the estimation are Panel Data with Fixed Effects, Panel Data with Random Effects, Pooled OLS and WLS. We considered 36 countries for the period 2010-2019. it is an indicator that analyzes 10% of the most cited scientific publications worldwide out of the total number of scientific publications. It is therefore a measure that considers the efficiency of research systems measured based on high-quality scientific publications. Obviously, this indicator has many limitations. In fact, many valuable scientific articles fail to be published in top journals for reasons related to the prices of publications, trend topics, or to the presence of co-authors who can have an international reputation. In this way, above all, the work of young PhD students and researchers is not represented in this metric as it is very difficult, if not impossible, for a young researcher to be able to write an article that falls within 10% of the most cited scientific publications. It is therefore a spurious, partial indicator, which is valid only for those researchers and scientists who have already established themselves, who have a lot of funds to publish and who follow the trend topics of the discipline. In fact, for example, a researcher who proposes new research, on a new topic, would not be able to find space in the most famous magazines. Therefore, the fact that a country has good results in terms of most cited scientific publications does not say anything about the ability of researchers to be innovative, productive and about the financial difficulties that many PhD students face during the development of their academic career. We have estimated the following equation:
The variable “Most Cited Publications” is positively associated with the following variables, namely:
Enterprise Births: is an indicator that calculates the percentage of new businesses born with more than 10 employees. There is a positive relationship between the ability to create new businesses with 10 employees and the number of "Most Cited Publications". It follows that the countries that have a very high business birth rate are also countries that have a more marked scientific vitality. Indeed, the countries that have the highest levels of scientific publications with the highest citations are also those that have significant responsiveness in terms of business creation (Costantiello, 2021). Specifically, it should be considered that countries that have a more effective and advanced research system may also have greater ability to create new businesses. Above all, the presence of advanced research systems can also be associated with the presence of a high birth rate also of start-ups and newcos (Costantiello, 2021).
Innovation Index: It is an indicator that measures the ability of a country to innovate from the point of view of technological innovation, considering the entrepreneurial, institutional, and financial aspects, as well as relating to research and development. The countries that have high levels of innovation index are also the countries that have a greater presence of the most cited articles. This relationship reflects the overall condition of technological innovation and research and development in a broad sense. In fact, if the systems of scientific research are highly developed then positive effects are generated both in terms of innovation index and in terms of the growth of publications that have a greater number of citations (A. Leogrande, 2022).
Attractive Research Systems: is a variable made up of three sub-variables, namely: International Scientific Co-Publications, Top 10% Most Cited Publications and Foreign Doctorate Students. It is therefore a variable that considers the ability of a research system to be attractive, competitive, and inserted in the international context of scientific research. There is therefore a positive relationship between the value of the attractive research system and the growth of the variable most cited publications. In other words, if the systems of scientific research are very attractive, there is also a growth in the quality of scientific research with a growth in the most cited publications (A. Leogrande, 2020).
Patent Applications: is an indicator that calculates the number of patent applications filed with respect to the gross domestic product. This indicator considers the ability of companies to develop new products, obtaining in return a significant competitive advantage vis-à-vis the market and the competition. The number of patents is therefore an indicator that measures the degree of innovation of the products considered. There is a positive relationship between the number of patents and the number of scientific articles most cited. The relationship is obvious as both the patents and the most cited scientific publications are the product of the scientific research system at national level. If a country therefore has a very advanced and internationally competitive system of scientific research, then it is likely that both the number of patents and the number of the most cited scientific publications will increase together.
Employment Share Manufacturing: is a variable that considers employment in the manufacturing sector over total employment. This value is calculated considering employment in the technology and knowledge-intensive sectors as a percentage of total employment. There is therefore a positive relationship between employment in manufacturing and knowledge-intensive sectors and the most cited scientific publications. This positive relationship can be understood considering that generally the countries where there is greater technological and scientific knowledge there is also a significant impact in terms of growth of manufacturing and of the most cited scientific publications. It follows that both employment in the manufacturing sector and the most cited scientific publications are the result of the same phenomenon, namely the development of scientific-technological knowledge at the country level (A. Costantiello and A. Leogrande, 2021).
GDP per Capita: is a variable that considers the value of gross internal products per capita. There is a positive relationship between the value of gross domestic product and the value of the most cited publications. This relationship may appear paradoxical. However, it must be considered that since the model of economic growth is based on the knowledge and information economy, it follows that the countries that have the most GDP also have more results in terms of successful scientific publications. Countries therefore become more prosperous by investing in technological innovation and research and development and to continue in economic growth they must continue to invest trying to have relevant outputs in terms of quality and international excellence.
Tertiary Education: is a variable that considers the percentage of the population aged between 25 and 34 who have completed tertiary education out of the total number of people who have post-secondary education. advanced skills from the point of view of training and human capital. Innovations in both STEM disciplines and other sectors that are needed to generate new products and services are taken into consideration. It is therefore also an indicator that reflects the university economic policies of the countries. There is therefore a positive relationship between the value of the population with tertiary education and the value of the most cited publications. This relationship is obvious considering that generally the scientists who write the most cited articles generally have a tertiary education.
Knowledge-Intensive Services Exports: is a variable that considers exports of knowledge-intensive services relative to the total value of exports. For example, exports of high-intensity services include the transport, telecommunications, audiovisual, financial services, and insurance sectors. This indicator considers the competitiveness of the knowledge-intensive service sector. The export of knowledge-intensive services is also generally associated with a high level of technological innovation present at country level and with significant investments in terms of Research and Development (Leogrande, Costantiello, Laureti, 2022). There is therefore a positive relationship between exports of knowledge-intensive services and the presence of high-level scientific publications. This relationship stems from the fact that if a country is positively oriented towards technological innovation and research and development then it also has a growth in exports of knowledge-intensive services and a high level of high-quality scientific publications (Leogrande, Costantiello, Laureti, 2022).
Turnover Share SMEs: is the share of turnover of small and medium-sized enterprises in total on the value of the overall turnover of the economy. For small and medium-sized enterprises, we consider companies that have a number of employees included in the range between 10 and 249. Financial and insurance activities are excluded from this analysis. There is a positive relationship between the turnover of SMEs and the value of the most cited scientific publications at international level. This relationship can be better understood considering that generally the most innovative and evolved economies from the point of view of research and development are also the most dynamic ones, which therefore have a very efficient entrepreneurial class even in SMEs (Leogrande, Costantiello, Laureti, 2021). Furthermore, in highly technologically advanced countries, many start-ups are also generally set up, which generally operate as small and medium-sized enterprises, and which nevertheless can reach very high levels of turnover Costantiello, Laureti, Cristoforo, Leogrande 2021.
New Doctorate Graduates: is a variable that considers the number of new research doctorates per 1000 inhabitants between the ages of 25 and 34 compared to the total number of the population between 25 and 34 years. There is a positive relationship between the number of people who have PhDs in the age group between 25 and 34 years and the presence of publications with high levels of citations at international level. The relationship appears quite tautological. In fact, where there is a large diffusion of research doctorates, there is also a human capital more able to generate scientific research products that are of an excellent level. This report highlights the need to hold together the formation of human capital, the orientation towards technological innovation and research and development in the context of the country's competitiveness also from the point of view of scientific publications(Table 1).
| Table 1 Estimation Of The Value Of Most Cited Publications In Europe |
||||||||||
|---|---|---|---|---|---|---|---|---|---|---|
| POOLED OLS | Fixed Effects | Random Effects | WLS | |||||||
| Coefficient | p-Value | Coefficient | p-Value | Coefficient | p-Value | Coefficient | p-Value | Averge | ||
| Costant | -153,189 | -0,27582 | -0,345522 | -0,835207 | -0,7471 | |||||
| A1 | Attractive Research systems | 0,365797 | *** | 0,4532 | *** | 0,439634 | *** | 0,472891 | *** | 0,43288 |
| A5 | Broadband Penetration | -0,0442169 | *** | -0,0466 | *** | -0,0467108 | *** | -0,04033 | *** | -0,0445 |
| A9 | Employment fast-growing enterprises of innovative sectors | -0,0490462 | *** | -0,04184 | ** | -0,0434674 | *** | -0,056621 | *** | -0,0477 |
| A12 | Employment share Manufacturing | 0,377243 | *** | 0,31538 | *** | 0,331108 | *** | 0,244245 | *** | 0,31699 |
| A13 | Employment share Services | -0,225647 | * | -0,32806 | *** | -0,327642 | *** | -0,256771 | *** | -0,2845 |
| A14 | Enterprise births | 333,967 | ** | 275,524 | *** | 278,585 | *** | 310,118 | *** | 299,549 |
| A19 | Foreign doctorate students | -0,075345 | *** | -0,0914 | *** | -0,0888332 | *** | -0,089733 | *** | -0,0863 |
| A21 | GDP per capita | 0,368156 | ** | 0,27433 | ** | 0,282663 | *** | 0,234547 | ** | 0,28992 |
| A22 | Government procurement of advanced technology products | -13,432 | *** | -122,024 | *** | -123,826 | *** | -113,223 | *** | -12,335 |
| A23 | Human resources | -0,433302 | *** | -0,27966 | *** | -0,297493 | *** | -0,386363 | *** | -0,3492 |
| A24 | Innovation index | 0,862724 | *** | 0,77289 | *** | 0,786742 | *** | 0,715815 | *** | 0,78454 |
| A29 | Intellectual assets | -0,206894 | *** | -0,17779 | *** | -0,181694 | *** | -0,13122 | *** | -0,1744 |
| A30 | International co-publications | -0,0465722 | ** | -0,07222 | *** | -0,0688766 | *** | -0,084115 | *** | -0,0679 |
| A31 | Knowledge-intensive services exports | 0,181532 | *** | 0,19113 | *** | 0,191261 | *** | 0,207283 | *** | 0,1928 |
| A37 | New doctorate graduates | 0,204057 | *** | 0,14333 | *** | 0,15131 | *** | 0,176494 | *** | 0,1688 |
| A38 | Non-R&D innovation expenditure | -0,0822952 | *** | -0,06195 | *** | -0,0647763 | *** | -0,069573 | *** | -0,0696 |
| A40 | Patent applications | 0,458058 | *** | 0,33164 | *** | 0,346351 | *** | 0,358258 | *** | 0,37358 |
| A43 | Private co-funding of public R&D expenditures | -0,198721 | *** | -0,16964 | *** | -0,17375 | *** | -0,189993 | *** | -0,183 |
| A47 | R&D expenditure public sector | -0,128652 | *** | -0,13161 | *** | -0,131962 | *** | -0,07295 | *** | -0,1163 |
| A51 | Share Knowledge-intensive services | -0,493643 | *** | -0,27367 | ** | -0,287842 | ** | -0,313607 | *** | -0,3422 |
| A53 | Tertiary education | 0,22084 | *** | 0,17058 | *** | 0,175917 | *** | 0,210382 | *** | 0,19443 |
| A58 | Turnover share SMEs | 0,166697 | * | 0,20487 | *** | 0,204873 | *** | 0,17515 | *** | 0,1879 |
The econometric results also show that the trend of the Most Cited Publications variable is negatively correlated to the following variables:
Broadband Penetration: is an indicator that considers the penetration of broadband with respect to the total number of companies. That is, in the numerator they consider the value of the companies that have a maximum download speed and, in the denominator, the total number of companies. Broadband (Leogrande, Magaletti, Cosoli, Massaro 2022) penetration is a necessary factor for Europe's economic growth from the point of view of digitization and the information economy. The fact that there are many companies that have access to fast broadband opens greater possibilities for the national economy to achieve greater levels of economic growth. There is a negative relationship between the value of broadband penetration and the value of high-level scientific publications. This relationship can be better understood considering that the fact that there is a fast broadband (Leogrande, Magaletti, Cosoli, Massaro 2022) is not a unique determinant of the most advanced countries from the point of view of scientific research. It follows that investment in simple material infrastructures, however necessary it is alone, cannot support the dissemination of a scientific culture and professionalism capable of generating complex outputs such as high-level scientific publications (Leogrande, Costantiello, Laureti 2021).
Employment Fast-Growing Enterprises of Innovative Sectors: is a variable that considers the number of employees in high-growth companies in the most innovative sectors. By innovative sectors we therefore mean the tech-oriented portion of a set of areas of economic activity that are both in the primary sector as for example in the field of oil extraction, in the manufacture of chemical, pharmaceutical, electronic, and motor vehicle products. Also included are sectors relating to transport, insurance, and financial and IT services. It is possible to verify the presence of a negative relationship between the value of companies that have a growing number of employees in very innovative companies and the production of high-quality scientific articles at an international level. This report highlights the fact that a tech-oriented industry that hires employees is not necessarily also able to support a high-level research system. In this sense it would be necessary to increase the relations between the industrial system and the research system to ensure that there are outputs that can also be evaluated in the sense of high-level scientific publications (Leogrande, Costantiello, Laureti 2022).
International Co-Publications: is an indicator that considers the number of scientific publications in which at least one of the authors is foreign as the numerator and the total population as the denominator. The fact that they visit international scientific publications with foreign co-authors is a proxy of the high level of research and development achieved at the country level. However, it must be considered that there is a negative relationship between the value of international scientific co-publications and the value of the most cited scientific publications at international level. This relationship can be explained by considering that the works that are qualitatively excellent also the results of international cooperation are not necessarily the ones most cited. In fact, to be cited it is often necessary to have co-authors who are already famous in the field, or to publish in very expensive and noble magazines. And it is not certain that international scientific cooperation has the characteristics necessary to reach the highest levels of scientific citations. This is because basically using the citation metric does not really allow us to evaluate the quality of scientific research (Leogrande, Costantiello, Laureti 2022).
Non-R&D Innovation Expenditure: is an indicator that considers the expenditure for technological innovation of companies with the exclusion of expenditure on Research and Development determined at the intramural and extramural level as a percentage of the total value of the total turnover of the companies (Costantiello, Laureti, Leogrande, 2022).
This variable therefore considers the amount of expenditure on technological innovation net of expenditure on Research and Development. That is, there are expenses in technological innovation such as, for example, the expense of investments for equipment, machinery and the acquisition of patents and concessions that are obviously not expenses in Research and Development. There is therefore a negative relationship between the value of expenditure on technological innovation that does not constitute research and development and the scientific publications with the highest number of citations. This relationship can be explained by considering that only investment in research and development can generate relevant outputs in scientific terms such as, for example, the scientific publications cited most internationally (Leogrande, Massaro, Galiano, 2020).
Foreign Doctorate Students: is a variable that considers the number of foreign PhD students compared to the total number of PhD students. The share of foreign doctoral students is a variable capable of demonstrating the ability to attract researchers from abroad. However, there is a negative relationship between the presence of foreign PhD students and the presence of scientific articles with the highest number of citations. That is, the fact that a country intercepts PhD students from abroad does not guarantee that there are relevant results in terms of scientific citations at an international level. This relationship is also negative because generally foreign PhD students, even if they are very good and produce high quality scientific research, are not well known enough to be able to publish in major international scientific journals or associate with co-authors already famous in the discipline. For this reason, the use of the citation metric may not be sufficient to evaluate the quality of scientific research at a national level, especially if we consider the role of foreign doctoral students and young researchers (Laureti, Costantiello, Matarrese, Leogrande 2020).
R&D Expenditure Public Sector: refers to the complex of research and development expenses that have been obtained through government investment including through education with respect to Gross Domestic Product. This variable captures some aspects of the financial support to research and development (Laureti, Costantiello, Leogrande 2020). Spending on research and development makes it possible to lay the foundations for the knowledge economy. Therefore, the fact that a country invests in research and development is a very significant indicator of the ability of countries to be competitive and to generate wealth at the national level and in the context of the European Union. Public spending on Research and Development is necessary to orient the economic system towards the knowledge economy by accumulating technology and innovation. There is a negative relationship between public R&D spending and the production of internationally cited scientific articles. This relationship can be better understood considering that public investment is not enough to generate high-level scientific publications. In fact, it is also necessary to invest in human capital and it is also necessary that there is a contribution from private companies and organizations. Furthermore, it is also very important that there is a first-level university system capable of generating scientific and intellectual products of excellence (Leogrande, Massaro, Galiano 2020).
Intellectual Assets: is a variable that considers the sum of three different sub-variables, namely: PCT patent Applications, Trademark Applications and Design Applications (Leogrande, Costantiello, Laureti, Leogrande 2021). There is therefore a negative relationship between the value of intellectual assets and the presence of a set of scientific publications that are most cited internationally. This negative relationship can be better understood considering that the generation of intellectual assets is not necessarily capable of producing scientific publications that are listed on an international level. Although a country that invests in intellectual assets certainly has a very high human capital. However, this human capital is not necessarily capable of producing internationally cited scientific publications. In fact, to obtain the output of having scientific publications cited worldwide, it is necessary to invest not only in human capital and intellectual capital, but above all it is necessary to invest in universities and in the competitiveness of national research systems (Costantiello, Laureti, Leogrande 2021).
Private Co-Funding of Public R&D Expenditures: is an indicator that measures private co-financing of public spending in terms of Research and Development as a percentage of GDP. This variable therefore seeks to verify the impact of private funding on the research and development sector. There is therefore a negative relationship between the value of private spending on Research and Development and the value of the most cited scientific publications at international level. It must be considered that obviously the research and development system certainly also involve the university. However, to ensure that there are more scientific publications cited at the international level, there must also be more direct investments in the university (Leogrande, Birardi, Massaro, Galiano 2019). Alternatively, it is necessary to create both university and non-university centers of excellence that can attract qualified human capital in the exercise of the scientific profession capable of creating significant outputs in terms of internationally cited scientific publications.
Employment Share Services: is an indicator that considers employment in the service sector as a percentage of total employment. There is a negative relationship between the values of employment in services compared to the number of scientific publications cited internationally. It follows that although the service sector may be positively connected with the sector of high-level scientific research, this relationship is not so stringent, and indeed it is even negative. This is because the services sector in the broad sense also includes trade, finance, and activities that are not necessarily of high added value as in the case of high-level scientific publications. In this regard, it is necessary to invest in research centers and university centers of excellence to generate the output of the most cited scientific publications at international level.
Employment Share Knowledge-Intensive Services: calculates the percentage of employees in the knowledge-intensive services sector or in the transport sector, publishing, audiovisual production, programming, consulting, legal activities, and research and development. There is a negative relationship between the value of employment in knowledge-intensive services and the value of the most cited scientific publications internationally. Obviously, the fact that there are sectors with a high intensity of knowledge is positive from the point of view of technological innovation. However, for high-level scientific publications to grow there must be investments in research centers and universities of excellence.
Human Resources: it is a variable consisting of three sub-variables namely new Doctorate Graduates, Population Aged 25-34 with Tertiary Education, Lifelong Learning (Costantiello, Laureti, Leogrande, 2022). There is a negative relationship between the value of human resources (Leogrande, Massaro, Galiano, 2020) and the value of the most cited scientific publications at international level. Such a relationship may seem counterfeit. However, it should be considered that of the three sub variables that make up the Human Resources (Leogrande, Costantiello, 2021) macro-variable, only the first, that is New Doctorate Graduates, has a positive impact in terms of the growth of scientific publications at an international level as obviously research doctorates tend to write and publish in scientific journals. On the other hand, the other two variables, namely Population Aged 25-34 with Tertiary Education and Lifelong Learning, do not impact either the scientific publications in a broad sense or the most specifically cited scientific publications. Therefore, it is necessary to repeat that only the investment in research centers and universities of excellence allows generating the output of high-level scientific publications.
Government Procurement of Advanced Technology Products: it is a variable that considers government spending on the demand for high-tech products. This indicator varies from 1 to 7 since public bodies in purchasing products and goods express a low or high value of technological innovation. That is, it is a variable that captures the ability of the state to stimulate the demand for technologically advanced products. There is a negative relationship between Government Procurement of Advanced Technology Products and the value of the most cited scientific publications internationally. This relationship can be understood considering that government demand does not impact scientific production but rather the ability of companies to supply innovative products to public bodies(Figure 1).

Figure 1: The Determinants Of Most Cited Publications In Europe. Average Value. Clusterization With K-Means Algorithm With A Challenge Between Silhouette Coefficient And The Elbow Method.
The following analysis proposes a clustering of European countries by value of the trend of the most cited publications. However, before introducing clustering methodologies based on the k-Means algorithm, an analysis of the rankings of European countries by value of the Most Cited Publications is proposed. In first place by value of the Most Cited Publications in 2021 are the Netherlands with a value of 155.99, followed by Switzerland with a value of 151.20 and the United Kingdom with a value of 146.54 units. In the middle of the table there is France with a value of 88.36, followed by Estonia with a value of 88.27 units and Portugal with a value of 87.81. North Macedonia closes the ranking with a value of 21.52, followed by Bulgaria with a value of 15.78 units and Ukraine with a value of 10.18. Furthermore, considering the percentage change between 2014 and 2021 in terms of growth of the most cited publications, it is possible to verify that: Latvia is in first place with a value of 560.48 equal to an amount of 33.41, followed by Bosnia with a change of 353.77 units equal to an amount of 24.37 and from Slovakia with a change equal to an amount of 166.08 units equal to a value of 26.11 units. In the middle of the table there is Finland with a value equal to 10.90% equal to a value of 12.21 units, followed by Greece with a value equal to 9.60% equal to an amount of 7.64 units, and by North Macedonia with a value of 4.51% equal to an amount of 0.93 units. Cyprus closes the ranking with a variation equal to a value of -15.95% equal to an amount of -17.98 units, followed by Israel with a variation of -16.47% equal to an amount of -18.43 units. And from Ukraine with a value of 10.18 units(Figure 2).

Figure 2: Methodological Model Used To Optimize Concretization With The K-Means Algorithm Through A Comparison Between The Silhouette Coefficient Method And The Elbow Method. The Choice Of The Best Performing Method Is Based On The Ability To Represent The Heterogeneity, Complexity, And Variety Of European Economic Areas And National Research Systems.
However, following the analysis of the rankings, a clustering is proposed to verify if there are any groupings that can identify the geographical dimensions of the distribution of the most cited publications. We use data from European Innovation Scoreboard-EIS for the period 2014-2021. Our results show the presence of the following clusters:
• Cluster 1: Slovakia, Romania, Poland, Croatia, Bosnia, Latvia, Lithuania, Serbia, North Macedonia, Bulgaria, Czech Republic, Hungary, Montenegro, Turkey, Ukraine, Malta, Slovenia, Estonia;
• Cluster 2: Norway, Ireland, Finland, Sweden, Belgium, Germany, Austria, Luxembourg, United Kingdom, Denmark, Switzerland, Italy, Netherlands, Iceland, Israel, France, Portugal, Cyprus, Spain, Greece.
From a strictly quantitative point of view and considering the median of the value of the most cited publications, it is possible to verify that the median value of the countries of Cluster 2-C2 is high compared to the median value of the countries of Cluster 1-C1. That is: C2=11,32> C1=43,59.If we consider the analysis from a strictly geographical point of view, then we can verify that the Western European countries, which substantially correspond to the C2 countries, turn out to be considerably more productive in terms of most cited publications than the Eastern European countries, which are the countries of C1. However, this contrast between the countries of Western Europe and the countries of Eastern Europe appears excessively simplified and lacks the ability to highlight the presence of European geographical areas that are differentiated in terms of most cited publications. For this reason, the optimization method of the k-Means clustering algorithm through the Silhouette coefficient is considered inefficient. Therefore, a further analysis of the clustering is proposed below, again carried out with the k-Means algorithm, this time, however, optimized using the Elbow method(Figure 3).

Figure 3: Clusterization K-Means Algorithm Optimized With Silhouette Coefficient.
Therefore, applied the Elbow method in the optimization of the k-Means clustering algorithm, three different clusters are detected. The clusters are composed as follows:
• Cluster 1: Spain, Portugal, Greece, France, Israel, Cyprus, Italy, Iceland, Estonia, Austria, Germany, Slovenia;
• Cluster 2: United Kingdom, Denmark, Switzerland, Sweden, Belgium, Netherlands, Norway, Luxembourg, Ireland, Finland;
• Cluster 3: Slovakia, Romania, Bosnia, Croatia, Poland, Latvia, North Macedonia, Lithuania, Serbia, Bulgaria, Czech Republic, Ukraine, Montenegro, Hungary, Turkey, Malta,
Therefore, by applying the analysis of the median we can verify the existence of the following order, namely: 
From a strictly geographical point of view, we can verify that through the application of the Elbow method it is possible to verify that the Scandinavian countries, with the addition of the UK, Ireland, Switzerland, Belgium, and the Netherlands, are in first place in terms of value of the most cited publications. In second place are the countries of continental, western and southern Europe. In third place are the countries of Eastern Europe. This representation obtained through the Elbow method is preferable to the clustering achieved with the Silhouette coefficient as it offers a greater ability to represent the heterogeneity, variety, and complexity of the various European areas in terms of most cited publications(Figure 4).

Figure 4: Optimal Number Of Clusters The K-Means Algorithm Optimized With The Elbow Method.
Network Analysis with Manhattan Distance
A network analysis is carried out below with the use of the Manhattan distance. The use of network analysis in this context is useful for verifying the presence of interconnections between countries with reference to the "Most Cited Publications" variable. We use data from the European Innovation Scoreboard-EIS for the period 2014-2021. The analysis shows the presence of 4 complex network structures, i.e. consisting of more than two connections, and two simplified network structures, i.e. consisting of only two connections(Figure 5).

Figure 5: Clusterization With K-Means Algorithm Optimized With The Elbow Method.
There is a complex network structure between Latvia, Bosnia, Lithuania, North Macedonia, Croatia, Slovakia, Poland, Lithuania and Serbia. Particularly:
• North Macedonia has a connection with Croatia for a value of 0.27, and with Romania it covers a value of 0.25;
• Croatia has a connection with Romania for a value of 0.19 and with North Macedonia for a value of 0.27;
• Romania has a connection with North Macedonia for a value of 0.25, with Croatia for a value of 0.19, with Bosnia for a value of 0.24, with Slovakia for a value of equal to 0.19;
• Bosnia has a connection with Romania for a value equal to 0.24, with Slovakia for a value equal to 0.22, with Latvia for a value equal to 0.13;
• Latvia has a connection with Bosnia for a value of 0.13 and with Slovakia for a value of 0.22;
• Slovakia has a connection with Bosnia for a value equal to 0.22, with Latvia equal to a value of 0.22, with Lithuania for a value equal to 0.27 and with Poland for a value equal to 0.2;
• Lithuania has a connection with Slovakia for a value of 0.27 and with Poland for a value of 0.22;
• Poland has a connection with Slovakia for a value of 0.2, with Lithuania for a value of 0.22 and with Serbia for an amount of 0.24.
There is a complex network structure between France, Israel, Portugal and Spain. Particularly:
• France is associated with Portugal with a value of 0.22, and with Israel with a value of 0.18;
• Israel is positively associated with Portugal with a value of 0.26 and France with a value of 0.18;
•Portugal is positively associated with Israel for a value of 0.26, France for a value of 0.22 and Spain for a value of 0.22;
•Spain is positively associated with Portugal with a value of 0.22.
There is a complex network structure between Finland, Austria and Germany. Particularly:
• Finland has a connection with Austria for a value of 0.27;
• Austria has a connection with Finland for a value of 0.27 and with Germany for a value of 0.17;
• Germany has a connection with Austria for a value of 0.17 units.
There is a connection between Turkey, Hungary and the Czech Republic. In particular:
• Turkey is connected to Hungary with a value of 0.21;
• Hungary is connected to Turkey for a value of 0.211 and the Czech Republic for a value of 0.25;
• The Czech Republic is connected to Turkey for a value of 0.25.
In addition, there are also three simplified network structures or consisting of a connection between only two countries, namely:
• Denmark is connected to Switzerland with a value of 0.27 and vice versa;
• Sweden is connected to Belgium for a value of 0.19 and vice versa;
• Ireland is connected to Norway for a value of 0.19 and vice versa.
Machine Learning and Prediction with Original Data
Below is a comparison between 10 different machine learning algorithms for the edition of the value of the “Most Cited Publications” variable (Massaro, Magaletti, Cosoli, Leogrande, Cannone, 2021) . The algorithms were trained with 80% of the available data. The performance of the algorithms was measured based on the ability to reduce statistical errors MAE, MSE, RMSE and the maximization of R2 (Massaro, Magaletti, Cosoli, Giardinelli, Leogrande, 2022). We use data from the European Innovation Scoreboard-EIS for the period 2014-2021 (Figure 6).

Figure 6: The Most Relevant Network Structure Revealed With The Application Of The Manhattan Distance.
The results show the presence of the following algorithm ordering, that is:
• SGD-Stochastic Gradient Descendent with a payoff value of 4;
• kNN with a payoff value of 8;
• Random Forest with a payoff value of 15;
• AdaBoost with a payoff value of 17;
• Gradient Boosting with a payoff value of 19;
• Linear Regression with a payoff value of 22;
• Tree with a payoff value of 27;
• SVM-Support Vector Machine with a payoff value of 32;
• Constant with a payoff value of 36;
• Neural Network with a payoff value of 40.
Therefore, the best performing algorithm is SGD-Stochastic Gradient Descendent. By applying the SGD algorithm, it is possible to predict the trend of the “Most Cited Publications” variable in the various countries. There are some countries for which an increase in the value of the variable is predicted, that is:
• North Macedonia with a variation from an amount of 21.52 units up to a value of 33.57 units or equal to a growth of 12.06 units equal to an amount of 56.04%;
• France with a variation from an amount of 88.36 units up to a value of 98.25 units or equal to a variation of 9.89 units equal to a value of 11.19%;
• Bulgaria with a variation from an amount of 15.78 units up to a value of 25.17 units or equal to an amount of 9.39 units per person at a value of 59.51%;
• Portugal with a variation from an amount of 87.81 units up to a value of 95.46 units or equal to an amount of 7.64 units or equal to an amount of 8.7%;
• Serbia with a variation from an amount of 35.24 units up to a value of 42.45 units or equal to an amount of 72.1 units equal to an amount of 20.46%;
• Israel with a variation from an amount of 93.46 units up to a value of 98.93 units or equal to an amount of 5.47 units equal to an amount of 5.85%;
• Ukraine with a variation from an amount of 10.18 units up to a value of 15.54 units or equal to an amount of 5.36 units equal to an amount of 52.69%;
• Belgium with a variation from an amount of 126.22 units up to a value of 131.53 units or equal to an amount of 5.31 units equal to an amount of 4.21%;
• Belgium with a variation from an amount of 126.22 units up to a value of 131.53 units or equal to an amount of 5.31 units equal to an amount of 4.21%;
• Germany with a variation from an amount of 105.56 units up to a value of 110.81 units or equal to an amount of 5.25 units equal to a value of 4.97%;
• Iceland with a variation from an amount of 99.83 units up to a value of 105.06 units or equal to a variation of 5.23 units equal to an amount of 5.24%;
• Czech Republic with a variation from an amount of 43.2 units up to a value of 48.32 units or equal to an amount of 5.12 units equal to an amount of 11.86%;
• Ireland with a variation from an amount of 115.24 units up to a value of 119.64 units or equal to an amount of 4.4 units equal to a value of 3.82%;
• Austria with a variation from an amount of 107.69 units up to a value of 111.45 units or equal to a variation of 3.76 units equal to an amount of 3.49%;
• Denmark with a variation from an amount of 141.08 units up to a value of 144.55 units or equal to a value of 3.48 units equal to a value of 2.46%;
• Hungary with a variation from an amount of 48.74 units up to a value of 51.39 units or equal to a variation of 2.65 units equal to a value of 5.44%;
• Bosnia with a variation from an amount of 31.26 units up to a value of 32.78 units or equal to an amount of 1.52 units equal to a value of 4.87%;
• Croatia with a variation from an amount of 32.08 units up to a value of 33.47 units or equal to a variation of 1.39 units equal to a value of 4.34%;
• Sweden with a variation from an amount of 130.71 units up to a value of 131.95 units or equal to a variation of 1.25 units equal to an amount of 0.95%;
• Spain with a variation from an amount of 91.1 units up to a value of 92.29 units or equal to a value of 1.19 units equal to an amount of .131%;
• Cyprus with a variation from an amount of 94.78 units up to a value of 95.61 units or equal to a value of 0.83 units equal to an amount of 0.88%;
• Norway with a variation from an amount of 120.79 units up to a value of 121.03 units or equal to an amount of 0.24 units equal to 0.2%.
Based on the application of the SGD-Stochastic Gradient Descendent algorithm, countries are also identified for which a reduction in the value of the "Most Cited Publications" trend is predicted, namely:
• Greece with a variation from an amount of 87.26 units up to a value of 87.23 units or equal to an amount of -0.03 units equal to a value of -0.03%;
• Lithuania with a variation from an amount of 40.82 units up to a value of 39.73 units or equal to a value of -1.09 units equal to a value of -2.68%;
• Switzerland with a variation from an amount of 151.21 up to a value of 149.59 or equal to an amount of -1.61 units equal to a value of -1.07%;
• Malta with a variation from an amount of 60.48 units up to a value of 58.77 units or equal to a value of -1.7 units equal to a value of -2.82%;
• Slovenia with a variation from an amount of 74.38 units up to a value of 70.5 units or equal to a value of -3.88 units equal to a value of -5.21%;
• Netherlands with a variation from an amount of 155.99 units up to a value of 152.11 units or equal to a value of -3.88 units equal to a value of -2.48%;
• Poland with a variation from an amount of 43.58 units up to a value of 39.65 units or equal to a value of -3.93 units equal to a value of -9.02%;
• Turkey with a variation from an amount of 56.73 units up to a value of 52.3 units or equal to an amount of -4.43 units equal to a value of -7.81%;
• Romania with a variation from an amount of 39.84 units up to a value of 35.26 units or equal to a value of -4.58 units equal to a value of -11.5%;
• Luxembourg with a variation from an amount of 126.72 units up to a value of 121.46 units or equal to an amount of -5.26 units equal to a value of -4.15%;
• Latvia with a variation from an amount of 39.37 units up to a value of 33.66 units or equal to a value of -5.71 units equal to an amount of -14.51%;
• Slovakia with a variation from an amount of 41.83 units up to a value of 36.04 units or equal to an amount of -5.79 units equal to a value of -13.85%;
•Slovakia with a variation from a value equal to 41.83 units up to an amount of 36.04 units or equal to an amount of -5.79 units equal to a value of -13.85%;
• United Kingdom with a variation from an amount of 146.54 units up to a value of 139.94 units or equal to a value of -6.6 units equal to a value of -4.5%;
•Italy with a change from an amount of 111.98 units up to a value of 103.72 or a change equal to an amount of -8.26 units equal to a value of -7.37%;
• Finland with a variation from an amount of 124.21 units up to a value of 115.06 units or equal to a value of -9.15 units equal to a value of -7.37%;
• Estonia with a variation from an amount of 88.27 units up to a value of 76.29 units or equal to a value of -11.97 units equal to a value of -13.56%;
• Montenegro with a variation from an amount of 61.48 units up to a value of 33.33 units or equal to a variation of -28.15 units equal to a value of -45.79%.
Machine Learning and Prediction with Augmented Data
Below is an analysis with Augmented Data-AD (Massaro, Magaletti, Giardinelli, Cosoli, Leogrande, 2022). The augmented data is constructed by adding to the time series from 2014 to 2021 an additional series that is the one produced by the SGD algorithm. In an extended form we can write the following formula:
OriginalData+Prediction=AugmentedData
In this way the comparison analysis between the algorithms is repeated. In particular, the algorithms are compared based on the minimization of statistical errors, i.e., MAE, MSE, RMSE and on the maximization of R-squared. The algorithms were trained with 80% of the available data. Based on the analysis carried out, the following sorting of algorithms by predictive capacity is generated, that is:
• Linear Regression with a payoff value of 4;
• SGD with a payoff value of 8;
• Gradient Boosting with a payoff value of 12;
•AdaBoost with a payoff value of 16;
• Random Forest with a payoff value of 20;
•kNN with a payoff value of 24;
• Tree with a payoff value of 28;
• SVM with a payoff value of 32;
•Constant with a payoff value of 36;
•Neural Network with a payoff value of 40.
Based on the application of the Linear Regression algorithm, it is possible to verify that there are countries for which a growth in the value of the most cited publication variable is predicted in the transition between Original Data-OD and Augmented Data-AD. These countries are:
• Montenegro with an increase from an amount of 33.33 units up to a value of 40.06 units or equal to a change equal to an amount of 6.73 units equivalent to a value of 20.19%;
•Bulgaria with a variation from an amount of 25.17 units up to a value of 26.77 units or equal to an amount of 1.6 units equal to a value of 6.37%;
• North Macedonia with a variation from an amount of 33.57 units up to a value of 35.39 units or equal to an amount of 1.82 units equal to a value of 5.42%;
• Latvia with a variation from an amount of 33.66 units up to a value of 34.57 units or equal to a value of 0.91 units equal to a value of 2.7%;
• Luxembourg with a variation from an amount of 121.46 units up to a value of 124.65 units or equal to a value of 3.19 units equal to an amount of 2.63%;
• Estonia with a variation from an amount of 76.29 units up to a value of 77.57 units or equal to a value of 1.27 units equal to a value of 1.67%;
• Poland with a variation from an amount of 39.65 units up to a value of 40.16 units or equal to a value of 0.51 units equal to a value of 1.28%;
• the Netherlands with a variation from an amount of 152.11 units up to a value of 153.9 units or equal to an amount of 1.79 units equal to a value of 1.18%;
• Lithuania with a variation from an amount of 39.73 units up to a value of 40.17 units or equal to a value of 0.44 units equal to an amount of 1.11%;
• Ireland with a variation from an amount of 119.64 units up to a value of 120.75 units or equal to a value of 1.11 units equal to a value of 0.93%;
•Norway with a variation from an amount of 121.03 units up to a value of 122.07 units or equal to a value of 1.04 units or equal to an amount of 0.86%;
• United Kingdom with a variation from an amount of 139.94 units up to a value of 140.94 units or equal to a value of 1 unit equivalent to a value of 0.72%;
• Slovakia with a variation from an amount of 36.04 units up to a value of 36.27 units or equal to a value of 0.23 units equal to a value of 0.64%;
• Israel with a variation from an amount of 98.93 units up to a value of 99.55 units or equal to a value of 0.62 units equal to a value of 0.62%;
• Germany with a variation from an amount of 110.81 units up to a value of 111.35 units or equal to a variation of 0.53 units equal to a value of 0.48%;
• Bosnia with a variation from an amount of 32.78 units up to a value of 32.89 units or equal to a value of 0.11 units equal to a value of 0.34%;
• France with a variation from an amount of 98.25 units up to a value of 98.58 units or equal to a value of 0.33 units equal to a value of 0.33%;
•Cyprus with a variation from an amount of 95.61 units up to a value of 95.89 units or equal to a value of 0.28 units equal to a value of 0.29%.
Furthermore, through the application of the Linear Regression algorithm it is possible to predict that there are a set of countries for which a reduction in the value of the "Most Cited Publications" is predicted. This reductive trend is detected in the transition from the prediction with the Original Data-OD optimized through the SGD algorithm to the prediction with the Augmented Data-AD optimized with the Linear Regression algorithm. The countries for which a reduction of the "Most Cited Publications" is predicted are:
• Portugal with a variation from an amount of 95.46 units up to a value of 95.41 units or equal to a value of -0.05 units equal to a value of -0.05%;
• Denmark with a reduction from an amount of 144.55 units up to a value of 144.43 units or equal to an amount of -0.12 units equal to a value of -0.09%;
• Italy with a change from an amount of 103.72 units up to a value of 103.46 units or equal to an amount of -0.26 units equal to a reduction of -0.25%;
• Greece with a variation from an amount of 87.23 units up to a value of 87.00 units or equal to a variation of -0.23 units equal to a value of -0.27%;
• Belgium with a variation from an amount of 131.53 units up to a value of 130.91 units or equal to a value of -0.62 units equal to a value of -0.47%;
• Finland with a variation from an amount of 115.06 units up to a value of 114.48 units or equal to a value of -0.58 units equal to a value of -0.5%;
• Ukraine with a variation from an amount of 15.54 units up to a value of 15.45 units or equal to a value of -0.09 units equal to an amount of -0.58%;
• Austria with a change from an amount of 111.45 units up to a value of 110.68 units or equal to a value of -0.77 units equal to a value of -0.69%;
• Spain with a variation from an amount of 92.29 units up to a value of 91.66 units or equal to a value of -0.63 units equal to a value of -0.69%;
• Turkey with a variation from an amount of 52.3 units up to a value of 51.83 units or equal to a value of -0.47 units equal to a value of -0.89%;
• Sweden with a variation from an amount of 131.95 units up to a value of 130.53 units or equal to a value of -1.42 units equal to a value of -1.08%;
• Switzerland with a variation from an amount of 149.59 units up to a value of 147.85 units or equal to a value of -1.74 units equal to a variation of -1.16%;
• Croatia with a variation from an amount of 33.47 units up to a value of 33.08 units or equal to a variation of -0.39 units equal to a value of -1.17%;
• Serbia with a variation from an amount of 42.45 units up to a value of 41.89 units or equal to a value of -0.56 units equal to a value of -1.32%;
• Slovenia with a variation from an amount of 70.5 units up to a value of 69.35 units or equal to a value of -1.15 units or equal to a value of -1.63%;
• Iceland with a variation from an amount of 105.06 units up to a value of 103.24 units or equal to a value of -1.82 units equal to a value of -1.74%;
• Czech Republic with a variation from an amount of 48.32 units up to a value of 47.39 units or equal to a value of -0.93 units equal to a value of -1.93%;
• Hungary with a variation from an amount of 51.39 units up to a value of 49.58 units or equal to a value of -1.81 units equal to a value of -3.52%;
• Romania with a variation from an amount of 35.26 units up to a value of 33.78 units or equal to a variation of -1.48 units equal to a value of -4.19%;
• Malta with a variation from an amount of 58.77 units up to a value of 56.14 units or equal to a value of -2.63 units equal to a value of -4.48%
Conclusions
In this article, the determinants of Most Cited Publications have been investigated. The econometric analysis has highlighted that the variables that among others have the greatest positive impact in terms of “Most Cited Publications” are “Innovation Index” and “Enterprise Birth” while those that have the most negative impact among others are “Government Procurement of Advanced Technology Products” and “Human Resources”. In general, it is possible to verify that the variables that are positively connected to the increase in the most cited scientific publications are those that generally involve the growth of investments in research centers and in the university system with attention to the formation of human capital of the highest level from the point of view scientific and technological. Subsequently, an analysis was presented using the k-Means clustering algorithm to verify the presence of groupings between countries. Since the k-Means algorithm requires the identification of optimization tools, both the Silhouette coefficient and the Elbow method were used. Between the two, the Elbow method was chosen which identified a number of clusters equal to 3. The Elbow method was preferred for its ability to give a greater representation to the complexity of the European Union from the point of view of scientific research. The data show that Scandinavian and Northern European countries lead the European ranking by value of the most cited scientific publications. Subsequently, a network analysis was conducted with the Manhattan distance method and 4 complex network structures, and 2 simplified network structures were found. Finally, 10 machine learning algorithms were compared to predict the future value of the “Most Cited Publications” by comparing the Original Data-ODs with the Augmented Data-ADs. The results show that the most efficient machine learning algorithm in predicting the most cited publications with Original Data is SGD, while the most efficient one for Augmented Data-AD is Linear Regression.
References
A. Costantiello, A. Leogrande e L. Laureti (2021). The Corporate Innovation in Europe. A Virtual Academic Conference, 10(130).
A. Costantiello, L. Laureti e A. Leogrande (2021). The SMEs Innovation in Europe. SSRN, n. 3964059.
Ahmad, K., Jian Ming, Z., & Rafi, M. (2018). Assessing the digital library research output: bibliometric analysis from 2002 to 2016.The Electronic Library,36(4), 696-704.
Indexed at, Google Scholar, Cross Ref
Ahmad, P., Vincent Abbott, P., Khursheed Alam, M., & Ahmed Asif, J. (2020). A bibliometric analysis of the top 50 most cited articles published in the Dental Traumatology.Dental Traumatology,36(2), 89-99.
Indexed at, Google Scholar, Cross Ref
ALSHARIF, A. H., Salleh, N. O. R. Z. M. D., & BAHARUN, R. (2020). Bibliometric analysis.Journal of Theoretical and Applied Information Technology,98(15), 2948-2962.
Castillo-Vergara, M., Alvarez-Marin, A., & Placencio-Hidalgo, D. (2018). A bibliometric analysis of creativity in the field of business economics.Journal of Business Research,85, 1-9.
Indexed at, Google Scholar, Cross Ref
Costantiello, A., & Leogrande, A. (2021). The innovation-employment nexus in Europe.
American Journal of Humanities and Social Sciences Research (AJHSSR),4(11), 166-187.
Costantiello, A., Laureti, L., & Leogrande, A. (2021). The Determinants of Firm Investments in Research and Development. InInternational Virtual Academic Conference Education and Social Sciences Business and Economics.
Costantiello, A., Laureti, L., & Leogrande, A. (2021). The Intellectual Assets in Europe.Available at SSRN 3956755.
Indexed at, Google Scholar, Cross Ref
Costantiello, A., Laureti, L., & Leogrande, A. (2022). Marketing and Organizational Innovations in Europe.Available at SSRN 4186167.
Indexed at, Google Scholar, Cross Ref
Costantiello, A., Laureti, L., & Leogrande, A. (2022). The Determinants of Lifelong Learning in Europe.Available at SSRN.
Indexed at, Google Scholar, Cross Ref
Costantiello, A., Laureti, L., De Cristoforo, G., & Leogrande, A. (2021). The Innovation-Sales Growth Nexus in Europe.Available at SSRN 3933407.
Indexed at, Google Scholar, Cross Ref
ElHawary, H., Salimi, A., Diab, N., & Smith, L. (2020). Bibliometric analysis of early COVID-19 research: the top 50 cited papers.Infectious diseases: research and treatment,13, 1178633720962935.
Indexed at, Google Scholar, Cross Ref
Gaviria-Marin, M., Merigó, J. M., & Baier-Fuentes, H. (2019). Knowledge management: A global examination based on bibliometric analysis.Technological Forecasting and Social Change,140, 194-220.
Indexed at, Google Scholar, Cross Ref
Gaviria-Marin, M., Merigo, J. M., & Popa, S. (2018). Twenty years of the Journal of Knowledge Management: A bibliometric analysis.Journal of Knowledge Management.
Indexed at, Google Scholar, Cross Ref
Hassona, Y., & Qutachi, T. (2019). A bibliometric analysis of the most cited articles about squamous cell carcinoma of the mouth, lips, and oropharynx.Oral Surgery, Oral Medicine, Oral Pathology and Oral Radiology,128(1), 25-32.
Indexed at, Google Scholar, Cross Ref
Hodonu-Wusu, J. O., & Lazarus, G. N. (2018). Major trends in LIS research: A bibliometric analysis.Library Philosophy and Practice, 1.
Laureti, L., Costantiello, A., & Leogrande, A. (2020). The finance-innovation nexus in Europe.IJISET-International Journal of Innovative Science, Engineering & Technology,7(12).
Laureti, L., Costantiello, A., Matarrese, M., & Leogrande, A. (2022). Foreign Doctorate Students in Europe.Available at SSRN 4032975.
Indexed at, Google Scholar, Cross Ref
Laureti, L., Costantiello, A., Matarrese, M., & Leogrande, A. (2022). The Employment in Innovative Enterprises in Europe.Available at SSRN.
Indexed at, Google Scholar, Cross Ref
Leogrande, A., & Costantiello, A. (2021). Human Resources in Europe. Estimation, Clusterization, Machine Learning and Prediction.Machine Learning and Prediction (September 29, 2021). American Journal of Humanities and Social Sciences Research (AJHSSR), e-ISSN.
Leogrande, A., Birardi, G., Massaro, A., & Galiano, A. M. (2019). Italian Universities: Institutional Mandate and Communitarian Engagement.European Journal of Educational Management,2(2), 85-110.
Indexed at, Google Scholar, Cross Ref
Leogrande, A., Costantiello, A., & Laureti, L. (2021). The Broadband Penetration in Europe.Journal of Applied Economic Sciences,16(3).
Indexed at, Google Scholar, Cross Ref
Leogrande, A., Costantiello, A., & Laureti, L. (2022). The Export of Medium and High-Tech Products Manufactured in Europe.Journal of Applied Economic Sciences,17(3).
Indexed at, Google Scholar, Cross Ref
Leogrande, A., Costantiello, A., & Laureti, L. (2022). The Exports of Knowledge Intensive Services. A Complex Metric Approach.A Complex Metric Approach (June 11, 2022).
Indexed at, Google Scholar, Cross Ref
Leogrande, A., Costantiello, A., Laureti, L., & Leogrande, D. (2021). The Determinants of Design Applications in Europe.Available at SSRN 3956853.
Indexed at, Google Scholar, Cross Ref
Leogrande, A., Costantiello, A., Laureti, L., & Matarrese, M. (2022). International Scientific Co-Publications in Europe.Available at SSRN 4117970.
Indexed at, Google Scholar, Cross Ref
Leogrande, A., Laureti, L., & Costantiello, A. (2022). The Innovation Index in Europe. Available at SSRN 4091597.
Indexed at, Google Scholar, Cross Ref
Leogrande, A., Magaletti, N., Cosoli, G., & Massaro, A. (2022). Broadband Price Index in Europe.Available at SSRN 4036690.
Indexed at, Google Scholar, Cross Ref
Leogrande, A., Magaletti, N., Cosoli, G., & Massaro, A. (2022). Fixed Broadband Take-Up in Europe.Available at SSRN 4034298.
Indexed at, Google Scholar, Cross Ref
Leogrande, A., Massaro, A., & Galiano, A. M. (2020). The attractiveness of European research systems.American Journal of Humanities and Social Sciences Research (AJHSSR),4(10), 72-101.
Leogrande, A., Massaro, A., & Galiano, A. M. (2020). The determinants of human resources in European countries during the period 2010-2019.American Journal of Humanities and Social Sciences Research (AJHSSR),4(9), 145-171.
Leogrande, A., Massaro, A., & Galiano, A. M. (2020). The impact of R&D investments on corporate performance in European Countries.American Journal of Humanities and Social Sciences Research (AJHSSR),4(7), 186-201.
Massaro, A., Magaletti, N., Cosoli, G., Giardinelli, V., & Leogrande, A. (2022). The Prediction of Diabetes.Available at SSRN 4135264.
Indexed at, Google Scholar, Cross Ref
Massaro, A., Magaletti, N., Cosoli, G., Leogrande, A., & Cannone, F. (2021). Use of Machine Learning to Predict the Glycemic Status of Patients with Diabetes.
Massaro, A., Magaletti, N., Giardinelli, V., Cosoli, G., Leogrande, A., & Cannone, F. (2022). Original Data Vs High Performance Augmented Data for ANN Prediction of Glycemic Status in Diabetes Patients.Available at SSRN 4082839.
Indexed at, Google Scholar, Cross Ref
Patil, S. S., Sarode, S. C., Sarode, G. S., Gadbail, A. R., Gondivkar, S., Kontham, U. R., & Alqahtani, K. M. (2020). A bibliometric analysis of the 100 most cited articles on early childhood caries.International Journal of Paediatric Dentistry,30(5), 527-535.
Indexed at, Google Scholar, Cross Ref
Ram, S., & Nisha, F. (2020). Highly Cited Articles in" Coronavirus" Research: A Bibliometric Analysis.DESIDOC Journal of Library & Information Technology,40(4).
Suna, J., & Yuan, B. Z. (2020). Mapping of the world rice research: A bibliometric analysis of top papers during 2008–2018.
Indexed at, Google Scholar, Cross Ref
Valenzuela-Fernandez, L., Merigó, J. M., Lichtenthal, J. D., & Nicolas, C. (2019). A bibliometric analysis of the first 25 years of the Journal of Business-to-Business Marketing.Journal of Business-to-Business Marketing,26(1), 75-94.
Indexed at, Google Scholar, Cross Ref
Y?lmaz, B., Dinçol, M. E., & Yalç?n, T. Y. (2019). A bibliometric analysis of the 103 top-cited articles in endodontics.Acta Odontologica Scandinavica,77(8), 574-583.
Indexed at, Google Scholar, Cross Ref
Yu, Y., Li, Y., Zhang, Z., Gu, Z., Zhong, H., Zha, Q., ... & Chen, E. (2020). A bibliometric analysis using VOSviewer of publications on COVID-19.Annals of translational medicine,8(13).
Indexed at, Google Scholar, Cross Ref
Yuan, F., Cai, J., Liu, B., & Tang, X. (2020). Bibliometric analysis of 100 top-cited articles in gastric disease.BioMed Research International,2020.
Declarations
Data Availability Statement. The data presented in this study are available on request from the corresponding author.
Funding. The authors received no financial support for the research, authorship, and/or publication of this article.
Declaration of Competing Interest. The authors declare that there is no conflict of interests regarding the publication of this manuscript. In addition, the ethical issues, including plagiarism, informed consent, misconduct, data fabrication and/or falsification, double publication and/or submission, and redundancies have been completely observed by the authors.
Appendix
Results of the Econometric Models
Modello 162: Pooled OLS, usando 360 osservazioni
Incluse 36 unità cross section
Lunghezza serie storiche = 10
Variabile dipendente: A36
| Coefficiente | Errore Std. | rapporto t | p-value | ||
|---|---|---|---|---|---|
| const | −1,53189 | 129,209 | −1,186 | 0,2366 | |
| A1 | 0,365797 | 0,0360449 | 10,15 | <0,0001 | *** |
| A5 | −0,0442169 | 0,00945195 | −4,678 | <0,0001 | *** |
| A9 | −0,0490462 | 0,0143413 | −3,420 | 0,0007 | *** |
| A12 | 0,377243 | 0,129274 | 2,918 | 0,0038 | *** |
| A13 | −0,225647 | 0,125502 | −1,798 | 0,0731 | * |
| A14 | 333,967 | 131,163 | 2,546 | 0,0113 | ** |
| A19 | −0,0753450 | 0,0180446 | −4,175 | <0,0001 | *** |
| A21 | 0,368156 | 0,155919 | 2,361 | 0,0188 | ** |
| A22 | −1,34320 | 0,130410 | −10,30 | <0,0001 | *** |
| A23 | −0,433302 | 0,0560687 | −7,728 | <0,0001 | *** |
| A24 | 0,862724 | 0,0895774 | 9,631 | <0,0001 | *** |
| A29 | −0,206894 | 0,0345621 | −5,986 | <0,0001 | *** |
| A30 | −0,0465722 | 0,0229042 | −2,033 | 0,0428 | ** |
| A31 | 0,181532 | 0,0293526 | 6,185 | <0,0001 | *** |
| A37 | 0,204057 | 0,0238173 | 8,568 | <0,0001 | *** |
| A38 | −0,0822952 | 0,0134623 | −6,113 | <0,0001 | *** |
| A40 | 0,458058 | 0,0622502 | 7,358 | <0,0001 | *** |
| A43 | −0,198721 | 0,0331040 | −6,003 | <0,0001 | *** |
| A47 | −0,128652 | 0,0362512 | −3,549 | 0,0004 | *** |
| A51 | −0,493643 | 0,163862 | −3,013 | 0,0028 | *** |
| A53 | 0,220840 | 0,0225342 | 9,800 | <0,0001 | *** |
| A58 | 0,166697 | 0,0932294 | 1,788 | 0,0747 | * |
| Media var. dipendente | 6,573,161 | SQM var. dipendente | 5,378,878 |
| Somma quadr. residui | 47073,41 | E.S. della regressione | 1,181,879 |
| R-quadro | 0,954679 | R-quadro corretto | 0,951721 |
| F(22, 337) | 3,226,762 | P-value(F) | 1,7e-211 |
| Log-verosimiglianza | −1388,023 | Criterio di Akaike | 2,822,045 |
| Criterio di Schwarz | 2,911,426 | Hannan-Quinn | 2,857,585 |
| rho | 0,752398 | Durbin-Watson | 0,559267 |
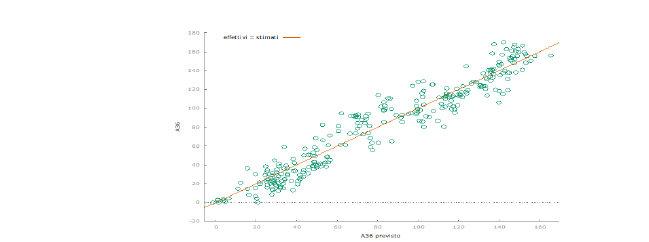
Modello 163: Effetti fissi, usando 360 osservazioni
Incluse 36 unità cross section
Lunghezza serie storiche = 10
Variabile dipendente: A36
| Coefficiente | Errore Std. | rapporto t | p-value | ||
|---|---|---|---|---|---|
| const | −0,275815 | 0,900861 | −0,3062 | 0,7597 | |
| A1 | 0,453202 | 0,0421737 | 10,75 | <0,0001 | *** |
| A5 | −0,0465959 | 0,0106371 | −4,380 | <0,0001 | *** |
| A9 | −0,0418390 | 0,0172045 | −2,432 | 0,0156 | ** |
| A12 | 0,315379 | 0,111369 | 2,832 | 0,0049 | *** |
| A13 | −0,328063 | 0,0888380 | −3,693 | 0,0003 | *** |
| A14 | 275,524 | 0,968623 | 2,844 | 0,0048 | *** |
| A19 | −0,0914041 | 0,0201278 | −4,541 | <0,0001 | *** |
| A21 | 0,274325 | 0,109978 | 2,494 | 0,0132 | ** |
| A22 | −1,22024 | 0,124052 | −9,836 | <0,0001 | *** |
| A23 | −0,279660 | 0,0664121 | −4,211 | <0,0001 | *** |
| A24 | 0,772891 | 0,0836194 | 9,243 | <0,0001 | *** |
| A29 | −0,177789 | 0,0377166 | −4,714 | <0,0001 | *** |
| A30 | −0,0722172 | 0,0235023 | −3,073 | 0,0023 | *** |
| A31 | 0,191127 | 0,0379861 | 5,031 | <0,0001 | *** |
| A37 | 0,143330 | 0,0299315 | 4,789 | <0,0001 | *** |
| A38 | −0,0619526 | 0,0134859 | −4,594 | <0,0001 | *** |
| A40 | 0,331642 | 0,0636643 | 5,209 | <0,0001 | *** |
| A43 | −0,169636 | 0,0351773 | −4,822 | <0,0001 | *** |
| A47 | −0,131605 | 0,0355078 | −3,706 | 0,0003 | *** |
| A51 | −0,273665 | 0,119336 | −2,293 | 0,0225 | ** |
| A53 | 0,170576 | 0,0265585 | 6,423 | <0,0001 | *** |
| A58 | 0,204868 | 0,0668387 | 3,065 | 0,0024 | *** |
| Media var. dipendente | 6,573,161 | SQM var. dipendente | 5,378,878 |
| Somma quadr. residui | 18725,17 | E.S. della regressione | 7,874,253 |
| R-quadro LSDV | 0,981972 | R-quadro intra-gruppi | 0,964741 |
| LSDV F(57, 302) | 2,885,914 | P-value(F) | 4,6e-232 |
| Log-verosimiglianza | −1222,091 | Criterio di Akaike | 2,560,183 |
| Criterio di Schwarz | 2,785,577 | Hannan-Quinn | 2,649,804 |
| rho | 0,285130 | Durbin-Watson | 1,209,389 |
Test congiunto sui regressori -
Statistica test: F(22, 302) = 375,601
con p-value = P(F(22, 302) > 375,601) = 7,36805e-205
Test per la differenza delle intercette di gruppo -
Ipotesi nulla: i gruppi hanno un'intercetta comune
Statistica test: F(35, 302) = 13,0629
con p-value = P(F(35, 302) > 13,0629) = 2,32341e-042
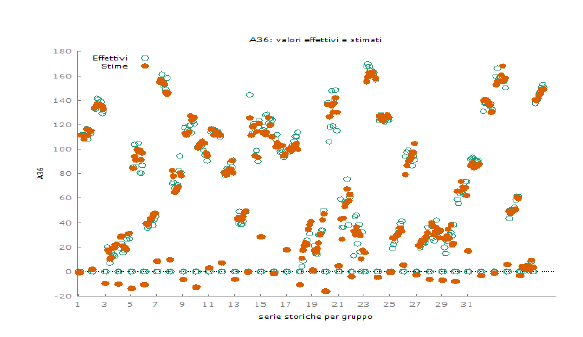
Modello 164: Effetti casuali (GLS), usando 360 osservazioni
Incluse 36 unità cross section
Lunghezza serie storiche = 10
Variabile dipendente: A36
| Coefficiente | Errore Std. | z | p-value | ||
|---|---|---|---|---|---|
| const | −0,345522 | 216,004 | −0,1600 | 0,8729 | |
| A1 | 0,439634 | 0,0392667 | 11,20 | <0,0001 | *** |
| A5 | −0,0467108 | 0,00999319 | −4,674 | <0,0001 | *** |
| A9 | −0,0434674 | 0,0160774 | −2,704 | 0,0069 | *** |
| A12 | 0,331108 | 0,106471 | 3,110 | 0,0019 | *** |
| A13 | −0,327642 | 0,0865648 | −3,785 | 0,0002 | *** |
| A14 | 278,585 | 0,941903 | 2,958 | 0,0031 | *** |
| A19 | −0,0888332 | 0,0188450 | −4,714 | <0,0001 | *** |
| A21 | 0,282663 | 0,107239 | 2,636 | 0,0084 | *** |
| A22 | −1,23826 | 0,118327 | −10,46 | <0,0001 | *** |
| A23 | −0,297493 | 0,0618497 | −4,810 | <0,0001 | *** |
| A24 | 0,786742 | 0,0798202 | 9,856 | <0,0001 | *** |
| A29 | −0,181694 | 0,0354655 | −5,123 | <0,0001 | *** |
| A30 | −0,0688766 | 0,0222317 | −3,098 | 0,0019 | *** |
| A31 | 0,191261 | 0,0351349 | 5,444 | <0,0001 | *** |
| A37 | 0,151310 | 0,0277503 | 5,453 | <0,0001 | *** |
| A38 | −0,0647763 | 0,0128368 | −5,046 | <0,0001 | *** |
| A40 | 0,346351 | 0,0603439 | 5,740 | <0,0001 | *** |
| A43 | −0,173750 | 0,0332422 | −5,227 | <0,0001 | *** |
| A47 | −0,131962 | 0,0338361 | −3,900 | <0,0001 | *** |
| A51 | −0,287842 | 0,116071 | −2,480 | 0,0131 | ** |
| A53 | 0,175917 | 0,0247627 | 7,104 | <0,0001 | *** |
| A58 | 0,204873 | 0,0651241 | 3,146 | 0,0017 | *** |
| Media var. dipendente | 6,573,161 | SQM var. dipendente | 5,378,878 |
| Somma quadr. residui | 50692,02 | E.S. della regressione | 1,224,649 |
| Log-verosimiglianza | −1401,353 | Criterio di Akaike | 2,848,707 |
| Criterio di Schwarz | 2,938,087 | Hannan-Quinn | 2,884,246 |
| rho | 0,285130 | Durbin-Watson | 1,209,389 |
Varianza 'between' = 146,011
Varianza 'within' = 62,0039
Theta usato per la trasformazione = 0,79817
Test congiunto sui regressori -
Statistica test asintotica: Chi-quadro(22) = 8937,31
con p-value = 0
Test Breusch-Pagan -
Ipotesi nulla: varianza dell'errore specifico all'unità = 0
Statistica test asintotica: Chi-quadro(1) = 438,208
con p-value = 2,65757e-097
Test di Hausman –
Ipotesi nulla: le stime GLS sono consistenti
Statistica test asintotica: Chi-quadro(22) = 9,54435
con p-value = 0,989987
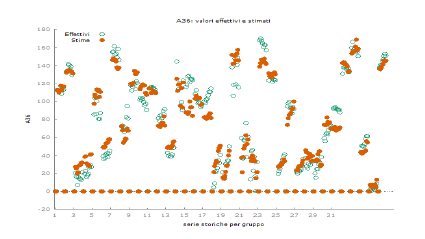
Modello 166: WLS, usando 360 osservazioni
Incluse 36 unità cross section
Variabile dipendente: A36
Pesi basati sulle varianze degli errori per unità
| Coefficiente | Errore Std. | rapporto t | p-value | ||
|---|---|---|---|---|---|
| const | −0,835207 | 0,685720 | −1,218 | 0,2241 | |
| A1 | 0,472891 | 0,0349635 | 13,53 | <0,0001 | *** |
| A5 | −0,0403298 | 0,00589727 | −6,839 | <0,0001 | *** |
| A9 | −0,0566209 | 0,00898322 | −6,303 | <0,0001 | *** |
| A12 | 0,244245 | 0,0937206 | 2,606 | 0,0096 | *** |
| A13 | −0,256771 | 0,0829759 | −3,095 | 0,0021 | *** |
| A14 | 310,118 | 0,570043 | 5,440 | <0,0001 | *** |
| A19 | −0,0897326 | 0,0139116 | −6,450 | <0,0001 | *** |
| A21 | 0,234547 | 0,109842 | 2,135 | 0,0335 | ** |
| A22 | −1,13223 | 0,0908376 | −12,46 | <0,0001 | *** |
| A23 | −0,386363 | 0,0239007 | −16,17 | <0,0001 | *** |
| A24 | 0,715815 | 0,0648135 | 11,04 | <0,0001 | *** |
| A29 | −0,131220 | 0,0269070 | −4,877 | <0,0001 | *** |
| A30 | −0,0841154 | 0,0169820 | −4,953 | <0,0001 | *** |
| A31 | 0,207283 | 0,0206155 | 10,05 | <0,0001 | *** |
| A37 | 0,176494 | 0,0135261 | 13,05 | <0,0001 | *** |
| A38 | −0,0695728 | 0,00810578 | −8,583 | <0,0001 | *** |
| A40 | 0,358258 | 0,0428434 | 8,362 | <0,0001 | *** |
| A43 | −0,189993 | 0,0192596 | −9,865 | <0,0001 | *** |
| A47 | −0,0729504 | 0,0256823 | −2,840 | 0,0048 | *** |
| A51 | −0,313607 | 0,0955344 | −3,283 | 0,0011 | *** |
| A53 | 0,210382 | 0,0123914 | 16,98 | <0,0001 | *** |
| A58 | 0,175150 | 0,0579814 | 3,021 | 0,0027 | *** |
Statistiche basate sui dati ponderati:
| Somma quadr. residui | 3,113,091 | E.S. della regressione | 0,961127 |
| R-quadro | 0,988519 | R-quadro corretto | 0,987769 |
| F(22, 337) | 1,318,897 | P-value(F) | 0,000000 |
| Log-verosimiglianza | −484,6607 | Criterio di Akaike | 1,015,321 |
| Criterio di Schwarz | 1,104,702 | Hannan-Quinn | 1,050,861 |
Statistiche basate sui dati originali:
| Media var. dipendente | 6,573,161 | SQM var. dipendente | 5,378,878 |
| Somma quadr. residui | 52991,57 | E.S. della regressione | 1,253,974 |
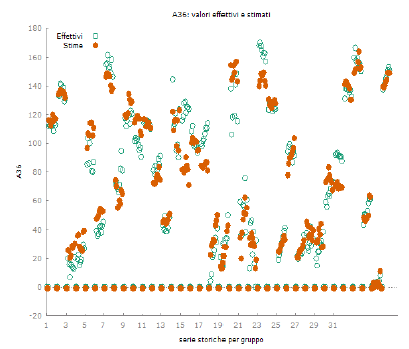
Clusterization
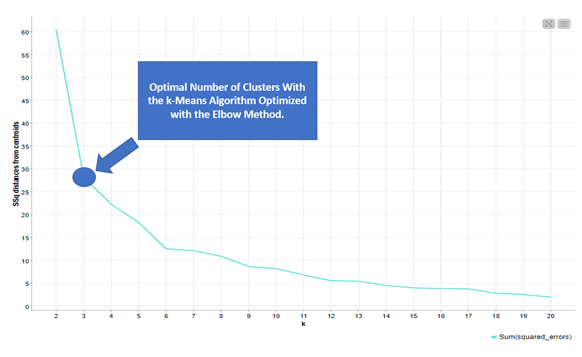
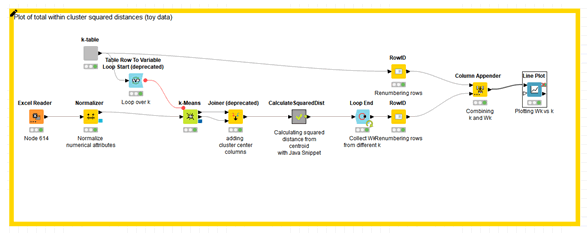
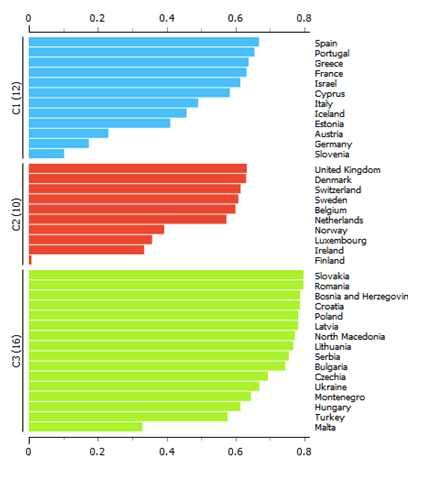
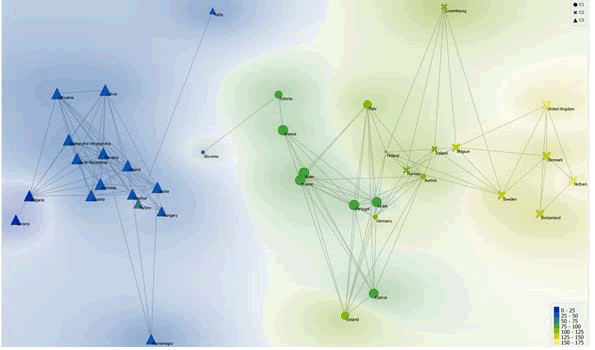
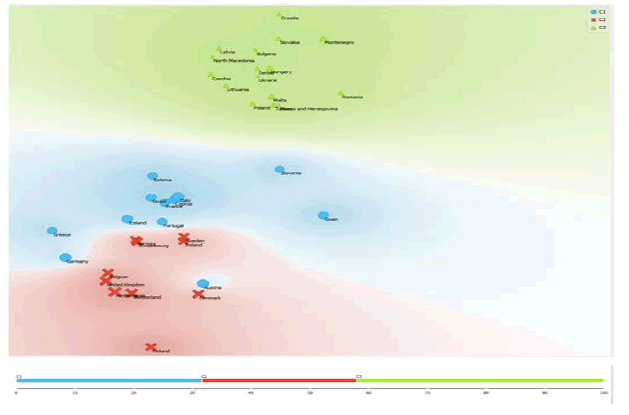
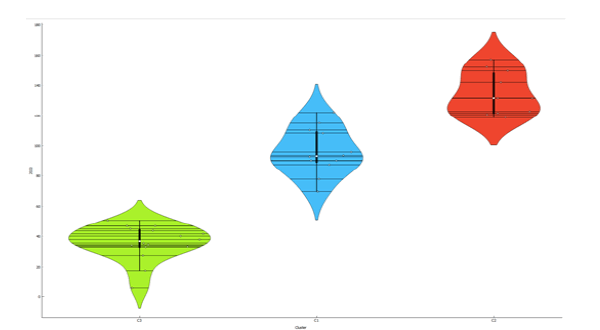
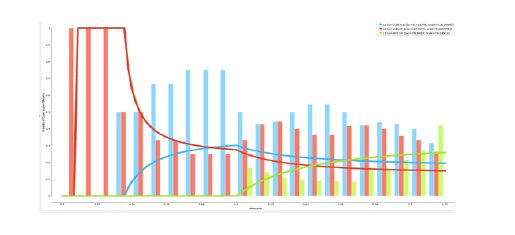
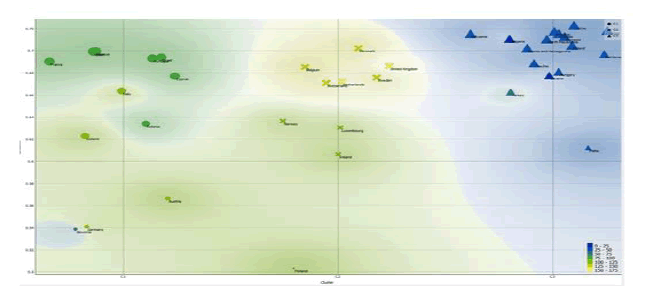
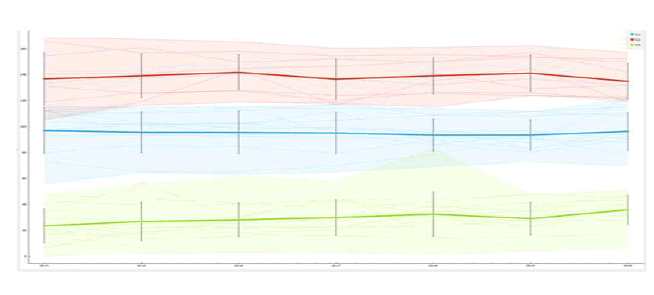
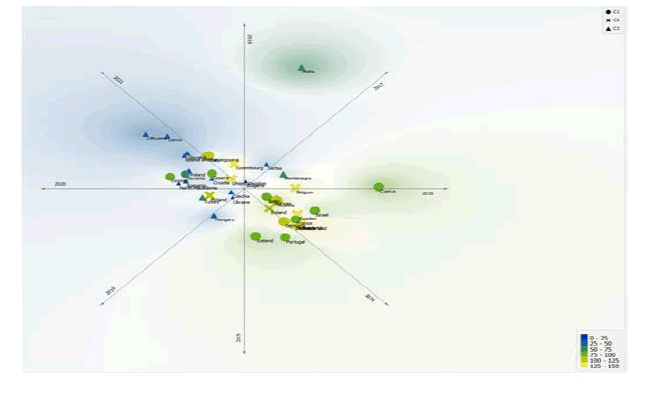
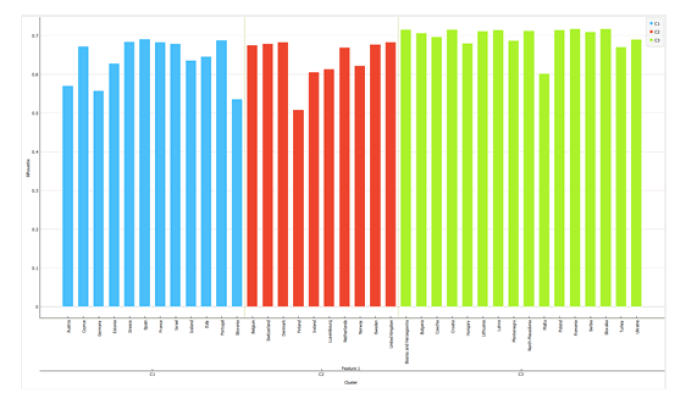
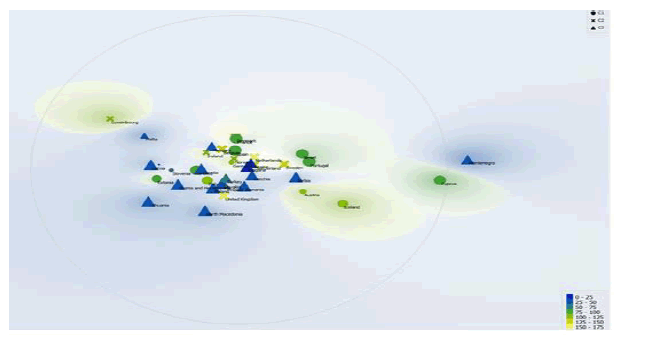
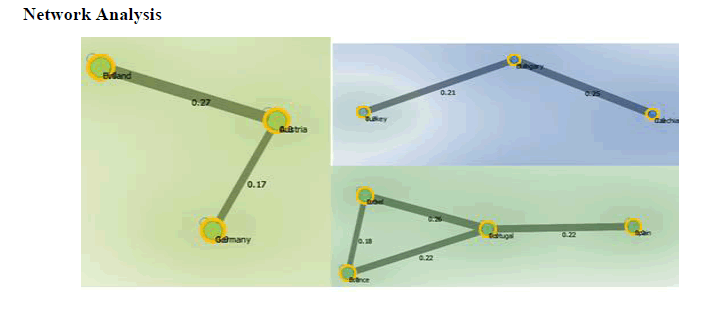
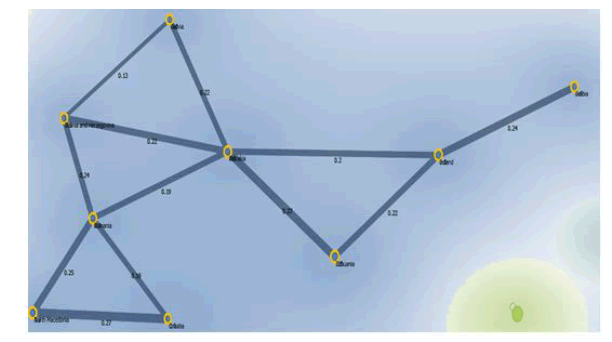
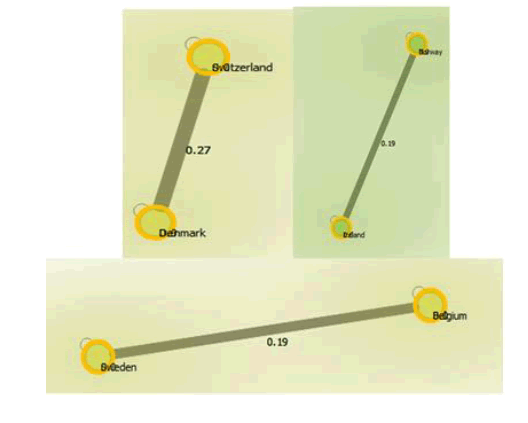
Prediction with Machine Learning with Original Data
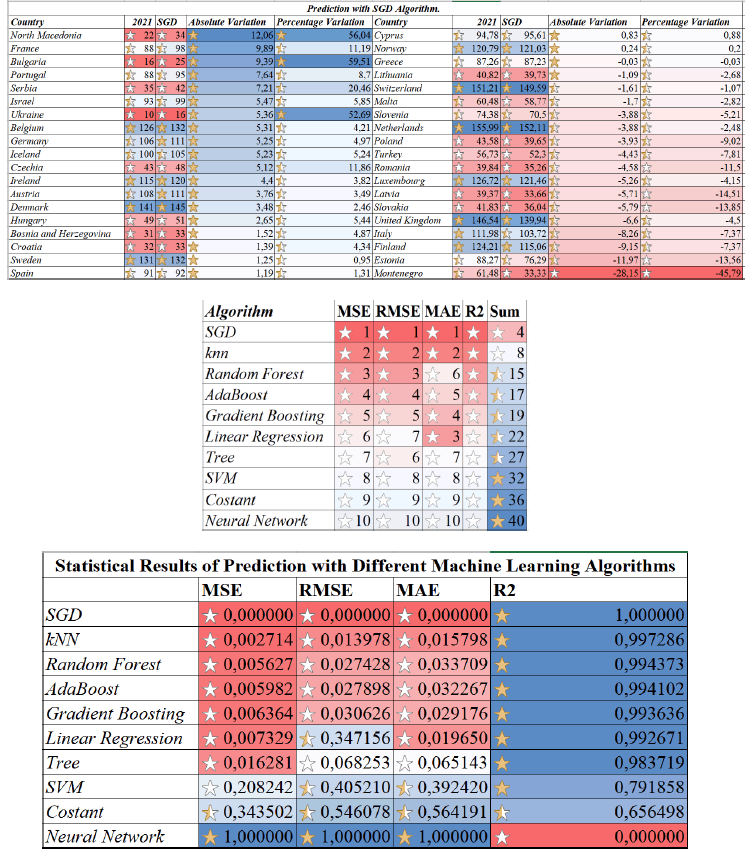
Prediction with Machine Learning with Augmented Data-AD
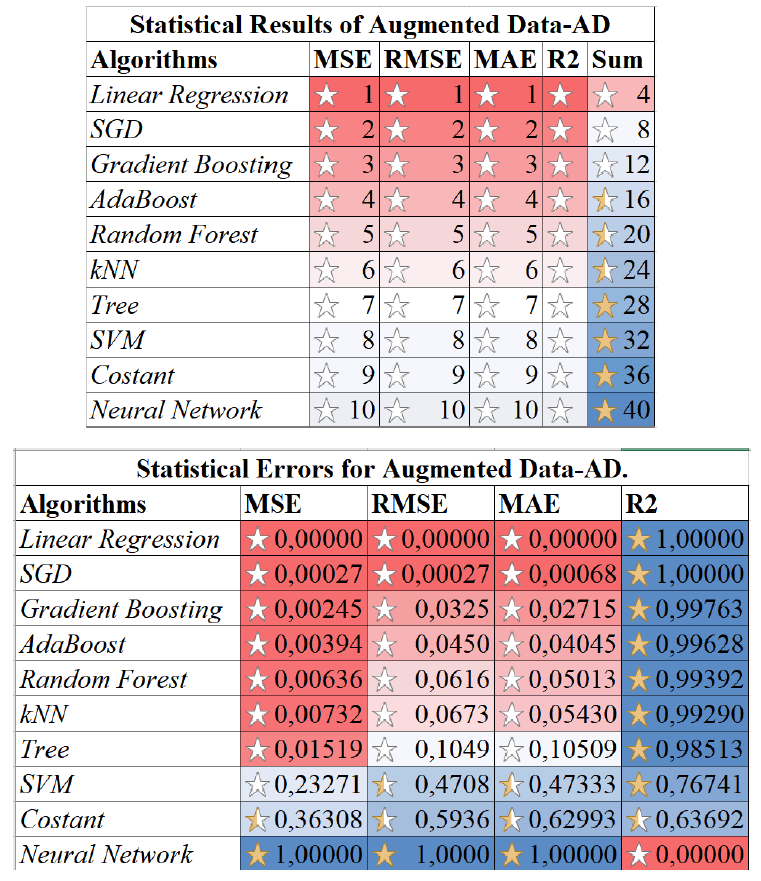
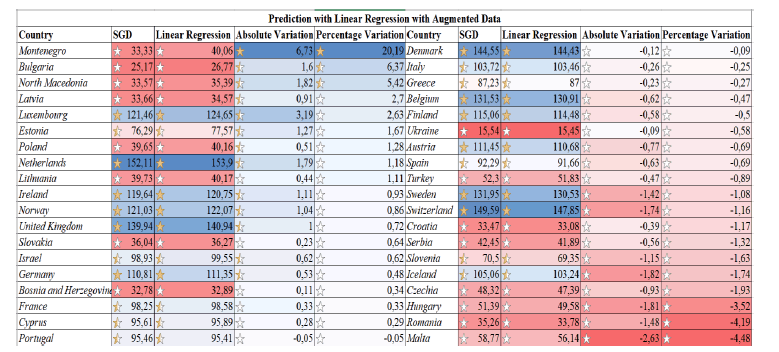
Received: 03-Jan-2023, Manuscript No. IJE-23-13167; Editor assigned: 04-Jan-2023, PreQC No. IJE-23-13167(PQ); Reviewed: 18-Jan-2023, QC No. IJE-23-13167; Revised: 23-Jan-2023, Manuscript No. IJE-23-13167(R); Published: 30-Jan-2023