Case Studies: 2025 Vol: 31 Issue: 2S
Pricing ESG into firm´s Value: Exotic Beverages Under Investors Scrutiny
Pedro Garibi, EADA Business School
Jordi Carenys, EADA Business School
Jaume Bonet, EADA Business School
Citation Information: Garibi, P., Carenys, J., Bonet , J. (2025). Pricing ESG into firm´s value: Exotic beverages under investors scrutiny. Journal of the International Academy for Case Studies, 31(S2), 1-24.
Abstract
Keywords
Corporate Finance, Valuation, Sustainability, ESG.
Introduction
On December 15, 2023, Jorge Gonzalez and Sandra Baily were working on an equity research report on Exotic Beverages Inc., a publicly traded company listed on the London Stock Exchange under the ticker symbol EXO. Having followed the company for the past few years, they were well-acquainted with its financial performance and management team. The report was set to be presented the following week at the year-end meeting of the Investment Committee of Golden Capital & Asset Management (GCAM), where Exotic Beverages´ performance would be assessed. Exotic Beverages Inc. had been in KPC´s portfolio for the past six years. While Exotic Beverages had rewarded its shareholders through dividends, its stock price had remained depressed in recent years (Exhibit 1) (Table 1 & Table 2).
| Table 1 Share´S Price and Per Evolution | ||||
| Date | Share Price (1) |
Dividend per share (2) |
Total (1) + (2) |
Annual Return |
| 01-01-2018 | 18.7 | - | 18.7 | - |
| 31-12-2018 | 19.8 | 0.65 | 20.45 | 9.40% |
| 31-12-2019 | 19 | 0.77 | 19.77 | -3.30% |
| 31-12-2020 | 18.7 | 0.8 | 19.5 | -1.30% |
| 31-12-2021 | 22 | 0.74 | 22.74 | 16.60% |
| 31-12-2022 | 16.5 | 0.85 | 17.35 | -23.70% |
| 15-12-2023 | 16 | 0.78 | 16.78 | -3.30% |
| Table 2 Evolution of Exotic Beverages Inc. Trading Per | |
| Year | PER |
| 2018 | 19.8 |
| 2019 | 16.1 |
| 2020 | 15.1 |
| 2021 | 12.4 |
| 2022 | 15.1 |
| 2023 | 14.5 |
The evolution of Exotic Beverages Inc. trading PER is shown below.
GCAM is an investment firm renowned for its value-oriented approach. Headquartered in Madrid, GCAM specialized in identifying and investing in companies traded at significant discounts to their intrinsic value, thereby providing attractive opportunities for long-term capital appreciation. GCAM focused primarily on mid-cap securities with limited analyst coverage but promising financial prospects. The firm also seeks opportunities to invest in companies undergoing restructuring processes, viewing such situations as avenues for value creation (Derrien et al., 2022). These scenarios often present opportunities for GCAM to engage directly with the target companies' Boards of Directors and Executive Committees, enhancing their influence over strategic decisions.
In recent years, GCAM has adapted its investment strategy to incorporate Environmental, Social, and Governance (ESG) factors into its decision-making process (see Appendix 1). This shift aligned with growing demands from both institutional and retail clients, who increasingly prioritize sustainability and ethical considerations in their investment decisions (Cornell et al., 2020).
Exotic Beverages Background
In 1995, Mr. and Ms. Garma acquired a modest beverage company in East Asia, renaming it Exotic Beverages Inc. In its origin, Exotic Beverages Inc. was focused on producing fruit juices and soft drinks for local East Asian markets. However, as entrepreneurs with roots in Spain, the Garma family leveraged their connections with Latin America and began expanding its operations into new regions, starting with South Asia and Latin America. In 1999, to support this ambitious vision, the owners relocated the corporate headquarters to Madrid, establishing a strong base for international operations.
By 2005, Exotic Beverages Inc. had transitioned from a regional player into a globally recognized brand. The company’s expansion strategy included setting up manufacturing facilities across East Asia, Latin America, and Eastern Europe, significantly increasing its production capacity. By 2015, Exotic Beverages Inc. had achieved remarkable success, generating revenues nearing €40,000 million, having more than 10,000 thousand employees worldwide, and serving more than 25 countries.
The rapid growth of Exotic Beverages Inc. led its owners to take a decisive step in 2015 by floating the company on the London Stock Exchange. This transition marked a significant milestone in the company's evolution, providing it access to additional capital and a broader investor base. To ensure its success in a competitive global market, the Garma family brought a professional management team to oversee day-to-day operations while maintaining their involvement as members of the Board of Directors.
Initially, the company grew organically, relying on its strong operating cash flow to fund investments while maintaining a conservative financial structure with low leverage. Exotic Beverages Inc. has also consistently upheld a high-dividend payout policy, reflecting its commitment to shareholder returns. These strategic choices and the company's strong operating margins contributed to its financial stability and attractiveness to investors.
Between 2014 and 2016, Exotic Beverages Inc. further developed its ambitious expansion strategy by acquiring several Eastern Asian businesses. Although these acquisitions offered significant opportunities for market penetration and increased revenue, they also introduced unforeseen challenges. The newly acquired operations encountered various operational inefficiencies and reputational issues, which began to weigh on the company’s overall performance.
Despite these difficulties, by 2017, Exotic Beverages Inc. was experiencing robust growth in Latin America and Western Europe and was preparing to expand into the North American and Canadian markets. This strategic move was critical in the company's internationalization, positioning it to compete in some of the world’s largest and most competitive beverage markets. Unfortunately, this period of promise was eclipsed by a series of adverse events at two of the company’s manufacturing plants in Eastern Asia. These events severely disrupted operations and jeopardized the company’s expansion plans. In 2018, a catastrophic flood severely damaged one of Exotic Beverages Inc.'s key manufacturing facilities responsible for producing and bottling its flagship product, a popular pineapple juice drink. The destruction of this plant disrupted the supply chain and threatened the availability of the company’s best-selling product, delivering a significant blow to its operational and financial stability. Moreover, in 2019, in a separate incident at another manufacturing plant, a serious workplace accident resulted in severe injuries to two employees. This prompted an immediate labor inspection by local authorities, intensifying scrutiny of the company’s workplace safety protocols and compliance standards. The labor inspection triggered by the workplace accident uncovered serious violations, including the employment of children under 14, the lack of proper work contracts in some cases, and the payment of wages below the local minimum standard. These findings exposed significant compliance failures, raising questions about the company’s ethical and legal practices. Following these incidents, the company experienced a notable increase in downtime across its global operations, exacerbated by unforeseen strikes at various manufacturing plants in multiple countries.
The timing of these events was particularly critical since Exotic Beverages Inc. was gearing up to establish itself in North America. In this market, consumer perception and brand image are crucial. The operational delays, labor disputes, and compliance issues affected production and posed risks to the company's reputation. The repercussions of this crisis were severe on multiple fronts. Operationally, production schedules were disrupted, and employee morale declined, further straining the company's efficiency. Financially, the company faced penalties, legal fees, and increased costs associated with rectifying compliance issues and addressing strike demands. Perhaps most damaging, however, was the reputational fallout. The labor violations and workplace safety issues received extensive media coverage, dominating television, and the press headlines.
As a result, Exotic Beverages Inc.’s stock price plummeted sharply in 2017, even though the company managed to maintain reasonable financial performance amidst the crisis (Exhibit 2) (Table 3).
| Table 3 Exotic Beverages Inc. Financial Statements | |||
| Profits and Losses (€ millions) | 2021 | 2022 | 2023 |
| Revenue | 47,488 | 47,756 | 49,009 |
| Cost of Goods Sold | 23,642 | 23,653 | 24,435 |
| Gross Profit | 23,846 | 24,103 | 24,574 |
| Operating Expenses | 2,847 | 2,838 | 2,999 |
| SG&A | 6,140 | 10,533 | 10,604 |
| Research & Development | 951 | 875 | 837 |
| EBITDA | 13,908 | 9,857 | 10,134 |
| Depreciation | 2,107 | 1,858 | 1,970 |
| EBIT | 11,802 | 7,998 | 8,164 |
| Interest | 265 | 398 | 400 |
| EBT | 11,537 | 7,600 | 7,764 |
| Taxes | 2,893 | 2,217 | 1,845 |
| Net Income | 8,644 | 5,383 | 5,919 |
| Balance Sheet (€ millions) | 2021 | 2022 | 2023 |
| Cash | 6,580 | 4,046 | 2,018 |
| Accounts Receivable | 6,352 | 6,561 | 4,840 |
| Inventory | 4,215 | 4,081 | 4,373 |
| Other Current Assets | 1,332 | 1,260 | 1,098 |
| Total Current Assets | 18,479 | 15,948 | 12,329 |
| Goodwill | 16,517 | 16,660 | 17,641 |
| Intangible Assets | 12,936 | 13,289 | 15,468 |
| Property Plant & Equipment | 14,805 | 15,984 | 17,023 |
| Other Non-Current Assets | 5,460 | 8,295 | 9,240 |
| Total Non-Current Assets | 49,718 | 54,228 | 59,372 |
| Total Assets | 68,197 | 70,176 | 71,701 |
| 2021 | 2022 | 2023 | |
| Accounts Payable | 14,168 | 14,473 | 13,849 |
| Other Current Liabilities | 4,354 | 5,405 | 6,119 |
| Total Current Liabilities | 18,522 | 19,878 | 19,968 |
| Long-Term Debt | 11,000 | 11,000 | 11,000 |
| Other Non-Current Liabilities | 9,016 | 8,816 | 8,481 |
| Total Liabilities | 38,538 | 39,694 | 39,449 |
| Shareholder's Equity | |||
| Paid in Capital | 12,800 | 12,800 | 12,800 |
| Retained Earnings | 16,859 | 17,682 | 19,452 |
| Total Shareholders' Equity | 29,659 | 30,482 | 32,252 |
| Total Liabilities & Shareholders' Equity | 68,197 | 70,176 | 71,701 |
| Cash Flow Statement (€ millions) | 2021 | 2022 | 2023 |
| Net Income | 8,644 | 5,383 | 5,919 |
| Depreciation | 2,107 | 1,858 | 1,970 |
| Changes in Working Capital | 230 | 230 | 805 |
| Other Adjustments | 123 | -248 | -203 |
| Cash from Operating Activities | 11,103 | 7,224 | 8,492 |
| Investing Activities | |||
| Capital Expenditure | -2,850 | -2,850 | -2,850 |
| Other Investing Activities | 579 | 110 | 275 |
| Cash from Investing Activities | -2,271 | -2,740 | -2,575 |
| Financing Activities | – | – | – |
| Increase in Long-Term Debt | – | – | – |
| Issuance of Common Stock | – | – | – |
| Dividends | -3,950 | -4,560 | -4,150 |
| Other Financing Activities | -1,352 | -2,458 | -3,795 |
| Cash from Financing Activities | -5,302 | -7,018 | -7,945 |
| Cash Balance | – | – | – |
| Beginning | 3,050 | 6,580 | 4,046 |
| Change in Cash | 3,530 | -2,534 | -2,028 |
| Ending | 6,580 | 4,046 | 2,018 |
A New CEO
The founders and the board of directors of Exotic Beverages Inc. were concerned about the company's challenges and took steps to steer it toward recovery and long-term success. The company appointed a new operations manager for East Asia to address regional operational inefficiencies and bring fresh leadership to tackle ongoing issues. Additionally, they hired a new CEO, Ms. Mariela Vargas, a highly experienced Mexican professional with over 15 years of expertise in marketing and retail across Latin America.
Ms. Vargas quickly took charge, initiating the development of a comprehensive five-year strategic plan to revitalize the company. Her plan focused on driving growth, enhancing financial performance, increasing shareholder value, and fostering a culture of corporate ethics, integrity, and managerial excellence. Exotic Beverages´ Board of Directors expected that under her leadership, the company could rebuild its reputation, strengthen its operations, and align with modern governance standards to position itself as a responsible and competitive player in the global beverage market (Li et al., 2018).
Strategic Plan
In November 2023, Mariela met with Sandra and Jorge to present her strategic plan. During this presentation, Mariela identified the steps needed to transform Exotic Beverages Inc. into a more efficient and socially responsible organization (Badia et al., 2020). Believing that ESG actions could be a powerful driver for change, Mariela outlined a strategic plan to address immediate operational challenges and broader reputational concerns. In this line, the new CEO identified several key initiatives:
• The company set an ambitious target of achieving net-zero carbon emissions within eight years. This effort should focus on reducing energy consumption at manufacturing plants and the corporate headquarters by adopting new technologies and energy-efficient practices.
• To increase productivity, Exotic Beverages Inc. was considering implementing measures to minimize unplanned downtime by investing in improved safety protocols to reduce workplace accidents and strikes.
• Improve hiring policies, including offering better salary benefits and training programs and ensuring equal opportunities for all employees. These steps aimed to create a motivated and skilled workforce, driving higher levels of engagement and performance.
• Significant investments were to be made to improve water and waste management at manufacturing plants. The goal was to achieve world-class standards, ensuring the company minimized its environmental impact while maintaining operational excellence.
• As the company strengthens its ethical and environmental credentials, Mariela anticipated higher worldwide revenues driven by increased consumer trust and loyalty. She saw improved brand positioning a key driver for achieving growth and securing a competitive position in the international beverage market.
• Mariela believed ESG initiatives could benefit Exotic Beverages Inc. by strengthening creditworthiness, improving debt rating, reducing debt costs, and boosting investor confidence, ultimately reducing the company's weighted average cost of capital (Exhibit 3) (Table 4).
| Table 4 Weighted Average Cost of Capital | |
| Parameters | Magnitudes |
| Risk-Free Rate (10-year German Eurobond Rate) | 3.00% |
| Risk Free Rate (3-month US Treasury Bill) | 2.80% |
| Risk Free Rate (5-year Spanish Eurobond Rate) | 3.60% |
| Market Risk Premium (based on weighted average of operating profits and revenues) | 5.50% |
| Market Risk Premium (US Market) | 4.50% |
| Beta Unlevered (Global Soft Drink Sector) | 0.93 |
| Beta Levered (US Soft Drink & Beer Sector) | 1.35 |
| Marginal Tax Rate (= Effective Tax Rate) | 24% |
| Exotic Beverages Default Spread | 100 basis points |
| Terminal Growth Rate | 2% |
• The company planned to maintain a 24% effective tax rate by achieving net-zero emissions and adopting energy-efficient practices, leveraging tax incentives for sustainability. Failure to meet these benchmarks could raise the tax rate to 28%.
Calculate the cost or equity for the ESG initiatives scenario using CAPM.
For simplicity, to calculate the cost of equity of the status quo scenario, add an additional 1.4% to the cost of equity of the ESG scenario.
During the meeting, Mariela recognized that implementing the new strategic plan was challenging, demanding significant human and financial resources. At the end of the meeting, Mariela presented to Jorge and Sandra the projected financial implications under the status quo scenario, where no ESG initiatives were implemented (Exhibit 4) (Table 5) and the financial impact of adopting Mariela's ESG plans (Exhibit 5). After she finished her presentation, an awkward silence filled the room. Mariela tried to break the ice and open space for debate:
| Table 5 Status Quo Projections Hypotheses | |||||||||
| 2023 | 2024F | 2025F | 2026F | 2027F | 2028F | 2029F | 2030F | Terminal | |
| Unplanned downtime (days) | 13 | 15 | 15 | 15 | 15 | 15 | 15 | 15 | 15 |
| Revenues % growth rate | 1.00% | 1.00% | 1.50% | 1.50% | 1.80% | 1.80% | 2.00% | 2.00% | |
| Costs as % of Sales Gross Margin | 50.10% | 50.20% | 50.30% | 50.40% | 50.50% | 50.60% | 50.70% | 50.80% | |
| Distribution Expenses | 6.00% | 6.00% | 6.00% | 6.00% | 6.00% | 6.00% | 6.00% | 6.00% | |
| Marketing & Administration | 18.00% | 18.00% | 18.00% | 18.00% | 18.00% | 18.00% | 18.00% | 18.00% | |
| Research & Development | 1.60% | 1.60% | 1.60% | 1.60% | 1.60% | 1.60% | 1.60% | 1.60% | |
| Depreciation | 4.00% | 4.00% | 4.00% | 4.00% | 4.00% | 4.00% | 4.00% | 4.00% | |
| Cost of Financial Debt Interest rate | 4.00% | 4.00% | 4.00% | 4.00% | 4.00% | 4.00% | 4.00% | 4.00% | |
| CapEx Investment in PP&E | 2,800 | 2,800 | 2,800 | 2,800 | 2,800 | 2,800 | 2,800 | 2,800 | |
| Working Capital as a % on sales | -8.73% | -8.69% | -8.39% | -8.35% | -8.05% | -8.01% | -7.71% | -7.68% | |
| Tax Rate % effective tax rate | 28% | 28% | 28% | 28% | 28% | 28% | 28% | 28% | |
Mariela: I'm excited to share our new ESG-focused strategic plan with you both. We believe these initiatives will not only improve our operational efficiency but also rebuild our reputation and drive long-term value (Quintiliani, 2022).
Jorge: Ms. Vargas, while I appreciate your enthusiasm, I have concerns. The company has faced significant challenges, and these ESG initiatives will require substantial investment. How can we be sure they'll deliver the promised returns?
Sandra: Well, I see potential in this plan. The focus on sustainability and ethical practices could regain consumer trust and potentially open new market opportunities. What do you think about the projected financial impact, Ms. Vargas?"
Mariela: Excellent point, Sandra. Our projections show that while there will be initial costs, the long-term benefits are substantial. We expect improved operational efficiency, reduced downtime, and potentially lower capital costs due to improved ESG ratings.
Jorge: But what about the immediate financial impact? Our shareholders have already seen significant value erosion. How do we justify spending more when the stock price stock price is already depressed?
Mariela: I understand your concern, Jorge. However, we believe that without these changes, we risk further decline. These initiatives are an investment in our future competitiveness and sustainability.
Sandra Baily: I can see both perspectives. Perhaps we need to look closely at how these ESG initiatives might affect firm´s valuation in both the short and long term.
Mariela: I trust your analysis will reveal immense potential here. The future of Exotic Beverages depends on it.
Jorge: All right, let's dive into the numbers and see what they tell us.
With the weight of the decisions to be made, Jorge and Sandra left the meeting with their attention focused on the task of analyzing Exotic Beverages' financial prospects under both the status quo and the ESG-driven scenarios.
The Decision
Jorge and Sandra were about to start their valuation of Exotic Beverages using the discounted cash flow method. They knew that for six years, the company had been part of GCAM´s portfolio, consistently remunerating shareholders through dividends. However, Exotic Beverages’ share price experienced a significant decline of nearly 25%, dropping from a peak of €20 in October 2018 to its current level of €16, a decrease that began before the plant accidents and subsequent labor inspection.
As Jorge and Sandra began their valuation process, they disagreed about the potential impact of the ESG initiatives (Glavas, 2023).
Jorge: Sandra, I've run the numbers based on the status quo projections, and I'm not optimistic. The company's performance has been disappointing, and I'm not convinced these ESG initiatives will turn things around quickly enough.
Sandra: I see where you're coming from, Jorge, but I think we need to consider the potential upside of the ESG strategy. Have you looked at the projections that include the ESG initiatives?
Jorge: I have, but I'm skeptical. These projections seem overly optimistic given the company's recent history. We're talking about significant upfront costs with benefits that may or may not materialize.
Sandra: True, but consider the changing market dynamics. Consumers and investors are increasingly valuing companies with strong ESG credentials. This could be a pivotal moment for Exotic Beverages to reposition itself (Cornell et al., 2021).
Jorge: I'm not denying the importance of ESG, but my concern is timing. GCAM has already held this stock for six years with diminishing returns. How much longer should we wait?
Sandra: I understand your point. But what if selling now means missing out on potential value creation? Let's run both scenarios through our valuation model and see what the numbers tell us. We need to be thorough in our analysis before making a recommendation to GCAM.
Jorge: Agreed. We'll need to carefully weigh the risks and potential rewards. Let's get to work on those valuations and see where they lead us.
On December 15, 2023, the market capitalization of 8 of Exotic Beverages was 88.000 million euros. There was no significant difference between the book value of the company's debt and its market value. The stock return has shown high volatility (standard deviation 12,5%) for the past six years, and the holding period return reports a negative 10,3% (16.78/18.70) – 1). Outstanding shares: 5.500.
For simplicity, to calculate the cost of equity of the status quo scenario, add an additional 1.4% to the cost of equity of the ESG scenario.
Appendix 1
Environmental, Social, and Governance (ESG) refers to a framework used to evaluate a company's sustainability and ethical impact, it helps investors, stakeholders, and businesses assess how a company manages risks and opportunities related to environmental, social, and governance factors.
Environmental (E): Managing Environmental Impact
It considers a company's impact on the environment and how it manages sustainability issues such as carbon footprint and greenhouse gas emissions, energy efficiency and renewable energy use, waste management and pollution control, biodiversity & deforestation, water usage and conservation and climate change risks and adaptation. This factor focuses on how a company interacts with the environment and addresses sustainability challenges. Example: a company adopting solar energy to lower its carbon footprint demonstrates strong environmental responsibility.
Social (S): Managing Stakeholder Relations
The social aspect examines how a company manages relationships with employees, customers, communities, and other stakeholders. Issues such as employee diversity, equity & inclusion (DEI), and labor rights, workplace safety, health policies and labor practices, human rights and supply chain ethics, customer satisfaction and data privacy, community engagement and philanthropy and supply chain ethics and human rights. This factor evaluates how a company manages relationships with employees, customers, communities, and supply chains. Example: A company with strong diversity policies and a fair labor supply chain enhances its social impact.
Governance (G): Ensuring Ethical Leadership & Compliance
Governance refers to a company's internal systems, leadership, and ethical business practices. It covers board diversity and structure, executive compensation and incentives, transparency and accountability, anti-corruption policies, shareholder rights and engagement, and corporate ethics. Governance factors assess corporate leadership, ethical business practices, and shareholder rights. Example: A company with an independent, diverse board and strong anti-corruption policies fosters trust and accountability.
ESG investing encompasses a range of strategies that reflect varying degrees of emphasis on environmental, social, and governance considerations within the investment process. One common approach is ESG integration, which involves incorporating ESG factors into traditional financial analysis to better assess potential risks and identify long-term opportunities (Giese et al., 2019). In contrast, Socially Responsible Investing (SRI) applies negative screening to exclude companies involved in controversial industries such as tobacco, firearms, or fossil fuels, aligning investments with specific ethical or moral values. Impact investing goes a step further by targeting investments in companies or projects that generate measurable positive social or environmental outcomes, in addition to financial returns. Another approach is thematic ESG investing, where capital is allocated to specific themes like clean energy, gender equality, or sustainable agriculture, often tied to global development goals. Lastly, shareholder activism allows investors to directly influence corporate behavior by engaging with company leadership or voting on shareholder resolutions to drive ESG improvements. Together, these strategies illustrate the diverse ways in which ESG considerations can be embedded in investment decisions, depending on the investor's goals, values, and desired level of engagement.
Getting started with ESG investing typically involves a series of steps aimed at incorporating environmental, social, and governance considerations into the investment process. One approach is to consult ESG ratings and reports from sources such as MSCI ESG Ratings, Sustainalytics, or Morningstar, which provide assessments of companies based on a range of sustainability indicators. Another option is to invest through ESG mutual funds and ETFs, which apply defined ESG criteria in their portfolio construction. Reviewing corporate ESG policies, including sustainability disclosures and governance practices, can offer further insight into how companies address ESG-related risks and opportunities. Additionally, ESG robo-advisors may be considered for those interested in automated investment solutions that integrate ESG factors into portfolio selection.
Teaching Note
Case Description
The primary subject matter of this case concerns corporate finance with a focus on valuation and ESG (Environmental, Social, and Governance) integration. Secondary issues examined include sustainability strategy and strategic turnaround. The case effectively illustrates how to build forecasts for revenues, costs, and capital investments. Unlike many DCF cases, which tend to be overly mechanical, this one helps students develop a real-world understanding of how such projections are actually constructed. The case has a difficulty level between four and five, appropriate for final-year undergraduates or first- year graduate level (e.g. MBA). It is designed to be taught in a ninety-minute class and is expected to require between two and three hours of outside preparation by students. Students should have been previously exposed to discounted cash flow analysis, basic principles of company valuation and CAPM. To support case analysis, it is strongly advised that instructors provide students with the templates and case exhibits in a spreadsheet, available upon request from the authors.
Case Synopsis
Sandra Baily and Jorge Gonzalez, financial analysts at Golden Capital & Asset Management (GCAM), are tasked with preparing a recommendation for the investment Committee of GCAM regarding whether to retain or divest GCAM stake in Exotic Beverages Inc. Exotic Beverages is a globally recognized company that has faced operational, financial, and reputational difficulties in recent years. As a result, Exotic Beverages Inc.’s share price has plummeted by nearly 25% over the last few years. Assuming Jorge and Sandra´s role, students must explore two scenarios: the first assumes a continuity of the company´s current strategy, while the second explores a strategic turnaround by integrating Environmental, Social, and Governance (ESG) principles into its business strategy. For both scenarios, students are required to evaluate its potential risks and opportunities, compare its financial implications, and perform a valuation analysis of Exotic Beverages Inc. using the discounted cash flow method. To conduct the valuation process, students should quantify the impact of different ESG initiatives on Exotic Beverages Inc.´s future free cash flows and weighted average cost of capital. The case provides the opportunity to discuss the role of ESG initiatives in driving a firm´s long-term value, presenting students with the challenge of balancing financial constraints with the company´s societal impact, ethical standards, and sustainability commitments.
Potential Audience
This case can be used in an undergraduate or graduate corporate finance course to illustrate how ESG initiatives can be integrated into the DCF valuation method. It is also well-suited for students pursuing studies or modules in sustainability or sustainable business. Additionally, sustainability and ESG professionals looking to understand the intersection between ESG and a firm´s value can benefit from this case.
Supplementary Materials
Students and instructor spreadsheets supporting case preparation and discussion are available upon request from the corresponding author. The instructor spreadsheet includes all Case Exhibits and those from this teaching note. The student spreadsheet contains the Case Exhibits and a structured template for conducting the DCF analysis.
Expected Learning Outcomes
This teaching case is designed to achieve the following objectives:
• Analyze the financial implications of ESG initiatives and their impact on revenues, costs, taxes, capital expenditures, and the weighted average cost of capital.
• Assess enterprise and equity value in two scenarios using the discounted cash flow method: one incorporating ESG initiatives and one without.
• Conduct a sensitivity analysis of the company's valuation across different assumptions.
• Moreover, acting as financial analysts, students must determine whether to advise selling or retaining GCAM's stake in Exotic Beverages Inc. The case equips students with sufficient data to support their recommendation.
Suggested Assignment Questions
The following questions can be assigned to help students prepare for the class discussion on the case.
As part of the GCAM team, your task is to estimate the value of Exotic Beverages Inc. using a discounted cash flow approach. Draft a memo for the GCAM Investment Committee outlining the company's valuation in two scenarios: status quo and ESG. The memo should clearly state Exotic Beverages' per-share value and justify your recommendation to sell or hold Exotic Beverages´ shares. To prepare this report, the following questions may be helpful.
1. How do ESG initiatives impact the company’s financial projections? (Hint: compare Case Exhibits 4 and 5 and identify the main differences between the two scenarios).
2. Use the assumptions from Exhibits 4 and 5 to forecast revenues and costs for both scenarios. Produce, for each scenario, projected income statements showing the EBIT for the years 2024 through 2030. Also include the EBIT for the terminal period.
3. Construct the free cash flow projections for Exotic Beverages over the next seven years (2024–2030) and include a terminal value in your valuation using the terminal data provided in Case Exhibits 4 and 5. Assume a long-term cash flow growth rate of 2,00% in both scenarios. In the ESG scenario, apply a weighted average cost of capital (WACC) of 7,94%: in the status quo scenario, use a WACC of 9,21% 1. What is the per-share value of Exotic Beverages under each scenario?
4. How sensitive is your valuation (value per share) to changes in WACC and terminal growth rates? For the WACC, assume a range of WACC +/- 0.5%, and for the terminal value growth rate, 2% +/-0.3%.
5. What is your investment recommendation based on the share´s valuation versus the share´s current price?
Teaching Plan
Prior to the session, students should read the case and the assignment questions. To streamline the valuation process, it is strongly encouraged that instructors provide the students in advance with the Case Exhibits spreadsheets that also include the templates to produce the DCF valuations. A suggested teaching plan for a 90-minute session could be constructed as follows:
1) What is the background of Exotic Beverages? 5 minutes
2) Vote of students’ decision based on homework assignment questions. 5 minutes
3) What needs to be estimated when valuing a firm when using the DCF method? 15 minutes
4) Estimated projection of the free cash flows: forecasting revenues, costs, EBIT, taxes, changes in working capital, and capex; forecasting explicit free cash flows and terminal value. 30 minutes
5) Determine enterprise value and equity value. Calculate Exotic Beverages´ shares intrinsic value in both scenarios 20 minutes
6) Sensitivity analysis of both scenarios to changes in terminal growth rate and WACC. 10 minutes
7) Summarize lessons learned 5 minutes
1) Exotic Beverages backgrounds (5 minutes)
Most students will appreciate starting the session by clarifying the facts of the case so that the bigger picture issues can be identified. The instructor might open the session with ice-breaking questions such as: What is Exotic Beverages´ background? What went wrong at Exotic Beverages? What challenges is the company facing?
2) Students’ initial decision based on homework assignment questions (5 minutes)
Next, the instructor may ask students: Based on your analysis, would you recommend a sale or a hold decision to the KPC Investments Committee? The instructor can then ask students to vote on their position. It is not advisable to delve into a detailed analysis at this stage, as this will be explored in the subsequent sections of this teaching note. Instead, two or three students with contrasting views can be called upon to explain their rationale briefly. This exercise allows the instructor to gauge the class's overall sentiment while encouraging students to take a position. However, it is necessary to acknowledge that their decision at this point may not be fully informed and that every choice carries its advantages and disadvantages.
3) What needs to be estimated when valuing a firm when using the DCF method (15 minutes)
The section provides the conceptual framework for the case analysis. To open it, the instructor may ask What are the most critical assumptions in a DCF valuation? and What needs to be estimated when valuing a firm when using the DCF method? The instructor may organize students’ responses on the whiteboard around four key axes: 1. Free cash flow estimates for the explicitly forecast period (Narula et al., 2023). 2. Explicit forecast horizon, the length of the projection period, typically 5–10 years, or until free cash flows stabilize. 3. Terminal value, an assessment of the business’s performance beyond the explicit forecast period. 4. Discount rate, usually the weighted average cost of capital.
Before proceeding, the instructor can display the following enterprise valuation formula on the screen and ask students to connect the meaning of each component in the formula with their previous responses.

Where:
• EV0 = Value of the firm today; FCF1, FCF2, FCF3,.., FCFn = Free cash flows for years 1, 2, 3, ..., and n; WACC = weighted average cost of capital as the discount rate; TVn = Terminal value at year n.
It is important that the instructor emphasizes that the formula consists of two components: (1) explicit forecasts: the free cash flows over a defined forecast period (years 1 to n) and, (2) terminal value that represents the firm's value beyond the forecast period, also discounted to present value.
Once this conceptual framework has been established, the instructor can ask students to elaborate on the previously identified components of the formula, facilitating a more in-depth discussion. The following questions can help guide this part of the discussion:
What are free cash flows? How should free cash flows be calculated? This should lead to the conclusion that free cash flows represent the cash generated by a business after covering all operating expenses and taxes, meeting operational working capital needs, and making the necessary capital expenditures to maintain or expand its operations. The instructor might consider that presenting the following formula would enhance students’ understanding.
FCF = EBIT *(1-t) + Amortization depreciation and other non cash items +(-) Changes in working capital +(-) Changes in capital expenditures
The instructor may highlight several vital points around free cash flow: (1) it is derived from a firm's EBIT and, therefore, it is not affected by a firm's capital structure; (2) it recognizes that some of the operating expenses, such as depreciation and amortization, are non-cash expenses and need to be added back; (3) it also accounts for changes in the balance sheet, explicitly working capital and capital expenditures.
Next, the instructor may pose the following questions to the students What is the WACC? Why is WACC important in valuing a company? What justifies its use as the discount rate in a discounted cash flow analysis? These questions are expected to guide students toward concluding that WACC reflects a company's average financing cost through equity and debt. It represents the minimum return a company must earn to satisfy its investors (both debt holders and equity holders). WACC is the discount rate in DCF valuation because it represents the minimum required return that both equity and debt investors expect to earn.
After this brief discussion on WACC, and depending on the option chosen in assignment question three, the instructor may take one of two possible approaches
In introductory courses, WACC is given in the assignment questions, which is assumed to be 9.21% in the status quo scenario and 7.94% in the ESG scenario. The instructor can ask: Why is the company´s WACC lower in the ESG scenario than in the status quo scenario? Do you buy this assumption? Students typically will propose different reasons for explaining this difference. The prevailing argument is likely to rest on the premise that firms with robust ESG policies are perceived as lower-risk investments. This perception can result in a reduced cost of debt, as lenders assign better credit ratings and offer more favorable financing terms to companies with strong ESG credentials. Additionally, the cost of equity may decrease as investors, particularly institutional and ESG-focused funds, may be willing to trade between long-term sustainability and risk mitigation and return. Furthermore, regulatory and compliance benefits play a role, as companies with proactive ESG strategies are less likely to face fines, legal challenges, or reputational damage, leading to more stable cash flows and a lower risk premium.
In more advanced courses, the instructor may ask the students to calculate the cost of equity using data from Exhibit number 3 and use it to calculate the cost of equity and the WACC. In this context, displaying the WACC formula shown below and asking a student to explain it may be convenient.
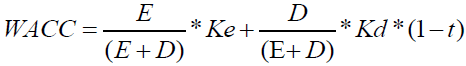
Where:
(E): Market value of equity; (D): Market value of debt; (Ke): Cost of equity. The return required by equity investors; (Kd): Cost of debt. The return required by debt investors, adjusted for tax savings because interest is tax-deductible; (t): Corporate tax rate.
It must be clear to students that WACC is derived from the firm's equity cost and the cost of the debt after taxes, weighted by the proportion of each financing source. The instructor may encourage students to share their calculations about the WACC using data provided in Case Exhibit 3. Calculation of the WACC in this context is shown in Exhibit TN 1.
Some students may have calculated WACC using the book values of equity and debt from the 2023 balance sheet. The instructor should stress that WACC should be calculated using market values of debt and equity because it reflects the current opportunity cost of capital—that is, the return that investors require today for providing capital to the company. Market values offer a more accurate reflection of the return investors require on equity, as indicated by current share prices, and ideally on debt, as reflected in current bond prices. At this point, the instructor should underline that using book values can significantly misrepresent the true weighted average cost of capital, especially if market conditions or the firm’s risk profile have changed since the debt or equity was issued. Therefore, to ensure that WACC accurately represents the firm's current financing costs, market values are preferred.
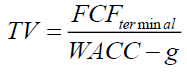
As a conclusion to this section, the instructor might pose the following question What is the terminal value? This question opens the way for concluding that the terminal value represents the estimated value of a business beyond the explicit forecast period. Since the company is expected to continue operating indefinitely, terminal value captures the free cash flows beyond 2030. In this case study, the terminal value is estimated through the perpetuity growth model, which is widely used in practice and provides a theoretically consistent approach with the DFC approach. Using a growing perpetuity, the instructor can show the following formula:
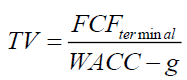
Where:
• TV = Terminal value at the end of the forecast period; FCF terminal = Free cash flow beyond the definite forecast period; WACC = Weighted average cost of capital; g = Perpetual growth rate of free cash flow.
4) Estimated projection of the free cash flow? (30 minutes)
This assignment represents the bulk of the case´s calculations. Case Exhibits 4 (status quo) and 5 (ESG) contain projections regarding the evolution of Exotic Beverages' financial metrics, which are necessary to forecast free cash flows. Exhibits TN 2 and 3 summarize the calculation required to produce the forecasted cash flow in both scenarios.
It is advisable to focus this section on preparing the projected cash flow for the ESG scenario, since the status quo scenario follows an identical procedure. Once the ESG scenario has been thoroughly constructed, the status quo scenario is straightforward. If this approach is followed, the process begins by forecasting revenues (see Exhibit TN 3) (Table 6a & Table 6b). The instructor may ask students what key drivers influence revenue growth in each scenario? The revenue forecast is based on the number of net operating days and revenue per day. Each year starts with 365 planned operating days, from which unplanned downtime days are subtracted to determine net operating days. Revenue per day grows annually at the specified rate. The total revenue for each year is then calculated by multiplying net operating days by the corresponding revenue per day. The total revenues in the ESG scenario include both recurrent and incremental revenues, as per Case Exhibit 5 (Table 7).
| Table 6a DCF Valuation ESG Scenario |
||||||||||
| 2023 | 2024 | 2025 | 2026 | 2027 | 2028 | 2029 | 2030 | Terminal | ||
| Revenues Forecast | ||||||||||
| Sales 2023 (1) | 49.009 | |||||||||
| Days per year | 365,00 | 365 | 365 | 365 | 365 | 365 | 365 | 365 | 365 | |
| Unplanned downtime days (2) | 13 | 12 | 11 | 15 | 15 | 15 | 15 | 15 | 15 | |
| Operating days | 352 | 353 | 354 | 355 | 356 | 357 | 358 | 359 | 359 | |
| Revenues per operating day (2023) | 1,39,230 | |||||||||
| Growth revenues per day (2) | 2,00% | 2,30% | 2,60% | 2,90% | 3,20% | 3,40% | 3,70% | 4,00% | ||
| Revenues per operating day (forecast) | 142 | 145 | 149 | 153 | 158 | 164 | 170 | 177 | ||
| Recurrent revenues | 50.131 | 51.429 | 52.916 | 54.604 | 56.509 | 58.594 | 60.932 | 63.369 | ||
| Incremental Revenues | 400 | 750 | 1.100 | 1.475 | 1.850 | 2.325 | 2.740 | 3.200 | ||
| Total revenues | 50.531 | 52.179 | 54.016 | 56.079 | 58.359 | 60.919 | 63.672 | 66.569 | ||
| Cost Forecast (2) | ||||||||||
| Gross Margin | 25.316 | 26.194 | 27.170 | 28.264 | 29.471 | 30.825 | 32.282 | 33.817 | ||
| Distribution Expenses | 3.032 | 3.131 | 3.241 | 3.365 | 3.502 | 3.655 | 3.820 | 3.994 | ||
| Marketing & Administration | 9.146 | 9.523 | 9.939 | 10.403 | 10.913 | 11.483 | 12.066 | 12.615 | ||
| Research & Development | 808 | 840 | 875 | 914 | 957 | 1.005 | 1.057 | 1.112 | ||
| Depreciation | 2.021 | 2.087 | 2.161 | 2.243 | 2.334 | 2.437 | 2.547 | 2.663 | ||
| Incremental Marketing Costs | 2 | 2 | 2 | 2 | 2 | 2 | 2 | 2 | ||
| Projected EBIT | ||||||||||
| Total revenues | 49.218 | 49.71 | 50.456 | 51.213 | 52.134 | 53.073 | 54.134 | 55.217 | ||
| Cost of goods sold | 24.56 | 24.756 | 25.076 | 25.401 | 25.806 | 26.218 | 26.688 | 27.167 | ||
| Gross Margin | 24.658 | 24.954 | 25.379 | 25.811 | 26.328 | 26.855 | 27.446 | 28.05 | ||
| Distribution Expenses | 2.953 | 2.983 | 3.027 | 3.073 | 3.128 | 3.184 | 3.248 | 3.313 | ||
| Marketing & Administration | 8.859 | 8.948 | 9.082 | 9.218 | 9.384 | 9.553 | 9.744 | 9.939 | ||
| Research & Development | 787 | 795 | 807 | 819 | 834 | 849 | 866 | 883 | ||
| Depreciation | 1.969 | 1.988 | 2.018 | 2.049 | 2.085 | 2.123 | 2.165 | 2.209 | ||
| Incremental Marketing Costs | 2 | 2 | 2 | 2 | 2 | 2 | 2 | 2 | ||
| EBIT | 10.306 | 10.611 | 10.952 | 11.337 | 11.763 | 12.243 | 12.790 | 13.432 | ||
| Projected Free cash flows | ||||||||||
| EBIT | 10.306 | 10.611 | 10.952 | 11.337 | 11.763 | 12.243 | 12.790 | 13.432 | ||
| Less: Taxes (2) | -2.474 | -2.547 | -2.629 | -2.721 | -2.823 | -2.938 | -3.070 | -3.224 | ||
| Add: Depreciation | 2.021 | 2.087 | 2.161 | 2.243 | 2.334 | 2.437 | 2.547 | 2.663 | ||
| Less: Capex | -2.925 | -2.925 | -2.925 | -2.925 | -2.925 | -2.925 | -2.925 | -2.845 | ||
| Less: Changes in working capital (2) (3) | -224 | 125 | -6 | 153 | 13 | 185 | 29 | 0 | ||
| Explicit forecasts free cash flow | 6.705 | 7.352 | 7.553 | 8.087 | 8.362 | 9.001 | 9.371 | 10.026 | ||
| Table 6b DCF Valuation ESG Scenario | ||||||||
| As per assignment questions | ||||||||
| Terminal value growth rate | 2,00% | |||||||
| Discount rate (WACC) | 7,94% | |||||||
| Summary of cash flows | ||||||||
| Explicit forecasts free cash flow | 6.705 | 7.352 | 7.553 | 8.087 | 8.362 | 9.001 | 9.371 | |
| Terminal value (4) | 168.762 | |||||||
| Discounted cash flows | ||||||||
| Present value of explicit cash flows | 6.211 | 6.310 | 6.006 | 5.958 | 5.707 | 5.691 | 5.489 | |
| Present value of terminal value | 98.849 | |||||||
| Enterprise value | ||||||||
| Present value of explicit cash flows | 41.371 | |||||||
| Present value of terminal value | 98.849 | |||||||
| Enterprise value | 140.221 | |||||||
| Equity Value (Net Debt: Cash less Long-term debt (case Exhibit 2)) | ||||||||
| Enterprise value | 140.221 | |||||||
| Less: Net Debt | -8.982 | |||||||
| Equity Value | 131.239 | |||||||
| Equity value per share (From case Exhibit 1 ) | ||||||||
| Equity Value | 131.239 | |||||||
| Outstanding shares | 5.500 | |||||||
| Equity value per share | 23,86 | |||||||
| Table 7 ESG Projections Hypotheses | |||||||||
| 2023 | 2024F | 2025F | 2026F | 2027F | 2028F | 2029F | 2030F | Terminal | |
| Unplanned downtime (days) | 13 | 12 | 11 | 10 | 9 | 8 | 7 | 6 | 6 |
| Revenues % growth rate | 2.00% | 2.30% | 2.60% | 2.90% | 3.20% | 3.40% | 3.70% | 4.00% | |
| Incremental Revenues (*) | 400 | 750 | 1,100 | 1,475 | 1,850 | 2,325 | 2,740 | 3,200 | |
| Costs as % of Sales Gross Margin | 50.10% | 50.20% | 50.30% | 50.40% | 50.50% | 50.60% | 50.70% | 50.80% | |
| Distribution Expenses | 6.00% | 6.00% | 6.00% | 6.00% | 6.00% | 6.00% | 6.00% | 6.00% | |
| Marketing & Administration | 18.10% | 18.25% | 18.40% | 18.55% | 18.70% | 18.85% | 18.95% | 18.95% | |
| Research & Development | 1.60% | 1.61% | 1.62% | 1.63% | 1.64% | 1.65% | 1.66% | 1.67% | |
| Depreciation | 4.00% | 4.00% | 4.00% | 4.00% | 4.00% | 4.00% | 4.00% | 4.00% | |
| Incremental Marketing Costs (*) | 2 | 2 | 2 | 2 | 2 | 2 | 2 | 2 | |
| Cost of Financial Debt Interest rate CapEx | 3.50% | 3.50% | 3.50% | 3.50% | 3.50% | 3.50% | 3.50% | 3.50% | |
| Investment in PP&E | 2,800 | 2,800 | 2,800 | 2,800 | 2,800 | 2,800 | 2,800 | 2,800 | |
| Incremental Capex | 125 | 125 | 125 | 125 | 125 | 125 | 125 | 45 | |
| Working Capital as a % on sales Tax Rate | -8.73% | -8.69% | -8.39% | -8.35% | -8.05% | -8.01% | -7.71% | -7.68% | |
| % effective tax rate | 24% | 24% | 24% | 24% | 24% | 24% | 24% | 24% | |
(1) From Income Statement (Case Exhibit 2)
(2) From Status Quo Projections (Case Exhibit 5)
(3) From Exhibit TN 4.
(4) From Exhibit TN 5
After forecasting revenues, the next step is to forecast costs in the ESG scenario (see Exhibit TN 3). This section can be opened by asking What costs can be expected in the ESG scenario? The cost forecast can be produced based on a percentage of sales approach. Key cost components—Gross Margin Operating Expenses, SG&A, Research & Development (R&D), and Depreciation—are projected as a proportion of revenues. The absolute cost amounts are derived by applying the percentages shown in Case Exhibit 5 to the forecasted revenues for each year. Additionally, in the ESG scenario marketing costs are categorized as recurrent or incremental.
Once revenues and costs have been estimated, the projected EBITs can be calculated simply by consolidating revenues and expenses (Exhibit TN 3). EBIT is calculated by subtracting from the gross profit the Operating Expenses, Research & Development Expenses, depreciation, Selling, General & Administrative (SG&A).
After calculating EBITs, changes in working capital and capex must be estimated (see Case Exhibit 5 and Exhibit TN 4) (Table 8 & Table 9). Next, explicit forecasted free cash flows can be established by subtracting income taxes from EBIT, adding back depreciation, and including the effect of the changes in working capital and capex (see Exhibits TN 3).
| Table 8 Changes in Working Capital | ||||||||
| Status quo scenario | ||||||||
| 2023 | 2024 | 2025 | 2026 | 2027 | 2028 | 2029 | 2030 | |
| Total revenues | 49,218 | 49,710 | 50,456 | 51,213 | 52,134 | 53,073 | 54,134 | |
| Working capital as a % on sales | -8.73% | -8.69% | -8.39% | -8.35% | -8.05% | -8.01% | -7.71% | |
| Working Capital | -4,636 | -4,297 | -4,322 | -4,231 | -4,277 | -4,195 | -4,252 | -4,174 |
| Changes in Working Capital | -339 | 25 | -90 | 45 | -82 | 57 | -78 | |
| Table 9 ESG Scenario | ||||||||
| 2023 | 2024 | 2025 | 2026 | 2027 | 2028 | 2029 | 2030 | |
| Total revenues | 50,531 | 52,179 | 54,016 | 56,079 | 58,359 | 60,919 | 63,672 | |
| Working capital as a % on sales | -8.73% | -8.69% | -8.39% | -8.35% | -8.05% | -8.01% | -7.71% | |
| Working Capital | -4,636 | -4,412 | -4,536 | -4,530 | -4,683 | -4,696 | -4,881 | -4,910 |
| Changes in Working Capital | -224 | 125 | -6 | 153 | 13 | 185 | 29 | |
The year´s net working capital is calculated as a percentage of sales (see Case Exhibits 4 and 5).
Capex is shown in Case Exhibits numbers 4 and 5.
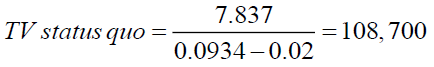
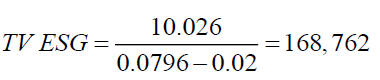
This section concludes with the calculation of the terminal value. The case gives the students the assumed long-term growth rate of 2%, assuming a perpetuity growth model. This model calculates the terminal value as the projected terminal year's free cash flow divided by the difference between the WACC (7.94% in the ESG scenario) and the perpetual growth rate. Exhibit TN 5 shows the formula applicable, and the terminal value estimated in each scenario.
Two common errors are made by students when calculating the terminal value. The first involves incorrectly using the 2030 free cash flow in the numerator of the terminal value formula instead of the terminal year free cash flow. Other students may have used 2030 projected forward by multiplying it by (1+g). The second error stems from misidentifying the year to which the terminal value corresponds. Specifically, students mistakenly may believe that the terminal value corresponds to the terminal year, when in fact, as constructed in the formula, it represents the value of cash flow from the terminal year onwards, discounted back to 2023.
5) Determine enterprise and equity values of Exotic Beverages in every scenario (20 minutes)
Exhibit TN 3 shows the DFC valuation in the ESG scenario. The forecasted cash flows and the terminal value are discounted at an 7.94% weighted average cost of capital to determine their present values. The enterprise value, calculated as the sum of discrete discounted cash flows and the present value of the terminal value, amounts to 140,221 million. After subtracting net debt (8,982 million euros, from long-term debt of 11,000 minus cash of 2,018 in 2023 balance sheet), the resulting equity value stands at 131,239 million. With 5,500 shares outstanding (from Case Exhibit 1,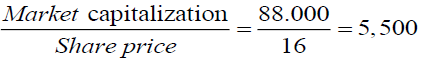 ) the Equity Value per Share is 23.86 euros.
Exhibit TN 2 (Table 10a & 10b) presents the valuation analysis in the status quo scenario, estimating the company's value based on its projected free cash flow and terminal value. These cash flows are discounted at the WACC of 9.21 % to determine their present value. The enterprise value is derived from summing the present values of free cash flow (34,058 million euros) and terminal value (58,668 million euros), resulting in 92,726 million euros. After deducting net debt (8,982 million euros), the equity value is 83,744 million euros. Finally, dividing this by 5,500 shares outstanding results in a value per share of 15.23 euros.
| Table 10a DCF Valuation, Status QUO Scenario | ||||||||||
| 2023 | 2024 | 2025 | 2026 | 2027 | 2028 | 2029 | 2030 | Terminal | ||
| Revenues Forecast | ||||||||||
| Sales 2023 (1) | 49.009 | |||||||||
| Days per year | 365 | 365 | 365 | 365 | 365 | 365 | 365 | 365 | 365 | |
| Unplanned downtime days (2) | 13 | 15 | 15 | 15 | 15 | 15 | 15 | 15 | 15 | |
| Operating days | 352 | 350 | 350 | 350 | 350 | 350 | 350 | 350 | 350 | |
| Revenues per operating day (2023) | 1,39,230 | |||||||||
| Growth revenues per day (2) | 1,00% | 1,00% | 1,50% | 1,50% | 1,80% | 1,80% | 2,00% | 2,00% | ||
| Revenues per operating day (forecast) | 1,40,622 | 1,42,029 | 1,44,159 | 1,46,321 | 1,48,955 | 1,51,636 | 1,54,669 | 1,57,763 | ||
| Total revenues | 49.218 | 49.71 | 50.456 | 51.213 | 52.134 | 53.073 | 54.134 | 55.217 | ||
| Cost Forecast (2) | ||||||||||
| Gross Margin | 24.658 | 24.954 | 25.379 | 25.811 | 26.328 | 26.855 | 27.446 | 28.05 | ||
| Distribution Expenses | 2.953 | 2.983 | 3.027 | 3.073 | 3.128 | 3.184 | 3.248 | 3.313 | ||
| Marketing & Administration | 8.859 | 8.948 | 9.082 | 9.218 | 9.384 | 9.553 | 9.744 | 9.939 | ||
| Research & Development | 787 | 795 | 807 | 819 | 834 | 849 | 866 | 883 | ||
| Depreciation | 1.969 | 1.988 | 2.018 | 2.049 | 2.085 | 2.123 | 2.165 | 2.209 | ||
| Projected EBIT | ||||||||||
| Total revenues | 49.218 | 49.71 | 50.456 | 51.213 | 52.134 | 53.073 | 54.134 | 55.217 | ||
| Cost of goods sold | 24.56 | 24.756 | 25.076 | 25.401 | 25.806 | 26.218 | 26.688 | 27.167 | ||
| Gross Margin | 24.658 | 24.954 | 25.379 | 25.811 | 26.328 | 26.855 | 27.446 | 28.05 | ||
| Distribution Expenses | 2.953 | 2.983 | 3.027 | 3.073 | 3.128 | 3.184 | 3.248 | 3.313 | ||
| Marketing & Administration | 8.859 | 8.948 | 9.082 | 9.218 | 9.384 | 9.553 | 9.744 | 9.939 | ||
| Research & Development | 787 | 795 | 807 | 819 | 834 | 849 | 866 | 883 | ||
| Depreciation | 1.969 | 1.988 | 2.018 | 2.049 | 2.085 | 2.123 | 2.165 | 2.209 | ||
| EBIT | 10.09 | 10.24 | 10.444 | 10.652 | 10.896 | 11.145 | 11.422 | 11.706 | ||
| Projected Free cash flows | ||||||||||
| EBIT | 10.09 | 10.24 | 10.444 | 10.652 | 10.896 | 11.145 | 11.422 | 11.706 | ||
| Less: Taxes (2) | -2.825 | -2.867 | -2.924 | -2.983 | -3.051 | -3.121 | -3.198 | -3.278 | ||
| Add: Depreciation | 1.969 | 1.988 | 2.018 | 2.049 | 2.085 | 2.123 | 2.165 | 2.209 | ||
| Less: Capex | -2.8 | -2.8 | -2.8 | -2.8 | -2.8 | -2.8 | -2.8 | -2.8 | ||
| Less: Changes in working capital (2) (3) | -339 | 25 | -90 | 45 | -82 | 57 | -78 | 0 | ||
| Explicit forecasts free cash flow | 6.094 | 6.586 | 6.648 | 6.963 | 7.049 | 7.405 | 7.512 | 7.837 | ||
| Table 10b DCF Valuation Status QUO Scenario | ||||||||
| As per assignment questions | ||||||||
| Terminal value growth rate | 2,00% | |||||||
| Discount rate (WACC) | 9,21% | |||||||
| Summary of cash flows | ||||||||
| Explicit forecasts free cash flow | 6.094 | 6.586 | 6.648 | 6.963 | 7.049 | 7.405 | 7.512 | 7.837 |
| Terminal value (4) | 108.7 | |||||||
| Discounted cash flows | ||||||||
| Present value of explicit cash flows | 5.580 | 5.522 | 5.104 | 4.895 | 4.538 | 4.365 | 4.054 | |
| Present value of terminal value | 58.668 | |||||||
| Enterprise value | ||||||||
| Present value of explicit cash flows | 34.058 | |||||||
| Present value of terminal value | 58.668 | |||||||
| Enterprise value | 92.726 | |||||||
| Equity Value (Net Debt: Cash less Long-term debt (case Exhibit 2)) | ||||||||
| Enterprise value | 92.726 | |||||||
| Less: Net Debt | -8.982 | |||||||
| Equity Value | 83.744 | |||||||
| Equity value per share (From case Exhibit 1 ) | ||||||||
| Equity Value | 83.744 | |||||||
| Outstanding shares | 5.500 | |||||||
| Equity value per share | 15,23 | |||||||
(1) From Income Statement (Case Exhibit 2)
(2) From Status Quo Projections (Case Exhibit 4)
(3) From Exhibit TN 4.
(4) From Exhibit TN 5
When comparing the firm´s valuation in both scenarios, the ESG-driven valuation leads to a potential upside of the share of 8.63€ or 53.93% with respect its current quotation of 16 euros. To spark discussion, the instructor could ask the students, “Why does the ESG scenario result in a higher valuation? Is the potential increase in share valuation sufficient justification for maintaining the stake in Exotic Beverages? Given the substantial financial upside and risk mitigation benefits, most students may likely conclude that holding the stake seems advisable.
However, the instructor may challenge this viewpoint by raising that if ESG execution is delayed or uncertain, a hold strategy could increase GCAM’s risk exposure. To encourage deeper analysis, the instructor might challenge students’ "hold" recommendation by asking: If ESG implementation is delayed, how would that affect your recommendation? Additionally, the instructor could prompt students to consider: If the ESG plan is postponed or cancelled, what early warning signs should Jorge and Sandra monitor to reassess or recommend divestment?
6) Sensitivity analysis of both scenarios to changes in terminal growth rate and WACC (10 minutes)
A key closing observation is that the terminal value accounts for a significant portion of the valuation (around 60%), making long-term assumptions critical. To lead this issue to the sensitivity analysis, the instruct can also ask: Terminal value accounts for about 60% of the valuation, does that raise any red flags for you? Why might that be a concern or not? This section is intended to make evident to students the importance of sensitivity analysis in firm valuation. This part of the discussion can begin with the instructor asking Given that the terminal value accounts for a large share of the firm’s valuation, how confident are you in the terminal growth assumptions? If you were skeptical about the long-term growth rate used in the terminal value, what would you do as an analyst or investor?
Students should conclude that sensitivity analysis allows for determining how the valuation varies when certain input assumptions change, the growth of terminal value free cash flow and WACC in this case. The instructor should emphasize how sensitivity analysis improves the confidence in valuation estimates. The instructor can point out that analysts in investment banks typically come out with a two-dimensional data table to capture the various growth and discount rates. An example of such a table is shown in Exhibit TN 6 (Table 11 & Table 12). The exhibit helps students visualize how even small changes in discount or growth rates can significantly influence firm value (Aouadi et al., 2018). Notably, the ESG scenario consistently yields higher valuations, offering an opportunity to discuss the potential value implications of ESG-related strategic shifts. Instructors may ask students to identify which variable (WACC or growth) has a greater impact on valuation, and to interpret the range of values as a reflection of uncertainty in key financial assumptions. While both variables significantly influence valuation outcomes, changes in the WACC tend to have a larger marginal effect. For example, in the status quo scenario, holding the growth rate at 2.00%, increasing the WACC from 8.61% to 9.81% reduces the per-share value by €2.87. In contrast, holding the WACC at 9.21% and decreasing the growth rate from 2.60% to 1.40% reduces the value by €2.27. So, in class, students may observe that WACC typically dominates in driving valuation shifts, especially because it affects both the discounting of near-term cash flows and the terminal value. That makes it a key area of focus in valuation sensitivity analysis.
| Table 11 Sensitivity Analysis | ||||||
| Status Quo Scenario | ||||||
| Per Share Value | ||||||
| Growth Rate | ||||||
| 1.40% | 1.70% | 2.00% | 2.30% | 2.60% | ||
| WACC | 8.61% | 15.78 € | 16.26 € | 16.78 € | 17.36 € | 17.99 € |
| 8.91% | 15.06 € | 15.50 € | 15.97 € | 16.49 € | 17.05 € | |
| 9.21% | 14.10 € | 14.80 € | 15.23 € | 15.69 € | 16.37 € | |
| 9.51% | 13.80 € | 14.16 € | 14.54 € | 14.96 € | 15.41 € | |
| 9.81% | 13.23 € | 13.56 € | 13.91 € | 14.29 € | 14.70 € | |
| Table 12 ESG Scenario | ||||||
| Per Share Value | ||||||
| Growth Rate | ||||||
| 1.40% | 1.70% | 2.00% | 2.30% | 2.60% | ||
| WACC | 7.34% | 24.74 € | 25.74 € | 26.84 € | 28.08 € | 29.47 € |
| 7.64% | 23.42 € | 24.30 € | 25.27 € | 26.36 € | 27.57 € | |
| 7.94% | 22.21 € | 23.00 € | 23.86 € | 24.82 € | 25.88 € | |
| 8.24% | 21.12 € | 21.82 € | 22.59 € | 23.43 € | 24.37 € | |
| 8.54% | 20.11 € | 20.74 € | 21.43 € | 22.19 € | 23.02 € | |
7) Summarize of lessons learned (5 minutes)
In this last section of the case analysis, the instructor may emphasize the key takeaways of the case:
1) ESG Integration: Sustainability initiatives can enhance financial performance and corporate reputation but may require significant investment.
2) Reputation Management: Addressing reputational risks is essential for maintaining stakeholder trust and market competitiveness. The case highlights the financial and strategic impact of corporate reputation.
3) Analytical Rigor: DCF and sensitivity analysis helps understand the impact of ESG initiatives on valuation outcomes. Students should develop the ability to test assumptions and interpret results effectively.
Exhibit TN 1. WACC.
This Exhibit TN is only relevant for advanced corporate finance courses, where students are already familiar with the CAPM model. In other cases—such as those suggested in assignment question number 3—it is preferable to provide the pre-calculated WACC and omit this appendix.
To calculate the WACC, the first step is to determine the cost of equity (Ke). As specified in question 3 of the assignment, this should be determined using the Capital Asset Pricing Model (CAPM), which is expressed by the following formula:
Ke = Rf + βL * Rm
Where: Ke = Cost of equity; Rf= Risk free rate; β = Levered beta; Rm = Market Risk Premium.
According to Case Exhibit 3:
• Rf best fits with the 10-year German Eurobond Rate (3%). Its 10-year maturity aligns with the time frame used in forecasting the cash flows for valuation purposes. In contrast, short-term rates such as the 3-month US Treasury bill may underestimate long-term required returns. Furthermore, German bonds benefit from Germany’s credit rating and strong fiscal stability, offering a virtually risk-free instrument that avoids the sovereign risk premiums embedded in alternatives like Spanish Eurobonds.
• Levered beta (βL) is not given, but Case Exhibit 3 provides the unlevered beta (βU) for the global soft drinks sector (0,93). Using the Hamada equation:
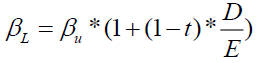
where is market value of the debt-to-market value of the equity ratio of the company as of the end of 2023 (see in Case Exhibit 1 and 3). It results
 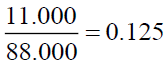 . Therefore:
βL = 0.93 * (1+(1-0.24) * 0.125) = 1.02
• Rm, the risk market premium as per Case Exhibit 3, is 5.5%.
Consequently, Ke (ESG) results:
Ke (ESG) = 3% + 1.02* 5.5% = 8.60%.
With this data, the WACC in ESG scenario results:

Following Case Exhibit 3, the cost of equity of the status quo scenario is established by adding 1.4% to the Ke (ESG), this is 8.6% + 1.4% = 10%. With this data, the WACC in the status quo scenario:

Using a growing perpetuity:
Where:
• TV = Terminal value at the end of the forecast period; FCF terminal = Free cash flow in the final projected year, adjusted for perpetual growth; WACC = Weighted Average Cost of Capital; g = perpetual growth rate of free cash flow.
End Notes
1In advanced corporate finance courses, the instructor may opt to change this question to: How is free cash flow calculated? Produce the projections of free cash flows for both scenarios. Assume a long-term cash flow growth rate of 2,00% in both scenarios. Calculate the firm´s cost of equity using CAPM and data from Exhibit 3. For simplicity, calculate only the cost of equity for the ESG initiatives scenario and add 1,4% to get the cost of equity in the status quo scenario. What is the WACC in both scenarios?
References
Aouadi, A., & Marsat, S. (2018). Do ESG controversies matter for firm value? Evidence from international data. Journal of business ethics, 151, 1027-1047.
Indexed at, Google Scholar, Cross Ref
Badia, G., Cortez, M. C., & Ferruz, L. (2020). Socially responsible investing worldwide: Do markets value corporate social responsibility?. Corporate Social Responsibility and Environmental Management, 27(6), 2751-2764.
Indexed at, Google Scholar, Cross Ref
Cornell, B., & Damodaran, A. (2020). Valuing ESG: Doing good or sounding good?. NYU Stern School of Business.
Indexed at, Google Scholar, Cross Ref
Cornell, B., & Shapiro, A. C. (2021). Corporate stakeholders, corporate valuation and ESG. European Financial Management, 27(2), 196-207.
Indexed at, Google Scholar, Cross Ref
Derrien, F., Krueger, P., Landier, A., & Yao, T. (2022). ESG news, future cash flows, and firm value. Swiss finance institute research paper, (21-84).
Giese, G., Lee, L. E., Melas, D., Nagy, Z., & Nishikawa, L. (2019). Foundations of ESG investing: How ESG affects equity valuation, risk, and performance. Journal of portfolio management, 45(5), 69-83.
Indexed at, Google Scholar, Cross Ref
Glavas, D. (2023). Valuation and Sustainability: A Guide to Include Environmental, Social, and Governance Data in Business Valuation. Springer Nature.
Indexed at, Google Scholar, Cross Ref
Li, Y., Gong, M., Zhang, X. Y., & Koh, L. (2018). The impact of environmental, social, and governance disclosure on firm value: The role of CEO power. The British accounting review, 50(1), 60-75.
Indexed at, Google Scholar, Cross Ref
Narula, R., Rao, P., & Rao, A. A. (2023). Impact of ESG on firm value: a conceptual review of the literature. Journal of Social and Economic Development, 25(Suppl 1), 162-179.
Indexed at, Google Scholar, Cross Ref
Quintiliani, A. (2022). ESG and firm value. Accounting and Finance Research, 11(4), 37.
Indexed at, Google Scholar, Cross Ref
Received: 31-Mar-2025, Manuscript No. jiacs-25-15815; Editor assigned: 01-Apr-2025, PreQC No. jiacs-25-15815(PQ); Reviewed: 14-Apr-2025, QC No. jiacs-25-15815; Revised: 19-Apr-2025, Manuscript No. jiacs-25-15815(R); Published: 26-Apr-2025