Research Article: 2021 Vol: 25 Issue: 4S
Prioritization of Risks in Supply Chain of Automotive Part Manufacture in Thailand
Walailak Atthirawong, King Mongkut's Institute of Technology Ladkrabang
Abstract
Known as the “Detroit of Asia”, Thailand has long been renowned as the primary manufacturer of automobiles among ASEAN countries and has been recognized in economic success story. For Japanese manufacturers, the country is very attractive as the first choice of automobile manufacturing main base. Definitely, motor parts require a lot of components and piece parts causing supply chain very complex to the automotive industry and unavoidably more potential risk factors. This research aims to identify factors that affect supply chain risks in the automotive parts manufacture and prioritize such the risks according to the levels of impacts. A survey research design was employed and data was collected from questionnaire survey to at first identify risks. Also, factor analysis was conducted to identify factors that would potentially affect such the risks in Automotive Part Manufactures. From the analysis, five criteria were extracted; i.e.,1) supply risk, 2) external risk, 3) demand risk, 4) production planning risk, and 5) technological risk. Entropy and TOPSIS methods were further applied to rank those criteria. It was revealed that production planning risk should be considered and focused as the highest impact, whereas supply risk and external risk were ranked in the same level at the second priority. Recommendations for reducing the risks are also discussed.
Wariya Panprung, Phranakhon Rajabhat University
Keywords
Automotive Industry, Entropy Method, Factor Analysis, TOPSIS Method, Risk Factors
Introduction
Automotive industry is a vital contributor to the prosperous economy in Thailand. The industry has been steadily and continually developed for over 60 years, as an assembler of auto part components up to a top automotive manufacturer as well as a major export hub. The country was then ranked the 12th most industrious auto manufacturer in the world, and the largest producer in Southeast Asia. The industry did contribute accounting for approximately 10% of the country’s Gross Domestic Product (GDP) employing 850,000 people (Maikaew, 2019). The production rendered 2.1 million units in 2018, growing 8.5% from 2017. The total number of domestic car sales in year 2018 was 1.04 million units risen 20% YoY (Economic Outlook Report, 2019).
However, from time to time, every country has been facing with unpredicted events such as natural disasters, which more or less have knocked the worldwide auto industry off balance. For instance, earthquake and tsunami in Japan in 2011 had crippled production of major Japanese auto companies for several months and consequently affected global automotive supply chain. At that time, many companies in Thailand including Toyota and Ford had to stop production because of heavy flood-related supply chain disruptions (Infor, 2012). Moreover, the severe disruptions caused by the coronavirus (COVID-19) outbreak have forced auto makers and their suppliers worldwide to idle production. Such disruptions have been continuously widely spread and fast moving with acute and immediate effects to business and every industrial sector as well as consumers. The pandemic did raise a number of unique challenges and throw the economic outlook into uncertainty and unavoidably the automotive industry was one of the front lines. Manufacturers faced with part shortage, both domestic and overseas. Under this scenario, risks that go unaddressed can mislead production targets and even cause vehicle recalls. Besides, the uncertainty of various factors, both internal and external supply chains are most likely root causes of operation problems to entrepreneurs. The factors of supply chains are, for example, raw material prices, quality, lead time, delivery time to customers, labor or personnel in production chain, while external factors that may affect production and product delivery are, for example, natural disasters, political volatility, etc (Dechprom & Jermsittiparsert, 2019).
To identify factors that affect supply chain risks in the automotive parts manufacture, the research was conducted by using factor analysis method and then followed by entropy and TOPSIS methods to prioritize the risks based on the levels of impacts. The scope of this research is to study the manufacture of automotive parts for passenger cars/pick-up only. The following section summarizes major supply chain risk issues according to the literature survey. Next section presents research methodologies and followed by the results. The final section presents a conclusion and recommended future research directions.
Major Supply Chain Risk Factors
Risk in supply chain refers to unreliable or unpredictable events which can result in hindrances, disruptions or harmful impact to the product or supply chain profitability (Claypool, et al., 2015) and cause undesired results (Walker et al., 2003). It is necessary for any organization to identify, analyze and manage risks from a more diverse range of sources and contexts (Madani & Jermsittiparsert, 2019; Thongrawd, 2019). According to the previous research, supply chain risk factors can be divided into several dimensions. For instance, Waters (2007); Christopher (2005); Bavarsad, et al., (2014) conclusively categorized risks into five categories; i.e., raw material management, production process, operation & control system, demand, and external environment. Christopher & Peck (2004); Manuj & Mentzer (2008) classified those risks into four groups; i.e., supply risk, demand risk, operational risk and security risk, whereas Ho, et al., (2015) classified those risks into 2 groups, i.e., (1) macro risks which are environmental risks, the factors include natural and man-made disasters such as earthquakes, wars and economic downturns, and (2) micro risks which are sub-classified to four categories; i.e., demand risk, manufacturing risk, supply risk and infrastructure risk. Table 1 illustrates major supply chain risk factors as identified from literature survey conducting between 2011 and 2020 which are hereby used as conceptual framework.
Such factors also include different sub-factors that possibly affect risks, among which the factors may be correlated among themselves. Accordingly, factor analysis method was employed to analyze data to identify corresponding factors of the same group.
| Table 1 Major Supply Chain Risk Factors |
||||||||||
|---|---|---|---|---|---|---|---|---|---|---|
| Type of Risk | Authors | |||||||||
| (1) | (2) | (3) | (4) | (5) | (6) | (7) | (8) | (9) | (10) | |
| Demand risk | ✓ | ✓ | ✓ | ✓ | ✓ | ✓ | ✓ | ✓ | ||
| Supply risk | ✓ | ✓ | ✓✓ | ✓ | ✓ | ✓ | ||||
| ✓roduct risk | ✓ | ✓ | ✓ | |||||||
| Internal process risk | ✓ | ✓ | ✓ | ✓ | ✓ | ✓ | ✓ | |||
| Information risk | ✓ | ✓ | ||||||||
| Infrastructural risk | ✓ | |||||||||
| Management risk | ✓ | ✓ | ✓ | ✓ | ||||||
| Financial risk | ✓ | ✓ | ✓ | ✓ | ||||||
| Logistical risk | ✓ | ✓ | ||||||||
| Environment risk | ✓ | ✓ | ✓ | ✓ | ✓ | ✓ | ||||
| Catastrophic risk | ✓ | ✓ | ||||||||
| Regulatory, legal or bureaucratic risks | ✓ | ✓ | ||||||||
Notes: (1) Tang & Musa (2011); (2) Diabat, et al., (2012); (3) Samvedi, et al., (2013); (4) Blos, et al., (2013); (5) Caridad, et al., (2014); (6) Florian & Constangioara (2014); (7) Aqlan & Lam (2015); (8) Munyuko (2015); (9) Makwana & Pitroda (2017); (10) Dias, et al., (2020)
Research Methods
This research employed factor analysis method to identify factors that affect supply chain risks of automotive parts manufactures, and then rank the risks through entropy weight and TOPSIS methods. Research methodologies and literature of relevant factors are described below.
Population and Sample
At initial stage, data were collected by means of hand-delivered questionnaires. Population in this study refers to automotive players in supply chains consisting of three major groups involved, i.e., raw materials or part suppliers, assembly manufacturers and dealers since these three groups are to coordinate for accommodating complete delivery to consumers and responding to customers’ requirements. The questionnaires were mailed to 339 top management posts, of which 244 completed questionnaires were returned and used to analyze, representing 71.97% of the total queries posted.
Research Instrument
Instruments used are questionnaires, being comprised of three parts. The first part includes socioeconomic and demographic variables consisting of 6 queries. The second part is the main part with questionnaire of 38 items. The questionnaire was anchored using five-point likert scale, ranging from “strongly disagree (1)” to “strongly agree (5)”. The final part is open-ended inquiries asking for opinions and ideas on how to reduce the risks.
Reliability
Reliability test is most frequently used in empirical studies in order to assess internal consistency and it is verified by using Cronbach’s Alpa Coefficient (Cronbach, 1951). Cronbach’s Alpha was employed to assess the reliability of each internal consistency. Thirty sets of questionnaires were tested by using Cronbach's Alpha Coefficient obtained equal to 0.936. This indicated that from the respondents’ points of view, the items had relatively high internal consistency.
Entropy Weight Method
Entropy was first introduced by Shannon in 1948 (Lotfi & Fallahnejad, 2010). Entropy weight method has been widely applied for evaluating weights of indicators. According to Wang, et al., (2017), this objective weighting process can overcome the shortage of subjective weighting method. The entropy method should be engaged to calculate actual weight within the weighting process of evaluation indicator system. Hence, the effect of human subjective factors can be avoided. As such, this research has employed entropy method to determine the criteria weight using in TOPSIS procedure. The following summarizes the basic of Shannon entropy weighting process:
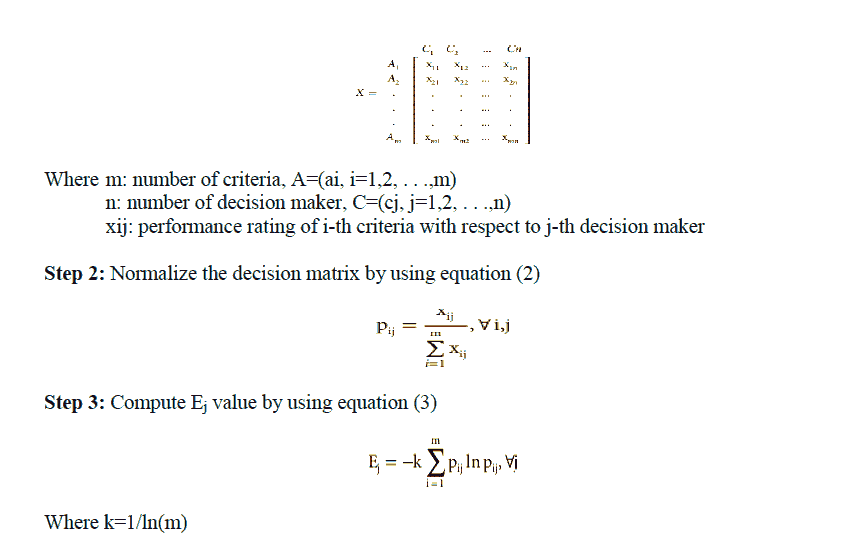
Step 1: Construct decision matrix. This matrix is described by:
Step 4: Calculate dj value, which is the degree of deviation of essential information for each criterion by using equation (4).

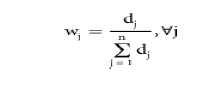
Step 5: Calculate wj value, which is the important weight of j-th criteria, by using equation (5). A sum of the weights of all criteria must be equal to 1.
TOPSIS Method
TOPSIS (Technique for Order Preference by Similarity to Ideal Solution) was developed by Hwang and Yoon in 1981 (Tzeng & Huang, 2011). It is one of the multi-criteria decision making methods which attempts to rank different alternatives through numerical evaluations the decision maker performs with respect to certain criteria. TOPSIS method is a technique for order preference by similarity to ideal solution (Atthirawong, 2020; Milani et al., 2005). The positive ideal solution is a solution that maximizes the benefit criteria and minimizes the cost criteria. On the other hand, the negative ideal solution maximizes the cost criteria and minimizes the benefit criteria (Chen, 2000). The basic concept of this method is to select the best alternative that has the shortest distance from the ideal solution and the farthest distance from the negative ideal solution in a geometrical sense (Alinezhad & Khalili, 2019; Tzeng & Huang, 2011). In practice, TOPSIS has been fruitfully resolved real-world decision problems satisfactorily, including supply chain management and logistics, engineering and manufacturing systems, and business and marketing management (Behzadian et al., 2012). Consequently, TOPSIS method was then employed to prioritize risks in supply chain of automotive part manufacture. The steps of TOPSIS can be summarized as follows:
Step 1: Construct normalized decision matrix R=(rij)m*n. This step transforms various attribute dimensions into non-dimensional attributes, which allows comparisons across criteria. Vector normalization is of the most frequently used methods of calculating the normalized value (Roszkowska, 2011).
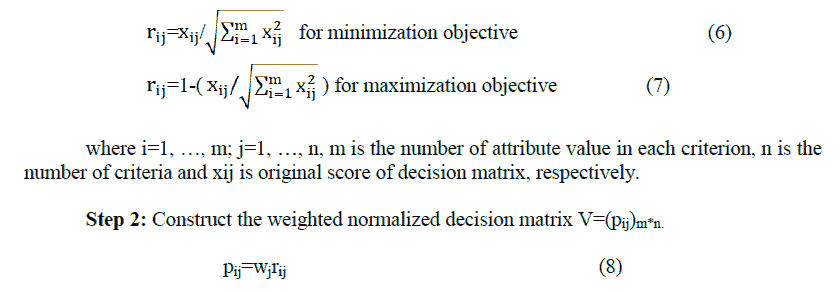
Here wj represents a weight of each criterion for j=1,…n. Given wj ∈ [0,1] with w1+w2+…+wn=1, then multiply each column of the normalized decision matrix by its associated weight to get pij. In this case, weights will be directly determined by the entropy method.
Step 3: Determine the positive ideal (A*) and negative ideal solutions (A').
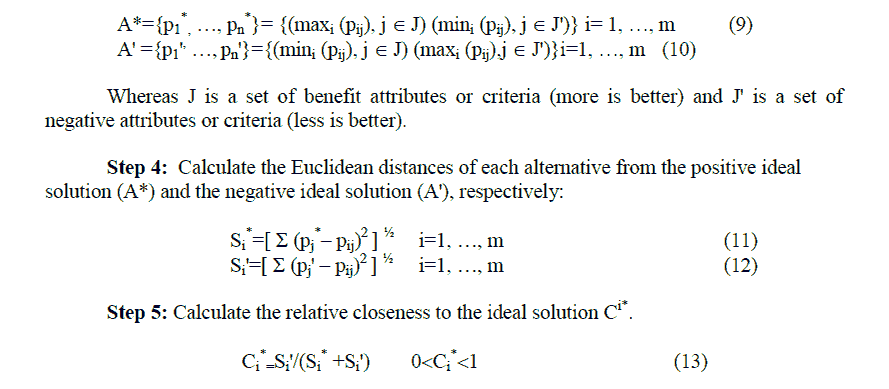
Step 6: Rank the alternatives according to the relative closeness to the ideal solution and select the alternative with maximum Ci* which is closest to 1. The higher value of Ci*, the better alternative (Behzadian et al., 2012; Roszkowska, 2011).
Research Results
Supply Chain Risk Factors
A factor analysis method was used to categorize factors variables that have influences on risk factors in automotive supply chain using SPSS 22.0. According to Table 2, the calculated value of KMO was equivalent to 0.917 representing that the existing data was appropriate to apply factor analysis technique. For the Bartlett's Test of Sphericity, which was used to test the hypothesis, the Chi-square was 4,184.319 and p-value equaled to 0.00. Accordingly, the hypothesis (H0) was refused. The result indicated that variances had been equal across the samples. Consequently, it can be concluded that data collected was appropriate for factor analysis technique.
| Table 2 KMO And Bartlett’s Test Of Sphericity Values Of Parts Manufacture |
||
|---|---|---|
| Kaiser – Meyer – Olkin Measure of Sampling Adequacy | 0.917 | |
| Bartlett’s Test of Sphericity | Approx. Chi-Square | 4184.319 |
| df | 561 | |
| sig. | 0 | |
Then, factor extraction was proceeded to consider how many factors could be classified through principle component analysis. Each component was assigned without correlation. An orthogonal rotation with Varimax was chosen at 25 cycles in factor extraction. Eigenvalues were higher than 1 and did not show the factor loading less than 0.3. Obtainable Eigenvalues more than 1 consisted of only 5 factors. What’s more, the first factor can describe the most variables up to 33.621% and eliminate the variables with factor loading values less than 0.3 making the variables to be classified as factors remaining only 34. When analyzing Scree Plot, corresponding conclusions were shown in Figure 1.

Figure 1 Scree Plot in Factor Selection
According to Scree plot analysis in Figure 1, the crossing of the graph was located at the component numbers of 4-6. The component weights must not be less than 0.40. Therefore, factors for parts manufacture can be classified based on 5 criteria as follows:
Factor 1: Supply Risk (F1)
The first component consists of 15 factors which are product quality, broken machinery, reliability of data from suppliers, production flexibility, quality of raw material, welfare and labor costs of company, production capability, material shortages, material costs, pricing demand change, delivery flexibility both in terms of quantity and timing, unexpected incident, delivery failure, customers’ requirements change, and high flexibility of customers’ needs. This group of variables has eigenvalue equal to 11.588.
Factor 2: External Risk (F2)
The second component consists of 8 factors which are insurgence, natural disasters, protests, logistics, rules, regulations and government policies, partners’ relocation of manufacturing base, traffic problems, and cost of competitors. This group of variables has eigenvalue equal to 7.403.
Factor 3: Demand Risk (F3)
The third component consists of 7 factors which are environmental issues, reliability of data from customers, fulfillment of customer orders, market conditions and economic environment, company’s financial condition, changes of customer orders, both in terms of quantity and delivery schedule, and customer requirements. This group of variables has eigenvalues equal to 2.499.
Factor 4: Production Planning Risk (F4)
The fourth component consists of 3 factors which are quality of production staff, lack of proper production planning system, and shortages of production stuff. This group of variables has eigenvalues equal to 2.113.
Factor 5: Technological Risk (F5)
The fifth component has only 1 factor, i.e., changes in production technology. This group of variables has eigenvalues variable equal to 1.151.
Prioritization of Supply Chain Risk Criteria
Even though factor analysis method was accomplished as the first step of identifying risk factors, still remains the question about the ranking. In this regard, TOPSIS, a well-known of Multi-criteria Decision Making (MCDM) method, was employed to prioritize such the factors. Six experts who have experiences more than ten years had involved in this ranking process of TOPSIS procedure. To rank supply chain risk factors by TOPSIS process, the criteria (the columns of the matrix) were replaced by the expert’ opinion (DM1 - DM6) and the alternatives (rows of the matrix) were replaced by five criteria (F1 - F5) acquired from factor analysis. Then decision matrix was created by each expert. Whereas ai indicates the i-th criterion, i=1, 2,…,5; DMj typifies the j-th expert, j=1,2,…, 6; xij represents risk impact of the i-th criterion as regards j-th expert which corresponds to an integer in range 1-5. Score 5 means criterion has the most impact in the supply chain, while score 1 means minimal impact. Table 3 demonstrates the normalized decision matrix and Table 4 demonstrates the weight of each criterion obtained by the entropy method.
| Table 3 The Normalization Matrix |
||||||
|---|---|---|---|---|---|---|
| DM1 | DM2 | DM3 | DM4 | DM5 | DM6 | |
| F1 | 0.639332 | 0.549165 | 0.549165 | 0.639332 | 0.549165 | 0.639332 |
| F2 | 0.709979 | 0.613305 | 0.516632 | 0.516632 | 0.613305 | 0.613305 |
| F3 | 0.447214 | 0.447214 | 0.447214 | 0.268328 | 0.357771 | 0.447214 |
| F4 | 0.748024 | 0.622036 | 0.622036 | 0.622036 | 0.496047 | 0.496047 |
| F5 | 0.410391 | 0.512989 | 0.512989 | 0.410391 | 0.205196 | 0.307794 |
| Table 4 Weights Of Each Criterion |
|||||
|---|---|---|---|---|---|
| F1 | F2 | F3 | F4 | F5 | |
| wj | 0.014065 | 0.01732 | 0.12964 | 0.159745 | 0.67923 |
At the final step, TOPSIS method was applied to prioritize the impact of risks using equations (9)-(13), as shown in Table 5. The results indicated that the most impact factor in the supply chain risk of automotive part industry was production planning risk, followed by supply risk and external risk which were of the same intense of effect.
| Table 5 Final Evaluation And Ranking Of Criteria |
||||
|---|---|---|---|---|
| Si* | Si' | Ci* | Rank | |
| F1 | 0.033 | 0.113 | 0.777 | 2 |
| F2 | 0.034 | 0.119 | 0.777 | 2 |
| F3 | 0.115 | 0.034 | 0.231 | 4 |
| F4 | 0.027 | 0.121 | 0.816 | 1 |
| F5 | 0.124 | 0.029 | 0.191 | 5 |
According to Neiger, et al., (2009), supply chain risk management (SCRM) is a process of identifying potential risks of entire supply chains, analyzing and determining characteristics, sources and contexts in order to efficiently manage those risks. Risks ranking will support companies to identify which factors are important and need more attention. This article aims to identify supply chain risk factors of automotive parts manufacture through questionnaires and to prioritize them. Based on the exploratory factor analysis model, 34 factors were classified into 5 criterion groups; which are 1) supply risk, 2) external risk, 3) demand risk, 4) production planning risk, and 5) technological risk. Then, the entropy and TOPSIS methods were employed to rank the most critical risk criteria based on impacts levels. Considering on the experimental results, production planning risk is considered the highest impact. This is in compliance with the study of Jiang, et al., (2009) who mentioned that most common risks in supply chains had been based on production such as equipment failures or lack of proper documentation for customs formalities, quality problems and high turnover. As argued by Thun & Hoenig (2011), trends toward lean production leading to take more risks in production planning. According to risk management, it is crucial for each organization to identify who are to responsible for and have authority to make decision and who are to control and manage production planning risk factors. Besides, the collaboration among partners of the automotive part manufacture supply chain and the transparency of the production and operation processes are also very important. Professional training in production planning process, defining and allocating the clear-cut accountabilities and responsibilities as well as creating appropriate working environment and humane management would also reduce the risks. A monitoring system that enables visibility of the entire chain and production process cannot be ignored, but instead considered very supportive. In addition, as suggested by Manuj & Mentzer (2008), flexibility, organizational learning, information system and performance metrics/rewards are recognized as key enablers in the process of risk management and mitigation.
From the study, supply risk and external risk showed the same level of priority as the second rank. Supply risk refers to suppliers’ ability to meet product designated quality and quantity in terms of delivery reliability and budget (Sasha et al., 2013). This conclusion was supported by Mohtasham, et al., (2015) who claimed that the majority of risks relating to the supply chain were caused by uncertain quality of delivered product and delayed delivery. External risk factor which interrupted the chain flows had been also mentioned in many studies. For example, Dais, et al., (2020) mentioned that Ford had to stop production in five plants due to the terrorist attacks on September 11, 2001. In order to overcome supply chain disruptions and reduce both risks, vendor-induced risks should be explored by constructing an empirically reliable model for supplier evaluation. This suggestion is in line with the study of Cagnin, et al., (2016) who confirmed that a systematic supplier selection method would provide principle advantage in identifying potential risks prior to approaching suppliers. A vendor selection model should be considered on vendors’ product quality by looking into machinery, equipment performance, production capacity, and performance of quality control function, for instance. Moreover, such model should incorporate external risk factors from supply side such as geographical location and level of stability of suppliers’ status with respect to country and region whether there would be any possibilities of war, terrorism or natural disaster and if so, levels of seriousness and frequency of the happenings (Mohtasham et al., 2015).
Our contribution relates to identifying and ranking unpredictable events potentially impacted the automotive part manufacture supply chain, by applying a combination of tools (statistical analysis and multi-criteria decision making approach) that can be supportive to professionals and researchers who are engaging in studies on the management of the supply chain risks. The results of this research can possibly contribute to the continuous supervision by adopting appropriate risk strategies selection on critical risk factors (Ho et al., 2015) in order to minimize the likelihood of risks occurrence. In addition, the findings could also help the professionals in automotive part manufacture to achieve effective risk management in the whole supply chain.
As risks are unavoidably existing in everywhere business; this study can be expanded to identify supply chain risk factors faced by other manufacturing business, to investigate risk factors assessment and rank them according to the levels of their industry exposure. Likewise, there are other risk assessment methods considering on the parameters of risks assessment both probability and together with their impacts, which might be worth exploring. Despite the fact that several analysis methods were employed in this research, there are also more methods that could be utilized for further study such as fuzzy methods to deal with imprecise judgments, as well as ambiguous judgment.
Acknowledgement
The first author would like to thank King Mongkut’s Institute of Technology Ladkrabang for supporting this research.
References
- Alinezhad, A. & Khalili, J. (2019). New methods and applications in multiple attribute decision making (MADM). Springer: Switzerland. Retrieved from https://doi.org/10.1007/978-3-030-15009-9.
- Aqlan, F., & Lam, S.S. (2015). A fuzzy-based integrated framework for supply chain risk assessment. International Journal of Production Economics, 161, 54-63.
- Atthirawong, W. (2020). Application of TOPSIS method to green supplier selection for a Thai OTOP producer. Current Applied Science and Technology, 20(1), 144-155.
- Bavarsad, B., Boshagh, M., & Kayedian, A. (2014). A study on supply chain risk factors and their impact on organizational performance. International Journal of Operations and Logistics Management, 3(3), 192-211.
- Behzadian, M., Otaghsara, S.K., Yazdani, M., & Ignatius, J. (2012). A state-of the-art survey of TOPSIS applications. Expert Systems with Applications, 39(17), 13051-13069.
- Blos, M.F., Hoeflich, S.L., Dias, E.M., & Wee, H.M. (2015). A note on supply chain risk classification: discussion and proposal. International Journal of Production Research 53(5), 1568-1569.
- Cagnin, F., Oliveira, M.C., Simon, A.T., Helleno, A.L., & Vendramini,M.P. (2016). Proposal of a method for selecting suppliers considering risk management. International Journal of Quality & Reliability Management, 33(4), 488-498.
- Caridad, J.M., Hanclova, J., & Černý, J. (2014). An empirical analysis of the influence of risk factors on the frequency and impact of severe events on the supply chain in the Czech Republic. Quality Innovation Prosperity, 18(2), 56-78.
- Christopher, M. (2005). Logistics and supply chain management: Creating value-adding networks (3rd Edition). Harlow: FT Prentice-Hall.
- Christopher, M., & Peck, H. (2004). Building the resilient supply chain. International Journal of Logistics Management, 15(2), 1-19.
- Chen, C.T. (2000). Extensions of the TOPSIS for group decision making under fuzzy environment. Fuzzy Sets Systems, 114(1), 1-9.
- Claypool, E.G., Norman, B.A., & Needy, K.L. (2015). Design for supply chain: An analysis of key risk factors. Industrial Engineering & Management, 4(2).
- Cronbach, L.J. (1951). Coefficient alpha and the internal structure of test. Psychometrika 16(3), 297-334.
- Dechprom, S., & Jermsittiparsert, K. (2019). Sustainability related supply chain risks: A case of multiple organizational strategic networks. International Journal of Innovation, Creativity and Change, 5(2), 769-785.
- Dias, G.C., Hernandez, C.T., & Oliveira, U.R. (2020). Supply chain risk management and risk ranking in the automotive industry. Gestão & Produção, 27(1), e3800.
- Diabat, A., Govindan, K., & Panicker, V.V. (2012). Supply chain risk management and its mitigation in a food industry. International Journal of Production Research, 50(16), 3039-3050.
- Economic Outlook Report (2019). Deloitte Thailand. Retrieved from https://www2.deloitte.com/content/dam/Deloitte/th/Documents/about-deloitte/th-about-economic-outlook-1h-2019.pdf.
- Florian, G.L., & Constangioara, A. (2014). The impact of risks in supply chain on organizational performances: Evidence from Romania. Economia Seria Management, 17(2), 265-275.
- Infor (2012). Risks and opportunities in the new automotive industry. Retrieved from https://godlan.com/wp-content/uploads/2019/09/Executive-Brief-Risks-and-opportunities-in-the-new-automotive-industry-white-paper-download-Godlan.pdf.
- Jiang, B., Baker, R.C., & Frazier, G.V. (2009). An analysis of job dissatisfaction and turnover to reduce global supply chain risk: Evidence from China. Journal of Operations Management, 27(2), 169-184.
- Lotfi, H.F., & Fallahnejad, R. (2010). Imprecise Shannon’s entropy and multi attribute decision making. Entropy, 12(1), 53-62.
- Madani, M., & Jermsittiparsert, K. (2019). A conceptual and empirical model of supply chain risk management model in Indonesian SMEs. Humanities and Social Sciences Reviews, 7(3), 703-710.
- Maikaew, P. (2019). Automotive industry at a turning point. Retrieved from https://www.bangkokpost.com/auto/news/1606570/automotive-industry-at-a-turning-point.
- Makwana, A.H., & Pitroda, J. (2017). Factors affecting risk management for construction by analytic hierarchy process. Journal of Structural Technology, 2(1), 1-7.
- Manuj, I., & Mentzer, J.T. (2008). Global supply chain risk management. Journal of Business Logistics, 29(1), 133-155.
- Milani, A.S., Shanian, A., Madoliat, R., & Nemes, J.A. (2005). The effect of normalization norms in multiple attribute decision making models: A case study in gear material selection. Industrial Applications 29(4), 312-318.
- Mohtasham, K., Aziz, F.A., & Ariffin, M.K.A. (2015). Vendor selection risk management framework in automotive. Industry International Journal of Mechanical Engineering and Applications, 3(3-1), 57-66.
- Munyuko, C.W. (2015). Effects of supply chain risk management on organization performance: Case of Andy Forwarders services limited. International Journal of Academic Research in Business and Social Sciences, 5(3), 380-403.
- Neiger, D., Rotaru, K., & Churilov, L. (2009). Supply chain risk identification with value-focused process engineering. Journal of Operations Management, 27, 154-168.
- Roszkowska, E. (2011). Multi-criteria decision making models by applying the TOPSIS method to crisp and interval data. Multiple Criteria Decision Making, 6, 200-230.
- Sasha, S., Delkhosh, A., Ghassemi, P., & Wiktorsson, M. (2013). Supply chain risks: An automotive case study. Proceedings of the 11th International Conference on Manufacturing Research (ICMR2013). Retrieved from https://www.researchgate.net/publication/304381649.
- Samvedi, A., Jain, V., & Chan, F.T.S. (2013). Quantifying risks in a supply chain through integration of fuzzy AHP and fuzzy TOPSIS. International Journal of Production Research, 51(8), 2433-2442.
- Tang, O., & Musa, S.N. (2011). Identifying risk issues and research advancements in supply chain risk management. International Journal of Production Economics, 133, 25-34.
- Thongrawd, C., Mee-ngoen, B., & Jermsittiparsert, K. (2019). The supply chain innovation, supply chain transaction cost, supply chain risk and supply chain responsiveness and the supply base and its
- omplexity. International Journal of Supply Chain Management, 8(4), 269-279.
Thun, J., & Hoenig, D. (2011). An empirical analysis of supply chain risk management in the german automotive industry. International Journal of Production Economics, 131, 242-249. - Tzeng, G.H., & Huang, J.J. (2011). Multiple attribute decision making: Methods and applications. New York: CRC Press.
- Wang, E., Alp, N., Shi, J., Wang, C., Zhang, X., & Chen, H. (2017). Multi-criteria building energy performance benchmarking through variable clustering-based compromise TOPSIS with objective entropy weighting. Energy, 125, 197-210.
- Walker, H., Brenchley, R., & Harland, C. (2003). Risk in supply networks. Journal in Purchasing and Supply Management, 9(2), 51-62.
- Waters, D. (2007). Supply chain risk management: Vulnerability and resilience in logistics. London: Kogan Page.