Research Article: 2018 Vol: 22 Issue: 2
Successful Implementation of Koreas ODA Projects: Constructing Causal Loops and Conducting Sensitivity Analysis
Hak-Sil Kim, Chungbuk National University
Abstract
This paper aims to comprehend the policy variables underlying Official Development Assistance (ODA) projects conducted by the Korean Government from a systems point of view; to identify the causal loops (reinforcing and balancing loops) operating within the causal map explaining the whole process of the ODA projects; and to derive the main policy variables affecting the successful management of ODA projects, with regard especially to the projects being provided by the Korean Government, using the sensitivity analysis method. The paper employs the system dynamics method, which has rarely been used in the analysis of ODA projects. The analysis results show that there are six causal loops (four reinforcing and two balancing) operating within the whole causal map explaining the ODA projects executed by the Korean Government; and that a public body for controlling and managing Korea’s ODA projects (called control tower in this analysis) deserves special emphasis in constructing ODA-projects-related policies.
Keywords
ODA, System Dynamics, Sensitivity Analysis, Causal Loops.
Introduction
Since Korea first started to undertake Official Development Assistance (ODA) in 1987, the country has been striving to shore up its commitment by focusing on sharing technology and other know-how arising from its own rapid development. Ever since Korea joined the OECD’s Development Assistance Committee (DAC) in 2010, political demands have been soaring for the establishment of “Korean-style” assistance, despite the fact that every developing country needs a different model based on its own characteristics and contexts.
An aid recipient less than two decades ago, Korea is now an aid donor and is sharing its experience of how to use development co-operation as a catalyst for promoting long-term sustainable growth in other countries. In 2017, Korea provided USD 2.2 billion in net ODA, which represented 0.14% of gross national income (GNI) and a 6.5% increase in real terms from 2016. Korea is the twenty-fourth largest DAC provider in terms of its ODA as a percentage of GNI and the fifteenth largest by volume. Korea miss edits ODA/GNI target of 0.25% by 2015 for several reasons: the global economic down-turn, tighter fiscal policy in Korea and a change in the calculation of GNI. It has, however, set a new target of 0.30% ODA/GNI by 2030. To help reach this target, Korea plans to publish an ODA growth plan, with milestones. Korea’s share of untied ODA (excluding administrative costs and in-donor refugee costs) was 53.2% in 2014 (down from 55.1% in 2013), compared to the DAC average of 80.6%.
Nearly thirty years on, officials, scholars and activists are fiercely discussing how to redefine Korea’s ODA model. The topic is expected to deal with the issue of how to successfully implement ODA projects at the site (Conlin and Stirrat, 2008; Engel and Carlsson, 2002; Forss et al., 1994). Against this background, this paper aims to explore the critical variables affecting ODA projects; to construct a map explaining the causal relationships among the variables; to construct reinforcing and balancing causal loop diagrams; and to carry out sensitivity analysis using policy scenarios in order to identify the most important variable affecting cost-effective performance in relation to ODA projects.
Literature Review
Many research works have been produced on ODA studies both in Korea and abroad. Most of these, however, have dealt primarily with issues of fragmentation regarding ODA project implementation, ODA size, ODA effectiveness, etc. (Armytage, 2011; Heider, 2011; Holvoet and Renard, 2007; Martens et al., 2002; Morrissey, 2001; Picciotto, 2003; Prokopijević, 2007; Sasaki, 2006; Sasaki, 2008; Yasin, 2005). It is true that these research works have made significant contributions to ODA studies, but what is more important is how the donor countries can carry out the ODA projects more effectively at the site (Collier, and David, 2000; Cracknell, 2001; O’Sullivan, 2007; Paul et al., 2008). Over time, the amount of ODA has been increasing ever since the OECD’s DAC requested that DAC member countries including Korea should allocate 0.7 % of their GNI to ODA projects. Diverse ODA projects have been developed and in addition the recipient countries have demanded different projects fitted to their own countries (Collier, 2000; Engel and Carlsson, 2002; Kawai and Takagi, 2001; McGillivary, 2004; Paul et al., 2008; Pitt et al., 2010; Ram, 2004; Watanabe, 2003; World Bank, 1998). It is necessary for the donor countries to gain the know-how that is required for successful implementation of ODA projects (Khan, 2003; Kusek and Rist, 2004; Liese and Schubert, 2009; Liverani and Lundgren, 2007). In this regard, it is necessary to research ODA issues using different approaches and different perspectives from those adopted by previous studies. One of these different approaches is the system approach, and more specifically the system dynamics approach. The systems approach to ODA projects ascertains causal relationships among the variables associated with an ODA project, outlines the totality of our knowledge/information about ODA project management through causal loops (reinforcing and balancing loops) and enables us to conduct sensitivity analysis of these loops, providing information about which variable is most sensitive to the dependent variable, ODA outcome in this analysis.
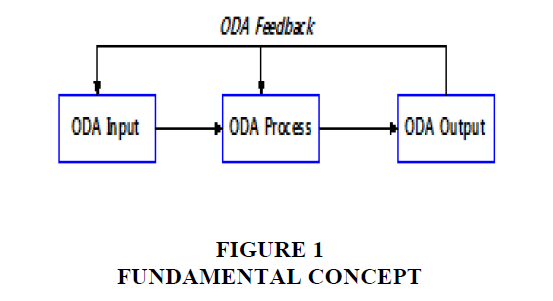
The fundamental concept underlying the systems approach to ODA projects is explained in Figure 1.
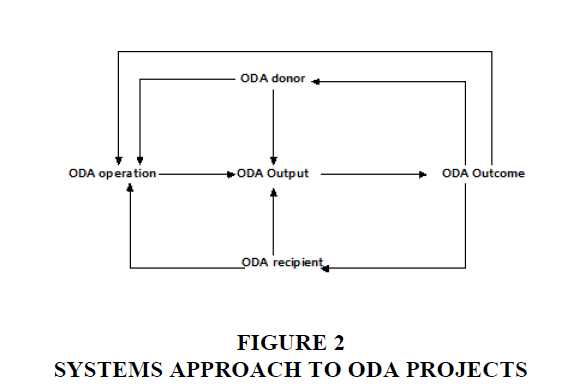
The systems approach to ODA projects is shown in more detail in Figure 2.
It should be added that the system approach can be made concrete and material via the use of the system dynamics method. Also, in this study a computer software program, POWERSIM, was used to apply the system dynamics approach to the analysis. The POWER program was also used.
Causal Maps Explaining The Structure Of Oda Projects And Sensitivity Analysis
Explanations of Variables
In building a causal map explaining the relationships among variables affecting the policy issues regarding ODA projects, it is necessary to consider certain variables in particular. These variables are selected on the basis of the theoretical reviews of existing studies on ODA. Table 1 shows the names of the variables and their explanations.
| Table 1: Explanations Of The Variables Included In The Causal Map | |
| Variable Name | Operational Explanation |
|---|---|
| Sustainability | Degree to which ODA projects can be sustained politically and economically. |
| Monitoring | Degree to which ODA projects can be monitored effectively at the implementation site. |
| Consciousness change | Degree to which the consciousness of the recipient country’s people can be changed towards self-reliance. |
| Country specificity | The specificity which each recipient country has politically, economically and culturally. |
| Predictability | Degree to which the ODA donor country can predict what will happen at the ODA implementation site. |
| After-care programme | Degree to which the ODA donor country makes preparation for after-care programmes after the ODA projects are completed. |
| Fragmentation | Degree to which ODA projects are funded and managed by, and are subject to the decisions of, many fragmented organisations, rather than co-ordinated by one organisation or a small number of organisations. |
| Input resource | Resources allocated to ODA projects. |
| People support | Degree to which ODA projects can be supported politically by ordinary people in the donor country. |
| Risk management | Degree to which ODA projects can be managed to prevent any kind of risks that might be involved. |
| Political leaders’ support | Degree to which ODA projects can be supported politically by the recipient country’s politicians. |
| Recipient central support | Degree to which ODA projects can be supported by the recipient country’s central government. |
| Recipient local support | Degree to which ODA projects can be supported by the recipient country’s local government. |
| Planning validity | Degree to which ODA projects can be planned in a valid way by the ODA donor country. |
| ODA control tower | Degree to which ODA projects can be co-ordinated by one control tower dealing with the projects. |
| NGO support | Degree to which ODA projects can be supported by NGOs in the donor country. |
| Preference for Korean products | Degree to which the recipient country prefers Korean products and goods on the international market in return for provision of ODA projects. |
| Political support for Korea | Degree to which the recipient country supports Korea politically in international relations, such as in the UN or other international arenas. |
| ODA output | The output relation to ODA projects provided to recipient country. |
| Co-operation system | Degree to which ODA projects provided can be implemented in a co-operative way by the recipient country. |
| Recipient corruption | Degree to which the recipient country is corrupt, especially in relation to ODA project implementation. |
| Self-reliance | Degree to which the people of the recipient country are self-reliant, not dependent on other aid. |
| Recipient local leaders | Degree to which ODA projects are acclaimed by the local leaders of the recipient country. |
| Local opinions | Degree to which ODA projects are welcomed by local people in the recipient country. |
| ODA outcome | The outcome produced by ODA projects in the recipient country. |
| Understanding for Korea | Degree to which the people of the recipient country understand Korea as a donor country. |
| Goal attainment | The goal to be achieved by ODA projects. |
| ODA project efficiency | Degree to which ODA projects are efficiently implemented. |
| Central policy | Degree to which ODA projects are properly planned in terms of central policy by the donor country’s government. |
| Parliament | Degree to which ODA projects are supported politically by the donor country’s parliament. |
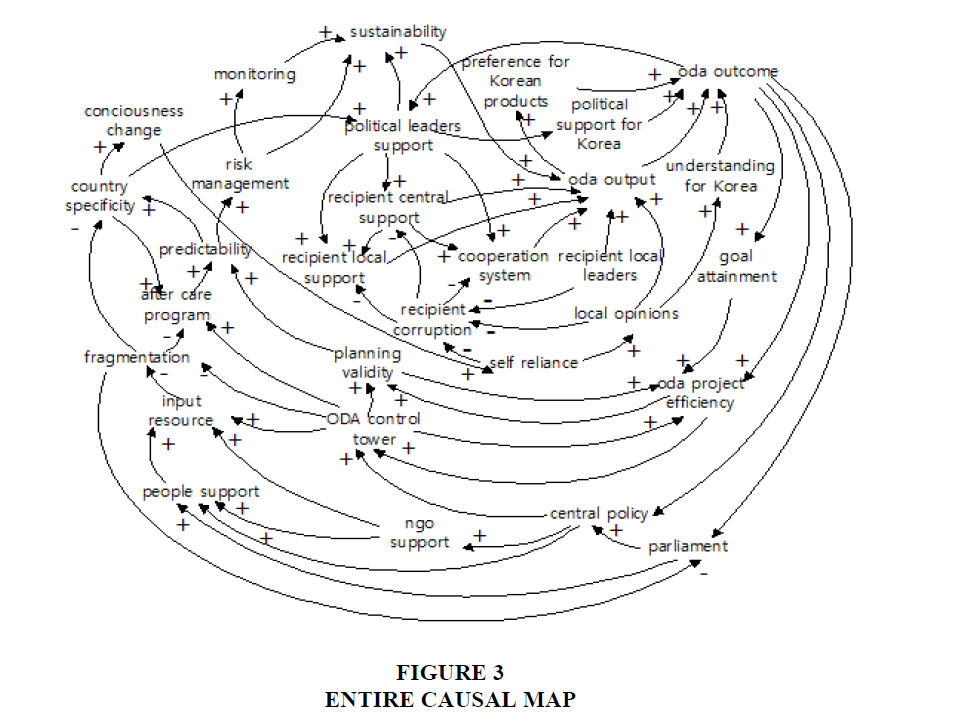
Assuming that ODA projects can be explained from a systems point of view, it is possible for the ODA project process to be depicted via a causal map. Drawing a causal map to explain the whole ODA project process enables us to comprehend the whole picture regarding the process involved in ODA projects and also to discover the relationships among the variables being operated in the ODA system. The causal map comprises reinforcing loops and balancing loops. If we identify the causal loops-reinforcing and balancing loops-we are able to understand the roles they play in the ODA system, and therefore policymakers engaged in ODA projects utilise them to help in attaining the objectives which the ODA projects are expected to achieve.
Drawing the Entire Causal Map
The first step in applying the system dynamics approach to ODA projects is to draw the causal map, including the numerous causal loop diagrams which can explain the relationships among the variables associated with the entire process involved in the ODA projects, ranging from agenda setting to the evaluation of the projects after they have ended.
Causal loop diagrams (CLD) are flexible and useful tools for diagramming the feedback structure of systems in any domain (Sterman, 2000). Causal diagrams are simply maps showing the causal links among variables, with arrows from causes to effects. Causal diagrams emphasise the feedback structure of a system. There are causal diagrams showing the information inputs into a particular decision rule. Policy structure diagrams focus attention on the information cues that the modeller assumes decision-makers use to govern the rates of flow in the system. There are two types of feedback loops, positive and negative. Positive feedback loops are called reinforcing loops and are denoted by a+or R, while negative loops are called balancing loops are denoted by a–or B (Sterman, 2000) (Figure 3).
Reinforcing and Balancing Causal Loops
Here, we need to discover the reinforcing and balancing causal loops on the basis of the entire causal map depicted above.
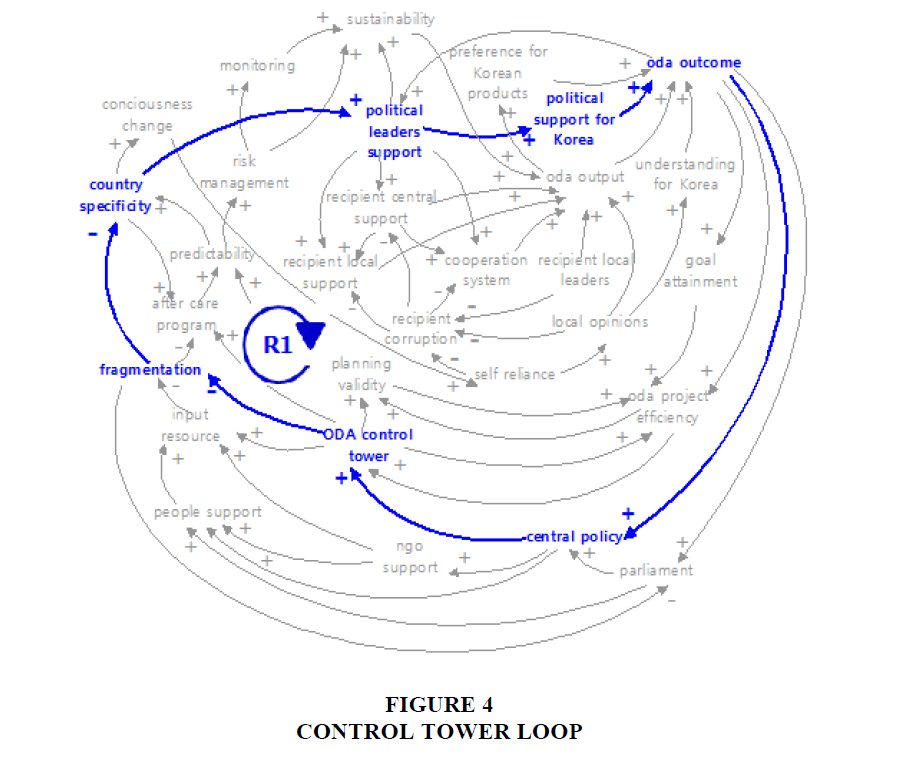
Reinforcing causal loop 1: control tower loop
This control tower loop indicates that if the capacity of the control tower to deal with ODA projects becomes stronger, then the fragmentation problem relating to ODA projects diminishes; in turn, the recipient country’s specificity becomes better reflected in the ODA project process, leading to that country’s political leaders’ support becoming stronger and its political support for Korea increasing, and finally to the ODA outcome becoming stronger (Figure 4).
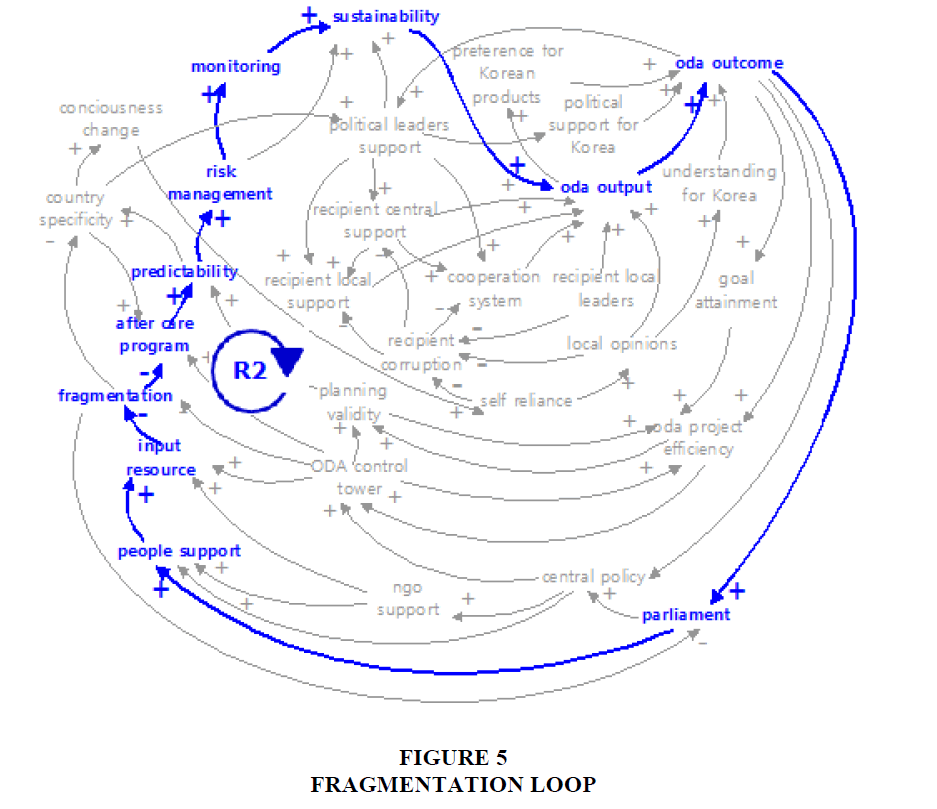
Reinforcing causal loop 2: fragmentation loop
This fragmentation loop indicates that if the fragmentation of the ODA projects gets high, the after-care programme relating to ODA projects gets weaker, and predictability in relation to the ODA projects gets low, leading to a lower level of ordinary people’s support for the projects (Figure 5).
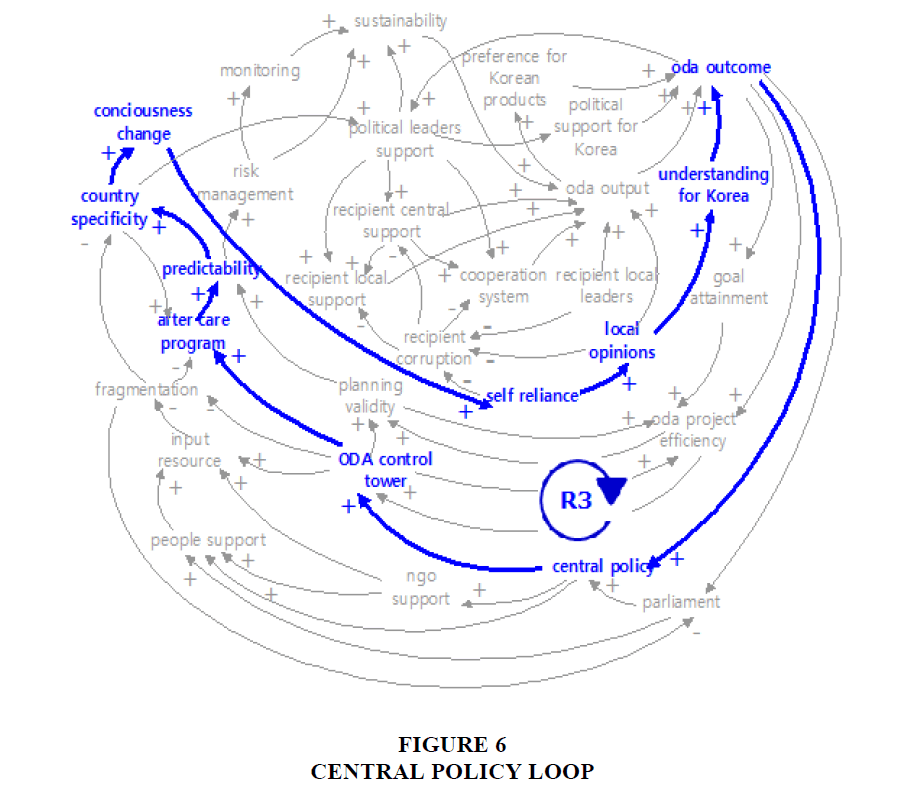
Reinforcing causal loop 3: central policy loop
This central policy loop indicates that if central policy relating to ODA projects is well-designed and-supported, the ODA control tower gets to function well, the after-care programme regarding the ODA projects works well, and the ODA outcome is improved (Figure 6).
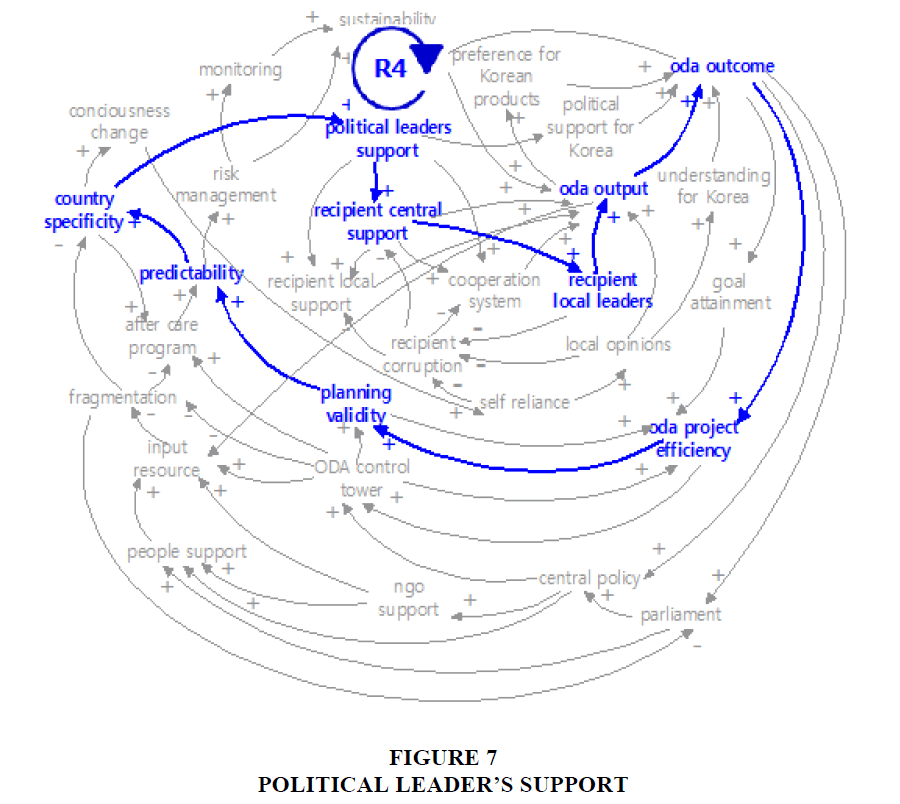
Reinforcing causal loop 4: political leader’s support
This political leaders’ support loop indicates that if the political leaders of the recipient country are more in support of the ODA projects, its central government tends to be more supportive of the projects and so its local leaders also tend to be more supportive and finally, the ODA outcome is improved (Figure 7).
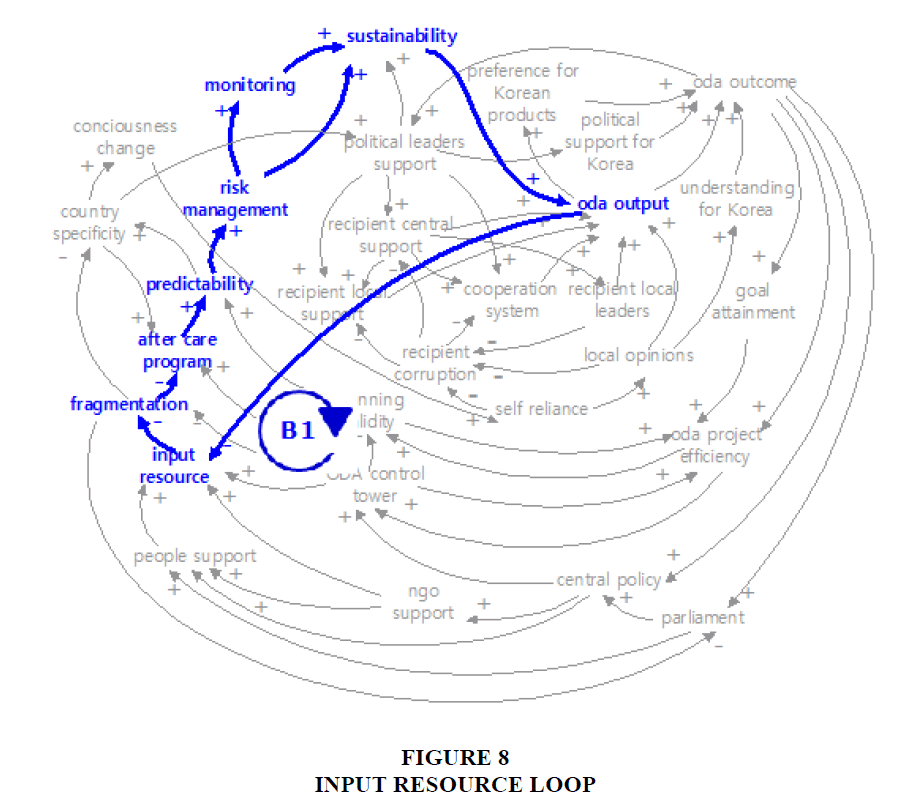
Balancing causal loop 1: input resource loop
This input resource loop indicates that if the input resources relating to the ODA projects improve, then fragmentation relating to the ODA projects decreases, the ODA outcome improves, and, finally, the input resources for the ODA projects can be controlled and balanced (Figure 8).
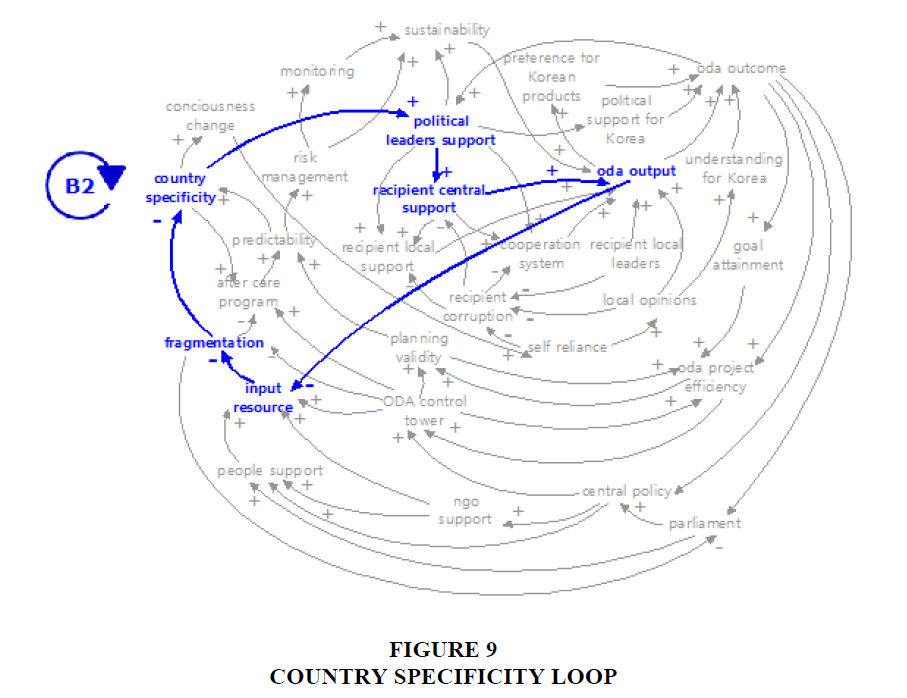
Balancing causal loop 2: country specificity loop
The country specificity loop indicates that if the country’s specificity is well reflected in the ODA project process, then the recipient country’s political leaders support the ODA projects more strongly, ODA outcomes get better, and, finally, the country specificity of the ODA projects becomes controlled and balanced (Figure 9).
Conducting a Sensitivity Analysis
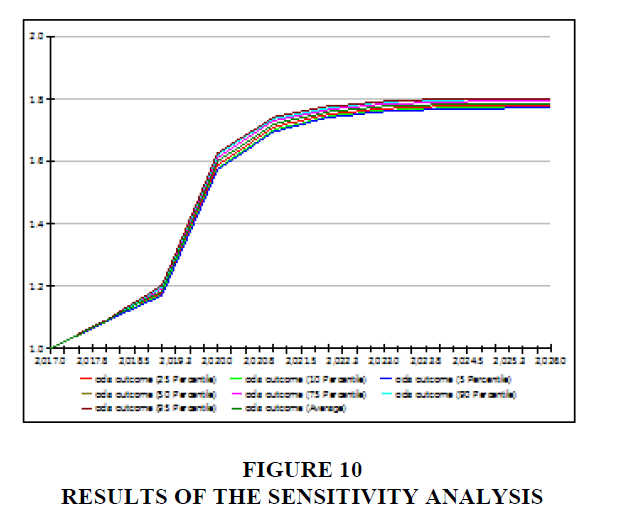
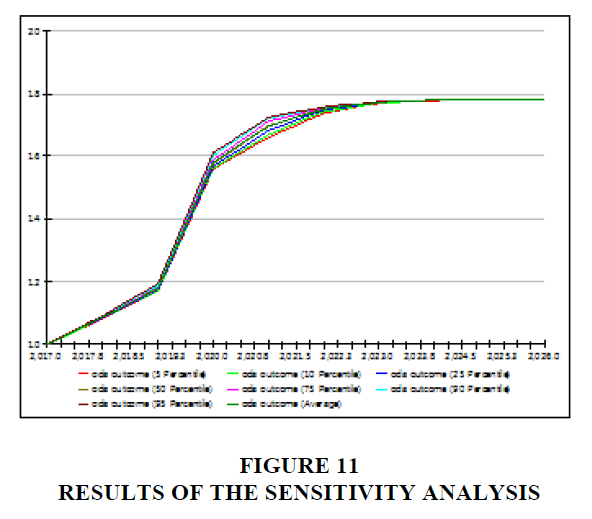
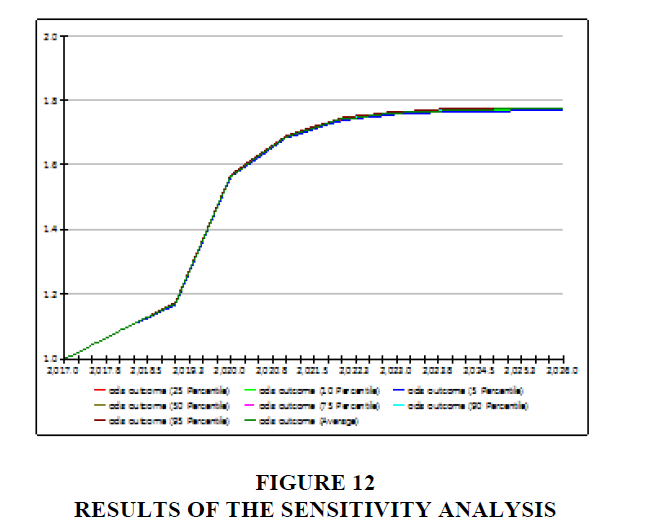
Policy makers and implementers involved in the ODA projects are expected to reinforce or balance the level of the variables relating to the ODA projects using diverse policy measures. It is expected that for this purpose they will properly make use of the policy measures that are available to them. In this connection, it is necessary for them to know in advance which variable is more sensitive in terms of its effect to the final dependent variable, ODA outcome, than any of the other variables. In this circumstance, sensitivity analysis is needed. Here, three theoretically important variables-control tower, monitoring capacity and parliament’s support-are employed in the sensitivity analysis in order to analyse which variable is most sensitive to the final dependent variable, ODA outcome. Here, the term “sensitive” means that the most sensitive specific variable will affect the ODA outcome more strongly than the other variables, even though it changes to a small extent. In other words, the variable which is “sensitive” should be regarded as the most important variable in the ODA project process. In conducting the sensitivity analysis, the Focus Group Interview method was also used, involving five experts on ODA and international relations studies. These experts were asked to discover the graph patterns explaining the causal relationships among the variables involved in the causal map, and also to estimate the coefficients between the variables concerned.
Figures 10-12 shows the results of the sensitivity analysis conducted to identify the most sensitive variable of the three variables included in the analysis. It was found that among the three variables-control tower, monitoring capacity and parliament’s support-control tower was the most sensitive to the final dependent variable, ODA outcome.
The results of the sensitivity analysis imply that policymakers and policy implementers in charge of ODA projects in Korea should pay more attention to the control tower variable in carrying out the ODA projects, and that the control tower system dealing with ODA projects should be improved further.
Conclusion
This paper has attempted to draw a causal map explaining the whole process involved in the Korean ODA projects, in order to identify the causal loops affecting the successful making and implementation of ODA policies of Korea, and to put forward policy suggestions beneficial to the discovery of the most sensitive variable to the final dependent variable, ODA outcome, in the ODA project process. The research results show that four reinforcing causal loops and two balancing causal loops exist in the entire causal map explaining the ODA project; and also that the most sensitive variable in the ODA project processes is the control tower variable, which means the capability of the control tower organisation engaged in the management of the ODA projects being carried out in Korea. This implies that the Korean Government should pay more attention to restructuring the control tower organisation dealing with ODA projects, and should also govern and manage the whole ODA project process in a more systematic way.
Acknowledgement
This work was supported by the Ministry of Education of the Republic of Korea and the National Research Foundation of Korea (NRF-2016S1A5A2A03927173).
References
- Armytage, L. (2011). Evaluating aid: An adolescent domain of practice. Evaluation, 17(3), 261-276.
- Clements, P., Chianca, T., & Sasaki, R. (2008). Reducing world poverty by improving evaluation of development aid. American journal of evaluation, 29(2), 195-214.
- Collier, P., & David, D. (2000). Aid allocation and poverty reduction. European Economic Review, 46(1), 475-500.
- Conlin, S., & Stirrat, R. L. (2008). Current challenges in development evaluation. Evaluation, 14(2), 193-208.
- Cracknell, B.E. (2001). The role of aid evaluation feedback as an input into the learning organization. Evaluation London, 7(1), 132-45.
- Engel, P.G., & Carlsson, C. (2002). Enhancing learning through evaluation: approaches, dilemmas and some possible ways forward. In Annual Conference of the European Evaluation Society Three Movements in Contemporary Evaluation: Learning, Theory and Evidence, Sevilla.
- Forss, K., Cracknell, B., & Samset, K. (1994). Can evaluation help an organization to learn? Evaluation review, 18(5), 574-591.
- Heider, C. (2011). A conceptual framework for developing evaluation capacities: Building on good practice. Influencing Change, 85.
- Holvoet, N., & Renard, R. (2007). Monitoring and evaluation under the PRSP: solid rock or quicksand? Evaluation and Program Planning, 30(1), 66-81.
- Hynes, W., & Scott, S. (2013). The evolution of official development assistance. OECD.
- Kawai, M., & Takagi, S. (2001). Japan’s official development assistance: Recent issues and future directions. World Bank Policy Research Working Paper, 2,722.
- Khan, S. (2003). Supplier choice criteria of executing agencies in developing countries. International Journal of Public Sector Management, 16(4), 261-285.
- Kusek, J.Z., & Rist, R.C. (2004). Ten steps to a results-based monitoring and evaluation system: A handbook for development practitioners. World Bank Publications.
- Liese, B.H., & Schubert, L. (2009). Official development assistance for health-how neglected are neglected tropical diseases? An analysis of health financing. International Health, 1(2), 141-147.
- Liverani, A., & Lundgren, H.E. (2007). Evaluation systems in development aid agencies and analysis of DAC peer reviews 1996-2004. Evaluation, 13(2), 241-256.
- McGillivary, M. (2004). Descriptive and perspective analyses of aid. International Review of Economics and Finance, 13, 275-292.
- Morrissey, O. (2001). Does aid increase growth? Progress in Development Studies, 1(1), 37-50.
- O’Sullivan, K. (2007). Biafra toilsome: The evolution of Irish government policy on official development assistance,1969-1975. Irish Studies in International Affairs, 91-107.
- Picciotto, R. (2003). International trends and development evaluation: the need for ideas. American Journal of Evaluation, 24(2), 227-234.
- Pitt, C., Greco, G., Powell-Jackson, T., & Mills, A. (2010). Countdown to 2015: Assessment of official development assistance to maternal, new-born, and child health, 2003-2008. The Lancet, 376(1), 485-496.
- Prokopijević, M. (2007). Why foreign aid fails. Panoeconomicus, 54(1), 29-51.
- Ram, R. (2004). Recipient country’s policies and the effect of foreign aid on economic growth in developing countries: Additional evidence. Journal of international Development, 16(2), 201-211.
- Sterman, J. (2000). Business Dynamics. McGraw-Hill.
- Sasaki, R. (2006). A review of the history and the current practice of aid evaluation. Journal of Multidisciplinary Evaluation, 3(5), 55-88.
- Sasaki, R. (2008). Meta-evaluation by formal evaluation theory of aid evaluation work. Western Michigan University.
- Watanabe, M. (2003). Official development assistance as a catalyst for foreign direct investment and industrial agglomeration. Asian Development Experience, 1, 136-168.
- Yasin, M. (2005). Official development assistance and foreign direct investment flows to Sub‐Saharan Africa. African Development Review, 17(1), 23-40.
- World Bank (1998). Assessing aid: what works, what doesn’t, and why. Oxford University Press for the World Bank.
