Research Article: 2019 Vol: 23 Issue: 1
The Effect of Managerial Ability on a Firms Dividend Policy: Evidence from Korea
Soo Yeon Park, Chung-Ang University
Younghyo Song, Korea University
Abstract
This study examined the effect of managerial ability on a firm’s dividend policy. In addition, this study investigated how the type of manager and their different risk characteristicsrepresented in this study by professional CEOs and owner CEOs-affect the relationship between managerial ability and the firm’s dividend policy. We used 4,593 firm-year observations from the KOSPI for the period 2003–2013, lending our findings considerable power. The results showed that managerial ability was significantly positively associated with a firm’s dividend policy, as proxied by the propensity for dividend payments. Moreover, the positive relationship between managerial ability and dividend payments was particularly pronounced in firms with professional CEOs. These results suggest that professional CEOs strengthen the positive effect of managerial ability on increased dividend payments.
Keywords
Managerial Ability, Dividend Policy, Professional CEO, Owner CEO, DEA Analysis.
Introduction
The purpose of this study is to analyse the effect of managerial ability on a firm’s dividend policy. It also aims to investigate how different types of manager and their associated risk characteristics e.g., a professional manager vs. an owner-manager-affect the relationship between managerial ability and the firm’s dividend policy.
Managers play an important role in corporate decision-making, including setting strategies for operations, investment, and financing. As such, their characteristics, including their personality, accumulated experience, status and ability, are known to have a potential impact on their firm’s final strategic choices (Bertrand & Schoar, 2003; Mason & Hambrick, 1984).
Depending on the characteristics of managers, each firm makes different decisions about its investment activity or dividend policy. In Korea, managers tend to have a particularly powerful influence on their firms because there is no clear distinction between ownership and management, particularly compared to other developed countries where ownership and management are more clearly separated.
Dividend policy is a major component of corporate strategic planning. Managers use dividends to deliver positive information regarding their firm’s future prospects to the market (Miller & Rock, 1985). While the determinants of a particular corporate dividend policy can be divided into manager-firm and environment-specific factors, most previous studies have focused only on the latter two groups. Managers play a key role in determining the internal dividend policy pursued by a firm, but this influence has been underestimated and overlooked in prior research. As such, the present study investigates the relationship between managerial ability and dividend policy. Moreover, given that the risk preferences of managers can affect the choice of dividend policy (Caliskan & Doukas, 2015) and that this risk preference has been shown to vary depending on manager type (Amihud & Lev, 1981; Mintzberg & Waters, 1982), we also empirically analysed the impact of managerial ability on dividend policy decisions for different manager types.
High-ability managers are assumed to have better knowledge of their company and the shareholders that they are dealing with than their lower-ability counterparts do, while also being more sensitive to the environment in which they operate (Demerjian et al., 2013). In particular, the higher the manager's ability, the greater their ability to judge and estimate future performance (Baik et al., 2011) and thus the higher the quality of their earnings (Demerjian et al., 2013). Therefore, managers with high ability may use dividends as an effective way to signal to investors their firm’s future prospects in terms of profit and/or value. In accordance with this view, managerial ability and a firm’s propensity for dividend payments are assumed to be positively related.
Problems in Korea's traditional ownership control structure became apparent in the aftermath of the 1997 IMF foreign exchange crisis, leading to a gradual shift toward a professional CEO system. Professional CEOs tend to be more risk-averse than owner CEOs (Amihud & Lev, 1981; Mintzberg & Waters, 1982), and it has been reported that risk-averse CEOs have a higher propensity to pay dividends than do risk-seeking CEOs (Caliskan & Doukas, 2015). Therefore, using manager type as a measure of risk preference following Choi & Bae (2011), we investigate whether firms with professional CEOs exhibit a stronger positive relationship between managerial ability and the propensity for dividend payments.
In this study, we used the measure of managerial ability suggested by Demerjian et al. (2012). Here, managerial ability is defined as the residual of an enterprise efficiency measure compared with companies in the same industry after removing the effects of firm-specific characteristics using Tobit regression (Demerjian et al., 2012). This measure of managerial ability is more direct than the proxies for management skill used in previous analyses, such as experience, educational background, and managerial performance, because it assumes that highly skilled managers are able to generate greater revenue for a given resource level. In addition, following Oh et al. (2010), we defined representative directors as CEOs and classified them as either owner CEOs if they were also the largest shareholder or professional CEOs if they were not.
By analysing 4,593 firm-year observations from companies listed on the KOSPI for the period 2003-2013, we found that managerial ability was significantly positively associated with a firm’s propensity for dividend payments, suggesting that managers with a higher ability level tend to pay dividends to signal their greater ability to produce and maintain their firm’s performance. It was also found that the positive relationship between managerial ability and the likelihood of dividend payments was stronger in firms with professional CEOs, possibly due to their lower risk tolerance and their desire to maintain their reputation and focus on short-term performance.
This study contributes to the current literature in several ways. First, we offer further information on the determinants of dividend policy; in particular, our empirical results shed light on the role of managerial ability in influencing a firm’s propensity for dividend payments. Second, we extended the research on the determinants of dividend policy by empirically proving that managers with higher ability lead to a higher possibility of dividend payments. This indicates that managerial characteristics, especially managerial ability, can affect the capital market as a whole. Third, while previous studies have mainly examined the relationship between managerial ability and accounting information, this study differs in that it examines whether managerial ability influences dividend policy in the capital market. The results of this study thus suggest that managerial ability can be important information for capital market participants. Lastly, it is meaningful that the type of managers such as owner CEOs and professional CEOs affects dividend policy differently according to the risk preference of each type.
The remainder of this paper is organized as follows. Section 2 reviews prior research and develops our hypotheses, while Section 3 describes the sample and research models. In Section 4, we explain the results of our empirical analysis, and Section 5 presents the conclusion.
Literature Review And Hypothesis Development
Along with investment and financing policy, a firm’s approach to dividend payments is an important financial decision. Dividends are often used as a means of returning a portion of a firm’s net profit to its shareholders; as such, they serve as a key barometer for determining a firm’s value, and managers often use dividend payments as a signal of their firm’s future profitability.
Miller & Modigliani (1961) argued that, if a firm’s investment decisions were made in a perfect capital market, the value of the firm would not be affected by its dividend payments. Ensuing research has explored the impact of dividend policy on firm value in relation to a diverse range of market imperfections, including taxes (Kalay & Michaely, 1993; Litzenberger & Ramaswamy, 1979), transaction costs (Del Guercio, 1996), agency costs (Jensen, 1986; Rozeff, 1982) and information asymmetry (Bhattacharya, 1979; Miller & Rock, 1985). Brav et al. (2005) took this line of research one step further by conducting a survey of financial executives and discovered that, in reality, information asymmetry and agency problems are the main determinants of dividend policy. In particular, signalling theory (Bhattacharya, 1979; Miller & Rock, 1985) posits that information asymmetry exists between managers and outside investors, so managers use dividends as a signal to convey private information about their firm’s profitability and future prospects, Accordingly, managers make dividend decisions-such as whether to pay dividends and what their size should be-based on their assessment of the firm’s long-term sustainable earnings. This means that firms may increase dividends only when their future profitability is expected to be good. Conversely, firms with poor future prospects may choose not to increase dividends in the present because a cut in future dividends may negatively impact firm value.
Managerial characteristics are known to have a significant effect on firm performance in general. For example, in an empirical analysis, Bertrand & Schoar (2003) examined the effect of individual managers on corporate behaviour and performance and found that manager-specific effects have a significant influence on corporate financial decisions. They thus concluded that the investment, financial, and organizational practices of a firm are heavily affected by its managers. Other studies have explored the positive association between managerial ability and the quality and persistence of earnings. For instance, Demerjian et al. (2013) asserted that superior managers are more knowledgeable about their business and exhibit better judgment and make more accurate estimates; thus, their firms produce higher-quality earnings. Similarly, Libby & Luft (1993) found that high-ability managers are more knowledgeable about their firms and their industry and are better able to synthesize information into reliable forward-looking estimates, resulting in higher-quality earnings. Another study by Demerjian et al. (2012) explored the association between managerial ability and earnings quality (which was measured based on earnings restatements, the persistence of earnings, errors in bad debt provision, and the extent to which accruals mapped onto cash flows) and found a positive relationship. Demerjian et al. (2017) also examined whether managerial ability affected the likelihood of earnings distortion via income smoothing and earnings management and concluded that high-ability managers can take advantage of their superior judgment and estimate to smooth earnings and commit financial fraud.
Managers are the final decision-makers for a firm’s business activities. In making these decisions, the accuracy of their judgment depends on their managerial ability, and dividend policy represents one such decision. Based on the previous research outlined above, this study explored the effect of managerial ability on a firm’s dividend policy. Considering that the quality of earnings produced by superior managers is high due to their accurate judgment and accrual estimates (Demerjian et al., 2012), that managers use dividends as a market signal regarding a firm’s profitability and future prospects (Miller & Rock, 1985) and that managers are reluctant to cut dividends (Lintner, 1956), we expect that high ability managers would offer more dividends. Therefore, we propose the following hypothesis:
H1: Managerial ability is positively associated with the propensity for dividend payments
It has also been reported that risk-averse CEOs have a higher propensity to pay dividends than do risk-seeking CEOs (Caliskan & Doukas, 2015). In the relationship between risk and dividend policy, prior studies have argued that firm risk is negatively associated with dividend payments (DeAngelo et al., 2006; Grullon et al., 2002; Hoberg & Prabhala, 2009). In addition, Redding (1998) reported that the demand for dividends is positively related to investor risk aversion. In Korea, as a response to the IMF foreign exchange crisis in 1997, there were strong calls for changes to the ownership structure, focusing on the separation of ownership and management, which was identified as the main cause of the economic crisis. These attitudes have also influenced decision-making in choosing the CEO of a corporation, with professional managers increasingly preferred. Amihud & Lev (1981); Mintzberg & Waters (1982) have suggested that professional CEOs tend to be more risk-averse than owner CEOs because they have the incentive to avoid investments that are too risky and require effort due to moral hazard. In line with this, we posit that the association between dividend policy and managerial ability will depend on the risk preference characteristics of different types of manager. In particular, the positive relationship between managerial ability and the propensity for dividend payments would be stronger for professional CEOs due to their risk-averse characteristics. This leads to the following hypothesis:
H2: The positive relationship between managerial ability and the propensity for dividend payments is stronger in firms with professional CEOs.
Research Methodology
Sample and Data
Our sample consisted of KOSPI-listed companies between 2003 and 2014, leading to a total of 4,593 firm-years for empirical analysis. Financial data were extracted from the TS-2000 database from the Korea Listed Companies Association, with other variables taken from the KIS Value and Fn-Guide databases. Following previous literature, we excluded financial institutions, firms with a fiscal year-end outside of December, and companies with missing data to improve the consistency of the sample. All continuous variables were winsorized at the top and bottom one-percentile of the pooled data to avoid the influence of extreme outliers and possible data errors. Table 1 presents the distribution of the sample firms by year. As shown in Panel A in Table 1, approximately 72% of the sample firms periodically paid dividends, with a relatively even distribution by year over the sample period. Panel B in Tables 1 A & B presents the industry distribution of the sample. It shows that most companies (68.43%) were in the manufacturing industry.
| Table 1A: Sample Distribution | |||
| PANEL A. YEAR DISTRIBUTION | |||
| Year | No. of firms | No. of firms with dividend payments | Percentage of dividend payments (%) |
| 2003 | 293 | 227 | 77.47 |
| 2004 | 327 | 249 | 76.15 |
| 2005 | 342 | 261 | 76.32 |
| 2006 | 350 | 267 | 76.29 |
| 2007 | 366 | 275 | 75.14 |
| 2008 | 364 | 253 | 69.51 |
| 2009 | 375 | 266 | 70.93 |
| 2010 | 412 | 306 | 74.27 |
| 2011 | 420 | 296 | 70.48 |
| 2012 | 441 | 295 | 66.89 |
| 2013 | 449 | 296 | 65.92 |
| 2014 | 454 | 306 | 67.4 |
| Total | 4,593 | 3,297 | 71.78 |
| Table 1B: Sample Distribution | ||
| PANEL B. INDUSTRY DISTRIBUTION | ||
| Industry | Frequency | Percent |
| Manufacturing | 3,143 | 68.43 |
| Electricity, gas, steam, and water supply | 85 | 1.85 |
| Construction | 276 | 6.01 |
| Wholesale and retail trade | 411 | 8.95 |
| Transportation | 46 | 1 |
| Information and communication | 76 | 1.65 |
| Real estate activities | 437 | 9.51 |
| Professional, scientific, and technical activities | 119 | 2.59 |
| Total | 4,593 | 100 |
Measurement of Managerial Ability
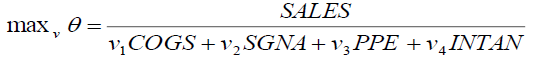
To measure managerial ability, we exploit the Data Envelopment Analysis (DEA) model developed by Demerjian et al. (2012). The underlying assumption is that managers with high ability generate a higher rate of output from limited resources or use fewer resources to produce the same level of output.
Following Demerjian et al. (2012), the managerial ability measure was constructed using a two-step approach. The first step was calculating the efficient frontier, which takes into account each firm’s revenue and combination of resources within the same industry using DEA. We then calculated the efficiency score for each firm. The maximum efficiency score was 1, and the minimum 0. The efficiency score for a firm within the efficient frontier was 1. Following Ko et al. (2013), we compared the relative efficiency of firms in the same industry and year.
The DEA model used to calculate firm efficiency is presented as Equation 1:
 (1)
(1)
The variables in this model are defined below:
SALES=Operating revenue.
COGS=Cost of goods sold.
SGNA=Sales and general administrative expenses.
PPE=Tangible assets (except land, trees, construction in progress, and assets in transit).
INTAN=Intangible assets.
The DEA-based efficiency score is limited in that the influence of firm-specific factors, such as RET and ROA, is not considered. For example, managers with mid-level ability working at a large company can have greater bargaining power when negotiating with their suppliers than high-ability managers at a small company. Thus, to control for firm-specific factors related to managerial ability, Demerjian et al. (2012) used Tobit regression. If firm-specific factors are removed from the calculation of the total efficiency of a firm in this way, a measure of managerial ability, i.e., the unexplained component of total firm efficiency, can be obtained. To extract the efficiency attributed to managers, we performed Tobit regression analysis including year-fixed effects and examined the resulting residuals.
The model used to measure managerial ability using Tobit regression is presented as Equation 2:
 (2)
(2)
The variables in this model are defined below:
FIRMEFFICIENCY=Firm efficiency as measured by DEA.
SIZE=The natural log of total assets.
MS=Firm revenue/total industry revenue.
FCF=1 if free cash flow (i.e., net income before depreciation-change in operating capital-capital expenditure)>0 or 0 otherwise.
AGE=Natural log of [the number of years the firm has been listed+1].
BUSEG=The number of business departments.
FCI=The absolute magnitude of foreign currency translation accounts, which is calculated as the sum of foreign currency gains, foreign currency translation losses, gains from foreign currency transactions, and losses from foreign currency transactions divided by total revenue.
Since Demerjian et al. (2012) first suggested their measure of managerial ability, extensive research on managerial ability has been undertaken (Baik et al., 2011; Demerjian et al., 2013; Ko et al., 2013). Baik et al. (2011) found that, as managerial ability increased, the frequency of management earnings forecasts also increased. They showed that high-ability managers estimated earnings more accurately than did low-ability managers and that the market responded more sensitively to the earnings forecasts of firms with high-ability manager firms. Demerjian et al. (2013) found that managers with high ability mitigated the negative effects of earnings management, while Ko et al. (2013) presented empirical evidence of the positive association between managerial ability and firm performance using data from Korean firms using Demerjian et al. (2012) methodology.
Owner CEOs and Professional CEOs
In this study, we defined CEOs to be those managers in the position of representative director. We classified CEOs as either owner CEOs (i.e., those who are also the majority shareholder) or professional CEOs (those who are not majority shareholders; Oh et al. 2010). In cases where a firm had more than two representative directors, we looked at the highest-ranking director, and if multiple directors had the same rank, we used their shareholding ratio to classify their hierarchy.
Empirical Methodology and Variable Definitions
To explore the association between managerial ability and a firm’s dividend policy, we built the following empirical model using the propensity for dividend payments as a proxy for the dividend policy.
 (3)
(3)
The variables in this model are defined below:
DIV_D t=1 if a firm pays dividends in year t, and 0 otherwise.
MA t=Managerial ability calculated in year t based on Demerjian et al. (2012).
SIZE t=The logarithm of total asset value of a firm in year t.
LEV t=Firm leverage measure as the ratio of total liabilities to total assets in year t.
ROA t=Operating income divided by total assets in year t.
FCF t=Free cash flow in year t.
FRN t=The percentage of equity ownership by foreign investors in year t.
MB t=Market value divided by total equity in year t.
TURN t =Increase in monthly turnover rate year on year in year t.
LIST t=The logarithm of listed years of a firm in year t.
GROWTH t=Sales revenue growth in year t.
DIV_Dt was employed as a dependent variable, and managerial ability (MAt) was applied as the main independent variable for testing the hypotheses.
We controlled for other determinants known to affect dividend policy that have been proposed and tested in previous research. SIZEt was included in the model because the larger the size of an entity, the lower the transaction costs associated with issuing securities, meaning it is more likely to increase dividends through external funds (Crutchley & Hansen, 1989; Fama & French, 2001; Smith, 1977). When a firm accrues a liability, the need for dividends as a monitoring mechanism is reduced (Jensen & Meckling, 1976; Jensen, 1986; Stulz, 1988), thus LEVt was included in the model. Chang & Dutta (2012) showed that operating performance was positively related to dividend payments, so profitability, measured by return on assets (ROAt), was controlled for in the model. Free cash flow also has an impact on dividend policy, so FCFt was included. Foreign investors prefer investment returns such as dividends to exercising management rights, so the foreign ownership ratio is positively associated with the dividend levels (Allen et al., 2000), leading to the inclusion of FRN t. The liquidity of the stock market has a negative effect on dividend levels (Miller & Modigliani, 1961), so TURNt was included in the model. We also controlled for MBt and LISTt because Grullon et al. (2002) suggested that corporate risk and life cycle have an impact on dividend payouts. Growth opportunity is negatively related to dividend payments (Fama & French, 2001), so GROWTHt, the sales revenue growth rate, was controlled for. Finally, year and industry indicators were included to control for time and industry-fixed effects.
Results And Discussion
Descriptive Statistics
Table 2 shows the descriptive statistics of the main variables used in our empirical analysis. The mean and median values of MAt were 0.002 and -0.001, respectively. These values are similar to the estimates reported by Lee et al. (2015); Park & Jung (2017), who also used data from Korean firms. The mean value of the dividend payment, DIV_Dt, was 0.718, suggesting that 71.8% of firms periodically paid dividends over the study period, which is comparable to figures reported in the Korea Exchange report for 2013. The mean firm size, as measured by the natural logarithm value of the total assets (SIZEt) and LEVt, the ratio of total liabilities to total assets, were 17.226 and 0.430, respectively, comparable to the results reported by Park et al. (2018). The average firm in our sample had a ROAt of 0.028. The mean value of foreign ownership (FRNt) was 0.104, indicating that foreign investors owned an average of 10.5% of a firm’s total equity. The mean value of MBt, the growth rate indicator, was 1.062, demonstrating that the assets of the sample companies had market values that were similar to their book values. The mean value of GROWTHt was 0.144, which is similar to the estimates presented in Kim et al. (2010). The mean value of PROFt, used as an indicator of manager type, was 0.284, which indicates that 28.4% of the sample had professional CEOs.
| Table 2: Descriptive Statistics (N=4,593) | |||||||
| Variable | Mean | Standard deviation | Min | First quartile |
Median | Third quartile |
Max |
| MAt | 0.002 | 0.086 | -0.227 | -0.041 | -0.001 | 0.042 | 0.303 |
| DIV_Dt | 0.718 | 0.45 | 0 | 0 | 1 | 1 | 1 |
| SIZEt | 17.226 | 0.661 | 16.138 | 16.664 | 17.208 | 17.779 | 18.4 |
| LEVt | 0.43 | 0.195 | 0.031 | 0.281 | 0.439 | 0.573 | 0.885 |
| ROAt | 0.028 | 0.078 | -0.382 | 0.011 | 0.036 | 0.066 | 0.183 |
| FCFt | 0.034 | 0.446 | -1.717 | -0.066 | 0.028 | 0.133 | 2.283 |
| FRNt | 0.104 | 0.141 | 0 | 0.006 | 0.04 | 0.148 | 0.652 |
| MBt | 1.062 | 0.901 | 0.164 | 0.501 | 0.79 | 1.286 | 5.497 |
| TURNt | 2.09 | 3.923 | 0.022 | 0.212 | 0.8 | 2.126 | 26.9 |
| LISTt | 2.785 | 0.76 | 0.693 | 2.398 | 2.944 | 3.401 | 3.871 |
| GROWTHt | 0.144 | 0.876 | -0.887 | -0.046 | 0.049 | 0.147 | 6.801 |
| PROFt | 0.284 | 0.451 | 0 | 0 | 0 | 1 | 1 |
Note: This table presents descriptive statistics of the mean, median, and distributions of the main variables used in this paper. All variables were winsorized at the top and bottom one percentile of the pooled data. DIV_Dt is 1 if a firm pays dividends in year t and zero otherwise; MAt is the managerial ability calculated in year t by Demerjian et al. (2012); SIZEt is the logarithm of the total asset value of a firm in year t; LEVt is a firm leverage measure calculated as the ratio of total liabilities to total assets in year t; ROAt is the operating income divided by total assets in year t; FCFt is the free cash flow in year t; FRN t is the percentage of equity ownership by foreign investors; MBt is the market value divided by the total equity in year t; TURNt is the turnover ratio in year t; LISTt is the logarithm of the listed years of a firm in year t; GROWTHt is the sales revenue growth in year t; PROFt is 1 if a firm has a professional CEO in year t and 0 otherwise.
Tables 3 A & B reports the Pearson correlation coefficients between the variables of interest in our model. The propensity for dividend payments (DIV_Dt) had a significantly positive association with the indicator for managerial ability, MAt, indicating that the higher the ability of managers, the more likely the firm is to pay dividends. Similar to previous research, DIV_Dt was positively correlated with ROAt and FRNt and negatively associated with LEVt, TURNt, MBt, and GROWTHt. However, it is not possible to draw a firm conclusion on the effect of the variables on the correlation between managerial ability and dividend policy based simply on this correlation analysis. Therefore, the other variables employed in the research model were controlled for, and the results are reported in the next section.
| Table 3A: Pearson Correlation Between Variables Of Interest (N=4,593) | ||||||
| Variable | MAt | DIV_Dt | SIZ t | LEVt | ROAt | FCFt |
| MAt | 1 | 0.193*** | 0.015 | -0.076*** | 0.342*** | 0.011 |
| DIV_Dt | 1 | 0.001 | -0.315*** | 0.526*** | -0.021 | |
| SIZEt | 1 | -0.011 | 0.015 | -0.023 | ||
| LEVt | 1 | -0.323*** | -0.001 | |||
| ROAt | 1 | -0.021 | ||||
| FCFt | 1 | |||||
| FRNt | ||||||
| MBt | ||||||
| TURNt | ||||||
| LISTt | ||||||
| GROWTHt | ||||||
| PROFt | ||||||
| Table 3B: Pearson Correlation Between Variables Of Interest (N=4,593) | ||||||
| Variable | FRNt | MBt | TURNt | LISTt | GROWTHt | PROFt |
| MAt | 0.026* | -0.024 | -0.035** | 0.012 | -0.008 | -0.001 |
| DIV_Dt | 0.247*** | -0.078*** | -0.250*** | -0.067*** | -0.032** | -0.085*** |
| SIZEt | 0.015 | -0.014 | 0.01 | 0.021 | -0.029** | -0.015 |
| LEVt | -0.145*** | 0.131*** | 0.102*** | 0.016 | 0.021 | 0.030** |
| ROAt | 0.247*** | -0.015 | -0.193*** | -0.076*** | -0.049*** | -0.072*** |
| FCFt | 0.004 | -0.025** | 0.007 | 0.01 | 0.034** | 0.004 |
| FRNt | 1 | 0.202*** | -0.157*** | -0.004 | -0.024 | -0.034** |
| MBt | 1 | 0.121*** | -0.074*** | 0.002 | 0.006 | |
| TURNt | 1 | 0.009 | 0.008 | 0.059*** | ||
| LISTt | 1 | -0.013 | 0.02 | |||
| GROWTHt | 1 | 0.014 | ||||
| PROFt | 1 | |||||
Note: This table presents the Pearson correlation between the propensity for dividend payments, managerial ability, and other control variables. Refer to Table 2 for variable definitions. P-values are in parentheses. ***, ** and * denote a significance level (two-tailed) at 1%, 5%, and 10% or less, respectively.
Table 4 presents the logistics regression results for the association between managerial ability and dividend policy after controlling for other known determinants of the propensity for dividend payments. MAt had a positive coefficient and was significant at the 1% level, suggesting that the presence of higher-ability managers increases the probability of dividend payments. This suggests that managers with higher ability have the incentive to use dividends as a signal of their firm’s future profits and/or value and thus prefer to pay more dividends.
| Table 4: Effect Of Managerial Ability On Dividend Policy | ||
| Variables | DIV_Dt | |
| Estimate | Wald χ2 value | |
| Intercept | 1.804 | 2.402 |
| MAt | 1.203 | 4.404** |
| SIZEt | -0.007 | 0.013 |
| LEVt | -1.691 | 44.345*** |
| ROAt | 31.222 | 454.003*** |
| FCFt | -0.225 | 5.329** |
| FRNt | 4.001 | 75.824*** |
| MBt | -0.477 | 69.396*** |
| TURNt | -0.1 | 76.227*** |
| LISTt | -0.129 | 4.848** |
| GROWTHt | 0.02 | 0.146 |
| Industry dummies | Included | |
| Year dummies | Included | |
| Observations | 4,593 | |
Note: This table presents the logistics regression analysis results of the impact of managerial ability on a firm’s dividend policy using the propensity for dividend payments. *, **, ***denote significance at the 10%, 5%, and 1% levels, respectively. Refer to Table 2 for variable definitions.
Of the control variables, we found that the coefficients for LEVt, MBt, and TURNt were negatively significant, whereas the coefficients for ROAt were significantly positive, which are similar findings to those reported by Jensen & Meckling (1976) and Chang & Dutta (2012). Unlike previous studies where it was found that the higher the free cash flow, the higher the propensity for dividend payments, FCFt had significantly negative coefficients. In a more transparent disclosure environment where agency costs are lower, firms pay larger dividends (La Porta et al., 2000). The greater the free cash flow, the higher the agency costs and the lower the disclosure quality. From this perspective, it is understandable that free cash flow was found to be negatively associated with dividend payments.
Table 5 presents the impact of the risk preference of managers on the positive association between managerial ability and the propensity to pay dividends. To investigate the effects of the risk preferences of managers on the relationship between managerial ability and dividend payments, we used the manager type as a proxy for risk preference (Choi & Bae, 2011). We divided the sample firms into two subsamples-an owner CEO group and a professional CEO group-and re-ran the regression model. The results shown in Table 5 indicate that the coefficient for MAt was only significant and positive for the professional CEO group. This suggests that the positive association between managerial ability and the propensity for paying dividends is strengthened when firms have a professional CEO due to their risk-aversion tendency.
| Table 5 : Subsample Analysis By Manager Type Of The Effect Of Managerial Ability On Dividend Policy | ||||||
| Variable | Professional CEO | Owner CEO | ||||
| Estimate | Wald χ2 value | Estimate | Wald χ2 value | |||
| Intercept | 4.089 | 3.423 | * | 1.116 | 0.638 | |
| MAt | 2.616 | 5.533 | ** | 0.826 | 1.454 | |
| SIZEt | -0.15 | 1.461 | 0.044 | 0.308 | ||
| LEVt | -1.484 | 9.229 | *** | -1.915 | 38.979 | *** |
| ROAt | 35.324 | 148.384 | *** | 29.588 | 298.581 | *** |
| FCFt | -0.22 | 1.447 | -0.239 | 4.062 | ** | |
| FRNt | 7.281 | 43.824 | *** | 2.992 | 34.864 | *** |
| MBt | -0.526 | 19.511 | *** | -0.461 | 48.705 | *** |
| TURNt | -0.118 | 34.685 | *** | -0.089 | 39.065 | *** |
| LISTt | -0.287 | 6.201 | ** | -0.054 | 0.598 | |
| GROWTHt | 0.081 | 0.65 | -0.01 | 0.026 | ||
| Industry | Included | |||||
| Year | Included | |||||
| Observations | 1,304 | 3,289 | ||||
Note: This table presents the subsample test results based on the types of manager regarding the relationship between managerial ability and the firm’s dividend policy using the propensity for dividend payments. *, **, ***denote significance at the 10%, 5%, and 1% levels, respectively. Refer to Table 2 for variable definitions.
Robustness Tests for Endogeneity
Our main analysis suggests a positive association between managerial ability and dividend payments. One concern regarding the analysis of dividend decisions is that an empirical model could be subject to potential reverse causality and simultaneity. For example, firms with large dividend payments are more likely to seek managers with high ability. Following Jiraporn et al. (2014), we conducted two-Stage Least-Squares (2SLS) regression analysis to mitigate this potential endogeneity. We used the average managerial ability within the same industry as an instrumental variable. In the first stage, we estimated managerial ability (MAt) using the average managerial score (AVG_MAt) and other control variables. In the second stage, we included the instrumental values of MA from the first stage as independent variables in the regression. Table 6 reports the results of the 2SLS regression. We found that managerial ability (MAt) had a significant and positive relationship with average managerial ability (AVG_MAt) at the 1% level. In the second stage, the relationship between managerial ability and dividend payments was still significantly positive, suggesting that managers with high ability lead to a higher probability of dividend payments, which is consistent with the main results in Table 6.
| Table 6: Results Of Logistics Regression Analysis Of The Effect Of Managerial Ability On Dividend Policy With Two-Stage Least-Squares (2sls) Regression | |||
| Panel A: Regression Results for the First Stage | |||
| MAt | |||
| Estimate | t-value | ||
| Intercept | 0.004 | 0.16 | |
| AVG_MAt | 0.997 | 80.57 | *** |
| SIZEt | 0 | 0.05 | |
| LEVt | 0 | 0 | |
| MBt | -0.002 | -2.44 | ** |
| Industry | Included | ||
| Year | Included | ||
| Adjusted R2 | 58.99% | ||
| Panel B. Regression Results for the Second Stage | |||
| Variables | DIV_Dt | ||
| Estimate | Wald χ2 value | ||
| Intercept | 1.84 | 2.485 | |
| MAt | 3.311 | 22.031*** | |
| SIZEt | -0.01 | 0.023 | |
| LEVt | -1.713 | 45.295*** | |
| ROAt | 30.931 | 464.369*** | |
| FCFt | -0.219 | 5.091** | |
| FRNt | 4.006 | 76.026*** | |
| MBt | -0.457 | 62.780*** | |
| TURNt | -0.101 | 76.660*** | |
| LISTt | -0.134 | 5.230** | |
| GROWTHt | 0.016 | 0.088 | |
| Industry dummies | Included | ||
| Year dummies | Included | ||
| Observations | 4,593 | ||
This table represents the results of 2SLS regression. *, **, ***denote significance at the 10%, 5%, and 1% levels, respectively. Refer to Table 2 for variable definitions.
By examining 4,593 firm-years in Korea between 2003 and 2013, we explored how managerial ability influences a firm’s dividend policy. Using the DEA method suggested by Demerjian et al. (2012) to measure managerial ability and the propensity for dividend payments, we examined the association between managerial ability and dividend policy by conducting an empirical analysis. We also considered the effect of manager type (i.e., owner CEO or professional CEO) as a measure of risk preference following Choi & Bae (2011).
Conclusion
In general, we found that managers with high ability were associated with a higher propensity for dividend payments. We conjecture that high-ability managers use dividends to relay to the market private information regarding their greater ability and stronger incentive to generate higher earnings quality. We also found that firms with professional CEOs exhibited a significantly stronger positive relationship between managerial ability and dividend payments. This indicates that professional CEOs strengthen the positive effect of managerial ability on increased dividend payments due to their lower risk tolerance.
This study contributes to both the managerial ability and the dividend policy literature. In this study, we explored the unique role of managerial ability as a determinant of dividend policy and provided evidence of the effect of the risk preference characteristics of two manager types (i.e., owner CEOs and professional CEOs) on the relationship between managerial ability and dividend policy. We also used a sophisticated method to measure managerial ability to investigate a new determinant of the propensity for dividend payments.
References
- Allen, F., Bernardo, A.E., & Welch, I. (2000). A theory of dividends based on tax clienteles. The Journal of Finance, 55(6), 2499-2536.
- Amihud, Y., & Lev, B. (1981). Risk reduction as a managerial motive for conglomerate mergers. Bell Journal of Economics, 12(2), 605-617.
- Baik, B., Farber, D., & Lee, S. (2011). CEO ability and management earnings forecasts. Contemporary Accounting Research, 28(5), 1645-1668.
- Bertrand, M., & Schoar, A. (2003). Managing with style: The effect of managers on firm policies. The Quarterly Journal of Economics, 118(4), 1169-1208.
- Bhattacharya, S. (1979). Imperfect information, dividend policy and the bird in the hand fallacy. Bell Journal of Economics, 10(1), 259-270.
- Brav, A., Graham, J.R., Harvey, C.R., & Michaely, R. (2005). Payout policy in the 21st century. Journal of Financial Economics, 77(3), 483-527.
- Caliskan, D., & Doukas, J.A. (2015). CEO risk preferences and dividend policy decisions. Journal of Corporate Finance, 35, 18-42.
- Chang, B., & Dutta, S. (2012). Dividends and corporate governance: Canadian evidence. The IUP Journal of Applied Finance, 18(4), 5-30.
- Choi, U., & Bae, H. (2011). A study on the effect of the separation of ownership and management on manager’s risk preference. Korean Journal of Accounting, 20(3), 213-230.
- Crutchley, H. (1989). A test of the agency theory of managerial ownership, corporate leverage and corporate dividends. Financial Management, 18(4), 36-76.
- DeAngelo, H., DeAngelo, L., & Stulz, R.M. (2006). Dividend policy and the earned/contributed capital mix: A test of the life-cycle theory. Journal of Financial Economics, 81(2), 227-254.
- Del Guercio, D. (1996). The distorting effect of the prudent-man laws on institutional equity investments. Journal of Financial Economics, 40 (1), 31-62.
- Demerjian, P., Lev, B., & McVay, S. (2012). Quantifying managerial ability: A new measure and validity tests. Management Science, 58(7), 1229-1248.
- Demerjian, P., Lev, B., Lewis, M.F., & McVay, S. (2013). Managerial ability and earnings quality. The Accounting Review, 88(2), 463-498.
- Demerjian, P.R., Lewis-Western, M.F., & McVay, S. (2017). How does intentional earnings smoothing vary with managerial ability? Working Paper.
- Fama, E.F., & French, K. (2001). Disappearing dividends: Changing firm characteristics or lower propensity to pay? Journal of Financial Economics, 60(1), 3-43.
- Grullon, G., Michaely, R., & Swaminathan, B. (2002). Are dividend changes a sign of firm maturity? Journal of Business, 75(3), 387-424.
- Hoberg, G., & Prabhala, N.R. (2009). Disappearing dividends, catering and risk. Review of Financial Studies, 22(1), 79-116.
- Jensen, M.C. (1986). Agency costs of free cash flow, corporate finance and takeovers. American Economic Review, 76(2), 323-329.
- Jensen, M.C., & Meckling, W.H. (1976). Theory of the firm: Managerial behavior, agency costs and ownership structure. Journal of Financial Economics, 3(4), 350-360.
- Jiraporn, P., Jiraporn, N., Boeprasert, A., & Chang, K. (2014). Does corporate social responsibility (CSR) improve credit ratings? Evidence from geographic identification. Financial Management, 43(3), 505-513.
- Kalay, A., & Michaely, R. (1993). Dividends and taxes: A re-examination. Working Paper.
- Kim, B.G., Kim, D.W., & Kim, D.H. (2010). Information asymmetry and dividend policy: The consequences of dividend signaling hypothesis. The Korean Journal of Financial Engineering, 9(1), 99-124.
- Ko, C.Y., Park, J.H., Jung, H., & Yoo, K.H. (2013). A study on the effects of managerial ability by DEA on firm performance. Korean Journal of Management Accounting Research, 13, 165-200.
- La Porta, R., Lopez-de-Silanes, F., Shleifer, A., & Vishny, R. (2000). Agency problems and dividend policies around the world. Journal of Finance, 55(1), 1-33.
- Libby, R., & Luft, J. (1993). Determinants of judgment performance in accounting settings: Ability, knowledge, motivation, and environment. Accounting, Organizations and Society, 18(5), 425-450.
- Lintner, J. (1956). Distribution of incomes of corporations among dividends, retained earnings, and taxes. The American Economic Review, 46(2), 97-113.
- Litzenberger, R.H., & Ramaswamy, K. (1979). The effect of personal taxes and dividends on capital asset prices: Theory and empirical evidence. Journal of Financial Economics, 7(2), 163-195.
- Mason, P.A., & Hambrick, D.C. (1984). Upper echelons: The organization as a reflection of its top managers. The Academy of Management Review, 9(2), 193-206.
- Miller, M.H., & Modigliani, F. (1961). Dividend policy, growth, and the valuation of shares. The Journal of Business, 34(4), 411-433.
- Miller, M.H., & Rock, K. (1985). Dividend policy under asymmetric information. The Journal of Finance, 40(4), 1031-1051.
- Mintzberg, H. & Waters, J.A. (1982). Tracking strategy in an entrepreneurial firm. Academy of Management Journal, 25(3), 465-499.
- Oh, O.R., Lee. Y.K., & Kong, K.T. (2010). The effects of CEO turnover and corporate ownership structure on the value relevance of accounting information. Journal of Taxation and Accounting, 11(4), 305-322.
- Park, S.Y., & Jung, H. (2017). The effect of managerial ability on future stock price crash risk: Evidence from Korea. Sustainability, 9(12), 23-34.
- Park, S.Y., Moon, B.Y., & Chae, S.J. (2018). The effect of disclosure quality on dividend policy: Evidence from unfaithful disclosure designated firms. Accounting Information Review, 36(3), 129-147.
- Redding, L.S. (1998). Can risk aversion explain the demand for dividends? Working Paper.
- Rozeff, M. (1982). Growth, beta and agency costs as determinants of dividend payout ratios. Journal of Financial Research, 5(3), 249-259.
- Smith, C. (1977). Alternative methods for raising capital: Rights versus underwritten offerings. Journal of Financial Economics, 5(3), 273-307.
- Stulz, R.M. (1990). Managerial discretion and optimal financing policies. Journal of Financial Economics, 26, 3-27.