Research Article: 2020 Vol: 26 Issue: 5
The Impact of Renewable, Nonrenewable Energy and Energy Efficiency In Environmental Quality of Tunisia
Saoussen Aguir Bargaoui, Tunis Elmanar University, Tunisia
Souhir Amri Amamou Higher Institute of Management of Tunis, Tunisia
Abstract
Due to its geographical situation, Tunisia experience climate risks such as desertification risks, coast degradation in one hand and scarcity of his resources in the other hand. In this context, Tunisia initiated a strategy toward the development of renewable energies and encouragement of energy efficient technologies adoption. The aim of this paper is to analyze the impact of these two adopted strategies on CO2 emissions, which represents the most important Greenhouse Gas component. To this end, we used the impulse response function technique during the period 1971-2014 and found that GDP and nonrenewable energy dynamically enhance and energy efficiency and renewable energy decrease emissions levels.
Keywords
Impulse response function, renewable energy, nonrenewable energy, energy efficiency, CO2 emissions
JEL Classifications
Q28; Q38;Q56;Q58;O13
Introduction
Tunisia is experiencing resources scarcity and degradation of his environmental situation owing to climate change problem. Indeed, this situation is characterized by water resources limitation in quantity and in quality, risks of degradation of the coast and of land submergence with consequences on socioeconomic activities, and threatened ecosystems with desertification…
Several researchers stressed on the fact that climate change is due to natural resources overexploitation and the use of fossil fuel which represents a pollution source. Tunisia presents a particular environmental vulnerability situation due to its geographical situation and its limited natural resources. Really, Tunisian energetic situation is limited by very restricted energetic resources, a decline in energy production in one side and a great increase of energy demand in the other side. In fact, primary energy consumption had more than doubled, from 4.4 Mtoe to 9.5 Mtoe, over the period 1990-2018. At the same time, primary energy production fell from 5.4 Mtoe to 4.6 Mtoe. This divergence between energy production and national demand for hydrocarbons revealed a deficit in the primary energy balance which reached 49% in 2018 against 15% in 2010 (GIZ, 2019). Otherwise, at the end of 2018, the electricity production fleet reached an installed capacity of 5,476MW. Then, electricity production increased from 12091GWh in 2005 to18988 GWh in 2018, registering an average annual growth rate of 4%, GIZ (2019). The sector is characterized by a significant growth in the annual consumption peak, which requires the mobilization of significant investments for the construction of new conventional power stations in order to meet this growth in peak demand.
This energy dependence imposes on Tunisia major challenges linked to the security of its energy supply and the competitiveness of its economy.
In order to meet this deficit, government had increased his imports of energy products that increasingly affect the situation of the national trade balance and the country's foreign exchange earnings. Tunisia is confronted with a multidimensional challenge which requires a vision based on energy security, equity and sustainable development.
Aware of this situation, Tunisia adopted an energy transition policy in 2014 aiming to reduce its primary energy consumption by 30% compared to the trend scenario, by 2030 and a share of renewable energies in the production of 30% electricity over the same horizon. To achieve these objectives, Tunisia has adopted a number of measures, including: The creation of the Energy Transition Fund in 2014, the promulgation of the law relating to the production of electricity from renewable energies in 2015.
In fact, Tunisia has significant renewable energy resources, especially in terms of solar and wind energy. In fact, the Tunisian National Energy Management Agency (NEMA) estimates that the exploitable potential of photovoltaic in Tunisia at several hundred giga watts. The average global horizontal radiation is around 1850 kWh / m2, which translates into an average annual production Solar Photovoltaic Systems of the order of 1650 kWh / kWp. Regarding wind energy, Tunisia has a significant wind deposit according to the Wind Atlas produced by the NEMA. Indeed, the potential of wind power is estimated at 8000 MW. For other applications, the strategic study on renewable energies estimates the potential for the use of solar water heaters in Tunisia at 3.5 million m² of collectors and the solar Photovoltaic capacity that can be installed for pumping water intended for the irrigation at 24 MW by 2030. Despite the importance of these resources, the exploitation of renewable energies remains limited until the end of 2018.
In the other hand, Tunisia used energy efficiency to fight against the energy deficit problem. Specific actions to energy efficiency concern program contracts in the industrial, tertiary and transport sectors and cogeneration. To enhance investments in the rational use of energy, NEMA and the Energy Transition Fund have led several actions in this direction since their creation. During the 2005-2010 periods, these actions resulted in an energy saving estimated at 2700 Ktoe, of which 91% is due to energy efficiency actions which also contribute in CO2 emissions reduction by 6500KteCO2, Chebil (2017).
Considering the energetic situation, climatic vulnerability and the engagement of the country in an energy strategy, we consider the study of the contribution of renewable energies and the energetic efficiency led by the country as being of crucial importance to assess this strategy and be able to adjust or improve it if necessary to encounter the problem of climate change.
In this context, the objective of this paper is to explore the relationship between CO2 emissions, energy efficiency, renewable, nonrenewable energy and the GDP in the Tunisian context; to evaluate the impact of his environmental strategy and to give to decision makers an idea about the outcome of the adopted strategy to guide future strategies toward most successful ones.
To respond to this problem we organized the paper as follows: Section 2 presents a brief literature review. Section 3 exposes the used methodology and data. Section 4 discusses empirical results and Section 5 concludes.
Literature Review
Economic growth increase national incomes significantly and unequally across countries. It is true that this economic prosperity contributes to human, social and economic well-being but current researches demonstrate that his outcomes on human societies and environment are unsustainable. Decoupling the benefits of economic activity from its costs is essential to reconfigure human activity on the path to sustainable development.
In fact, growth model inherited from the twentieth century is not sustainable because of his overuse of natural resources, his social inequality increase and also his responsibility of GHG excess emissions that causes climate changes. To fight against climate change and to expand access to energy, several countries are increasingly aware of the essential roles of renewable energies and energy efficiency. In this context, several studies tried to investigate the relationship between CO2 emissions, affluence, renewable and nonrenewable energy and energy efficiency.
Starting with researches investigating these relations for groups of countries; In fact, Apergis et al. (2010) proved that nuclear energy consumption reduce CO2 emissions while renewable energy consumption does not decrease emissions while studying a group of 19 developed and developing countries for the period 1984–2007 and using panel Granger causality tests.
In addition, and controlling for income and oil prices, Salim & Rafiq (2012) explored the relationship between renewable energy consumption and CO2 emissions using the dynamic OLS and fully modified OLS methods and showed a bidirectional causal relationship between renewable energy consumption and CO2 emissions in the short run for Brazil, China, India and Indonesia.
Using the STIRPAT model for OCDE countries during the period 1980-2011, Shafiei and Salim (2014) demonstrated empirically that nonrenewable energy consumption increases whereas renewable energy consumption decreases CO2 emissions.
In an essay to study the relationship between energy efficiency and CO2 emissions, Aguir Bargaoui et al. (2014) used the GMM estimator and demonstrated that energy efficiency reduces CO2 emissions for the 172 studied countries during 1980-2010.
Using the FMOLS, Al-Mulali et al. (2015) studied the influence of several renewable electricity production sources on CO2 emissions through 23 European countries for the period 1990–2013. Authors found that renewable electricity that is obtained from combustible renewables and waste, nuclear power and hydroelectricity impacted CO2 emission in the long run, however, renewable energy obtained from solar and wind powers is insignificant.
By applying the panel fixed effect model approach for the G20 countries during the period 2000 to 2013, Heryadi & Hartono (2016) showed that energy efficiency and renewable energy reduce emissions and that population and per capita income increase carbon emissions.
In an essay to generalize finding to greater number of countries and using an unbalanced panel data of 128 countries during 1990–2014, Dong et al. (2019) found that a 1% increase in renewable energy entails 0.4497% reduction in CO2 emissions with the AMG estimator, while a 1% growth in renewable energy causes a decline of 0.5832% in CO2 emissions with the CCEMG estimator.
Several researchers had presented some essays to study the same relationships at country level. In fact, Menyah & Wolde-Rufael (2010) found a unidirectional causality from CO2 emissions to renewable energy consumption over the period from 1960 to 2007 for the United States. However and using the ARDL model to study the effect of the real income, renewable and nonrenewable energy consumption on carbon dioxide emissions for the United States of America for the period 1980–2014, Dogan & Ozturk (2017) demonstrated that rises in renewable energy consumption mitigate environmental degradation while growths in nonrenewable energy consumption caused higher emissions in the long-run.
Hossain (2012) proved that energy consumption increase environmental pollution, but economic growth hasn’t a significant impact on environmental quality in the long-run in Japan during the period of 1960−2009.
Using the autoregressive distributed lags (ARDL) approach for the period of 1971– 2011, Ali et al. (2016) examined the dynamic impact of urbanization, economic growth, energy consumption, and trade openness on CO2 emissions of Nigeria and found that economic growth and energy consumption enhance significantly CO2 emissions.
Bento & Moutinho (2016) studied the Italian context and found that CO2 emissions are linked to renewable electricity production in the long run.
For the Chinese context, renewable energy consumption can reduce CO2 emissions for the period 1965-2016 as demonstrated by Dong, et al. (2018).
In addition, Zhang (2019) showed that total fossil energy, total urban population, and nuclear energy of total energy use are also prominent influencing factors of carbon emission of on China from 1971 to 2014.
Similarly, Sarkodie et al. (2020) demonstrated that fossil fuel energy consumption enhance emissions however the instantaneous growth in renewable energy and income level decrease emissions by studying the Chinese economy during 1961 -2016.
Bélaïd & Youssef (2017) used the vector error correction model (VECM) Granger causality technique indicates that renewable energy improves environmental quality of Algeria.
For the Tunisian context, only few studies are interested to the study of the CO2 emissions drivers. Among them, Belloumi (2009) how studied the causal relationship between per capita energy consumption and per capita gross domestic product for Tunisia during the period 1971–2004 using the vector error correction model (VECM). Results showed that energy consumption granger causes GDP in the short run and that there is a long-run bidirectional causal relationship between the two variables indicating that Tunisian economy is energy dependent. For this reason, Tunisia is confronted to the obligation to make a transition from a fossil fuel to a renewable energy based economy. Actually, Tunisia is adopting an energetic strategy based in these two policies to contribute to the world effort to fight against climate change.
The study of the outcomes of energy conservation and renewable energy in Tunisian emissions was conducted by Jammali & Liouane (2017) how analyzed the determinants of emissions in Tunisia during the period 1970-2015 using the Autoregressive Distributed Lag model (ARDL) developed by Pesaran et al. (2001). Results showed that in Tunisia, investment in energy efficiency contributed significantly to the minimization of CO2 emissions. Likewise, the granger causality test showed the existence of a significant positive causality between emissions and renewable electricity and energy intensity. The causality between GDP per capita and energy intensity is bidirectional and significant.
Since Tunisia is one of the countries which are concerned not only with the problem of climate change but also energy dependence, we consider that the study of the determinant of emissions in Tunisia and the role of the promotion of energy efficiency and renewable energy in emission reduction in Tunisia is crucial to guide policy makers in the definition of energetic strategy of the country. Our contribution consists in the determination of the causality relationship between the proportion of renewable, nonrenewable energy, energy efficiency and CO2 emissions in the Tunisian context during the period 1971-2014 since the only research that focused on this relationship namely Jammali & Liouane (2017) studied the role of renewable electricity and energy intensity.
Methodology and Data
Tunisian context
Tunisian emissions had known a growth pattern during more than fourteen years. Greenhouse gas emissions increased also but in a more pronounced cadence in Figure 1.

Figure 1 CO2 Emissions and GHG in Tunisia
(Data source: World development indicators (WDI))
Conscious of the environmental issue, Tunisia has been committed for several years to participate in the mitigation of climate change. In fact, the Tunisian government has ratified all international treaties and protocols concerning climate change, including the UNFCCC which was ratified by Tunisia in July 1993 and the Kyoto Protocol in January 2003.
In addition, the current Tunisian energy context is characterized by an energy deficit and a heavy state subsidy granted to fossil energy. In fact, Energy production played an important role in Tunisian economic growth until the mid-1980s. This situation was inverted following the drop in oil production combined with the rapid increase in national demand for energy products and the consumption of electricity which widened the energy deficit and increased our dependence on energy imports. The first deficit in the energy balance was recorded in 1994 which was resolved by multiplying the Algerian-Italian gas pipeline in 1995. The continuous increase in demand concomitantly with the drop in production led to a return to the energy deficit around 1999 which continues until now as shown in Figure 2.

Figure 2 Tunisian Annual Total Primary Energy Production and Demand
(Data source: Tunisian Ministry of Industry, Energy and Mines)
Aware of its energy and climate situation, Tunisia is urgently engaged in the development of a new mode of economic production more respectful of the environment through the promotion of energy efficiency and renewable energies. From an energy efficiency point of view, the main pillars of the national energy efficiency program on which the investments are based are the Energy Control Law and the Energy Transition Fund (FTE). The aim of this national strategy is to avoid waste in the use of energy, both in terms of production and consumption.
Indeed, the ambitious Tunisian energy efficiency program included ambitious actions covering all sectorial themes as well as other areas such as cogeneration, thermal insulation of the building, energy certification of household appliances, energy efficiency in lighting, etc. The evolution of GDP per unit of energy use shows a slight upward trend as showed by Figure 3.

Figure 3 Evolution Energetic Efficiency in Tunisia
(Data source: World development indicators (WDI))
According to the Arab Energy Future Index1 (AFEX), Tunisia is the first Arab country in terms of energy efficiency, followed by Jordan (2nd rank), Morocco (3rd rank), Algeria (7th rank) and Egypt (9th rank).
Concerning Tunisian renewable energy potential, Tunisia has very favorable climatic conditions for the large-scale development of solar Photovoltaic and concentrated solar thermal that can be considered as promising source for improving the energy balance and protecting the environment. The same reflection for wind energy. In fact, Tunisia have a significant wind resource which is estimated by STEG (2014) at the order of 8000 MW (wind speed> 6m / s).
However, as we can remark from Figure 4, the share of renewable energy represents around 12% of total energy use in Tunisia that denotes a very low proportion compared to its production potential.

Figure 4 Share of Nonrenewable and Renewable Energy in Total Energy
(Data source: World development indicators (WDI))
According to the publication of NEMA (2015), the installed renewable energy capacity is modest and breaks down as follows: 245 MW wind energy, 65 MW hydro and 20 MW of photovoltaic.
Tunisia is ranked 6th behind Morocco, Jordan, United Arab Emirates, Egypt and Palestine according to the "AFEX 2015" index established by the regional center for renewable energy and energy efficiency. Thus, despite the great Tunisian potential of renewable energy; economic, technical, financial, regulatory obstacles, renewable energies high costs represent some obstacles faced by the country.
To achieve the renewable energy transition, country must render renewable energy more cost effective since its production is very expensive by granting its production, new projects funding and markets restitution.
After analyzing Tunisian energetic situation and adopted efforts to its amelioration, the second step is to analyze the incidence of the adopted strategies in addition to economic growth on the quality of the environment in this country.
Data Description
To study the relationship between CO2 emissions, renewable energy consumption, nonrenewable energy consumption, energy efficiency and GDP per capita, we use annual data for Tunisia covering the period from 1971 to 2014. CO2 emissions designed emissions stemming from the burning of fossil fuels and the manufacture of cement. They include carbon dioxide produced during consumption of solid, liquid, and gas fuels and gas flaring in kilotons. Energy efficiency is measured as GDP per unit of energy use is the PPP GDP per kilogram of oil equivalent of energy use. Nonrenewable energy consumption is measured as the percentage of fossil fuel in total energy consumption (Fossil fuel comprises coal, oil, petroleum, and natural gas products). Renewable energy consumption is approximated by renewable energy consumption as a percentage of total final energy consumption.
The data for CO2 emissions, energy efficiency, renewable and non-renewable energy sourced from the United States Energy Information Administration and those concerning GDP are taken from World Bank Database.
Empirical Results
First Step: Unit Root Test
The first conducted test is the unit root test of stationary time series. Results are summarized in Table 1.
| Table 1 Unit Root Test and Descriptive Statistics | |||||
| CO2 emissions | Fossil fuels | GDP | Renewable Energy | Energy Efficiency | |
| Mean | 15692.26 | 85.1361 | 2650.416 | 0.5681 | 5.8684 |
| Median | 15612.25 | 86.5207 | 2388.586 | 1 | 9.5769 |
| Skewness | 0.1271 | -1.6873 | 0.5509 | -0.2752 | -0.2461 |
| Kurtosis | 1.8917 | 4.969 | 2.0246 | 1.0757 | 1.1004 |
| ADF results | 0.9904 | 0.0002 | 0.9957 | 0.6963 | 0.7663 |
| Result in first difference | Not stationary | Stationary | Not stationary | Not stationary | Not stationary |
| Result in second difference | Stationary | Stationary | Stationary | Stationary | |
Results indicate that fossil fuel is stationary at level while CO2 emission, GDP per capita, renewable energy and energy efficiency are stationary only at the first difference.
Consequently, a co integration risk between the variables belonging to the same order of integration is probable. Thus, unit root test enabled us to detect the co integration possibility between the variables, which can induce a correction with the VEC model proposed at this level.
Second Step: Johanson test
Our model is as follows:
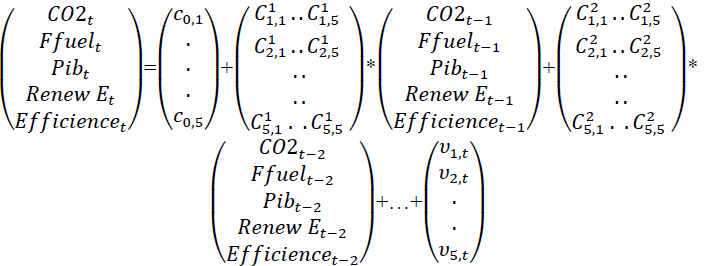
In our study framework, we opt for a VAR model with K = 5 variables and p = n. For the choice of P, we use the information criteria: Schwarz information criterion and Hannan-Quinn information criterion for a p ranging from 1 to 5. The results are presented in the following Table 2.
| Table 2 Results of Information Criteria | ||
| Schwarz information criterion | Hannan-Quinn information criterion | |
| 1 | 41.88130 | 41.74454 |
| 2 | 34.54811* | 33.72758* |
| 3 | 35.85125 | 34.34695 |
| 4 | 36.73945 | 34.55137 |
| 5 | 36.95128 | 34.07942 |
These criteria indicates a delay p = 2. Thus, we retain a VAR model (2). This method, based on the work of Engle and Granger (1987), allows us to consider only a single co integrating relationship. To overcome this problem, we opt for the Johansen test supporting a multivariate approach to co integration based on the maximum likelihood method. This method allows us to identify the number of existing relationships between our variables in order to make a choice later between a VAR model and an error correction model in Table 3.
| Table 3 Johanson Test Results | |||
| Trace Test | |||
| Trace Statistic | Critical Value at 5% | Probability | |
| None * | 94.52082 | 69.81889 | 0.0002 |
| At most 1 | 44.98329 | 47.85613 | 0.0908 |
| At most 2 | 22.54114 | 29.79707 | 0.2693 |
| At most 3 | 4.848856 | 15.49471 | 0.8247 |
| At most 4 | 0.001181 | 3.841466 | 0.9718 |
We thus reject the null hypothesis of the absence of co integrating relations at the 5% level.
In contrast, we accept the null hypothesis that there is at most one co integrating relation because the trace statistic is less than the critical value at 5%. Thus, the application of the Johansen test admits the existence of a single co integrating relation.
We can conclude that there is a stable long-term relationship between the different variables tested so we use an error correction model to overcome this problem.
Third Step: Estimation and Validation
Results presented in Table 4 indicate that the coefficients of the long-term relationship are significant. At this level, an application of the Ljung Box test allows us to find that the residues are white noise. Thus, we can therefore validate our model.
| Table 4 Estimation VECM model results | |||||
| Error Correction | D(CO2) | D(FFUEL) | D(RENEWABLE) | D(EFFICIENCY) | D(GDP) |
| Co integration Relationship | -0.010855 [-0.32244] |
-0.000149 [-5.32966] |
0.000109 [0.86011] |
8.61E-05 [1.07889] |
-0.002252 [-0.63285] |
| D(CO2(-1)) | -0.450249 [-2.62647] |
0.000328 [2.30102] |
0.000458 [0.70890] |
0.000188 [0.46164] |
0.006163 [0.34014] |
| D(FFUEL(-1)) | -130.1178 [-0.82388] |
-0.309306 [-2.35631] |
0.041465 [0.06968] |
0.047894 [0.12789] |
-37.50419 [-2.24683] |
| D(RENEWABLE(-1)) | 179.4765 [0.66407] |
0.111678 [0.49715] |
0.201872 [0.19823] |
0.270052 [0.42139] |
33.85989 [1.18538] |
| D(EFFICIENCY(-1)) | -100.1573 [-0.23869] |
-0.177342 [-0.50848] |
-0.302169 [-0.19111] |
-0.403785 [-0.40581] |
-49.11065 [-1.10734] |
| D(GDP(-1)) | 2.400246 [1.57733] |
-0.004205 [-3.32460] |
-0.005151 [-0.89844] |
-0.002311 [-0.64041] |
68.65937 [4.36093] |
| c | 675.0264 [4.53143] |
0.496470 [4.00983] |
0.403972 [0.71972] |
0.330010 [0.93428] |
68.65937 [4.36093] |
This phase of the study is followed by analysis via the impulse response function. This test is based on a dynamic presentation of joint changes between the different variables and is sometimes combined with Granger causality analysis as presented by Kalbaska & Gatkowski (2012) with the objective of detecting the response of a model variable to a shock or to a fluctuation caused by another variable.
This choice is supported by the literature2 considering that the analysis approach via the impulse response function makes it possible to analyze the structural shocks that may affect one variable from another. Some3 even grant this test the preventive power of intervariable evolutions.
In our work’s context, we choose the innovations of the CO2 variable as a vector of impulse so all the other variables present the responses to these innovations.
Fourth Step: Impulse Response Function Analysis
As results of this test, we find that the CO2 variable is sensitive to the fluctuations of GDP emissions. The relationship is therefore dynamic with a positive trend. Consequently, we can conclude that Tunisian economic is harmful to the environment. Then a restructuring of the economic activity is necessary to reduce its impact on the environment.
As for fossil fuel, this variable is positively affected by emissions’ fluctuations. Moreover, the relationship between the two variables remains positive and stable. The positive relation between the fossil fuels, Affluence and CO2 studied variables is supported by Shafiei & Salim (2013); Heryadi & Hartono (2016); Amri (2017) in Figure 5.

Figure 5 Impulse Response Function To CO2 Innovations
Finally, in accordance with our expectations, this test makes possible the detection of a dynamic, immediate and negative relationship of energy efficiency and renewable energy and CO2 emissions level. The negative sign of the relation between energy efficiency and CO2 emissions is supported by Aguir Bargaoui et al. (2014) et Heryadi and Hartono (2016) and that between renewable energy and CO2 emissions is supported by Shafiei & Salim (2013) and Heryadi and Hartono (2016).
Comparisons with other studies dealing with the dynamics of the relations concerning other countries with impulse response functions analysis is not possible since to our knowledge there is no studies used this technique to study these relationships.
Conclusion
This paper deals with the relation between the environmental quality approximated by CO2 emissions and wealth creation, nonrenewable, renewable energy and energy efficiency in Tunisia during the period 1971-2014. Results suggest the existence of significant impacts between studied variables as shown by the VECM estimated model.
Results of the Impulse response function analysis indicate that the dynamic of the gross domestic product have a positive impact indicating that economic growth in Tunisia leads to more emissions. Furthermore, fossil fuel energy consumption has a positive impact whereas renewable energy and energy efficiency has a negative effect on CO2 emissions. This indicates that the energy strategy adopted by Tunisia should be modified to permit more environmental quality throw enhancing its share of renewable energy and reducing nonrenewable energy in one hand and allow more technological changes toward more efficient equipment adoptions. However, the major barrier to adopt this structural change the high cost of efficient equipment and renewable energies. To this end, we propose to public authorities to subsidies this transition toward an environmentally friendly economy, to tax nonrenewable energy that is scarce and harmful and to involve private sector in this muting process.
End Notes
1The Arab Future Energy Index (AFEX) is an analysis and benchmarking tool that provides a detailed comparison of developments in renewable energy and energy efficiency in 17 countries in the Middle East and Africa region through more than 30 indicators.
2Canova & De Nicolo (2003); Bayoumi & Eichengreen (1992)
References
- Aguir B, Saoussen, Naoufel L, & Fethi Z NOURI. (2014) Environmental Impact Determinants: An Empirical Analysis based on the STIRPAT Model»Procedia - Social and Behavioral Sciences, 109: 449 – 458.
- AlHamisu, Sadi, Siong Hook Law, et al. (2016) Talha Ibrabim Zannah. Dynamic impact of urbanization, economic growth, energy consumption, and trade openness on CO2 emissions in Nigeria. Environnemental Sciences Pollution Ressources, 2016: 12435–12443.
- Al-Mulali U, Ozturk I, Lean HH. (2015) The influence of economic growth, urbanization, trade openness, financial development, and renewable energy on pollution in Europe.» Natural Hazards 621–644.
- Amri, Fethi. (2019) Innovation technology and environmental sustainability in the case of Tunisia. Economic research forum.
- Anser, Muhammad Khalid. (2019) Impact of energy consumption and human activities on carbon emissions in Pakistan: application of STIRPAT model. Environmental Science and Pollution Research, 13453-13463.
- Apergis, N., Payne, J.E., Menyah, K., & Wolde-Rufael, Y. (2010) On the causal dynamics between emissions, nuclear energy, renewable energy, and economic growth.» Ecological Economics, 69, 2010: 2255-2260.
- Bélaïd, F., & M. Youssef. (2017) Environmenta lDegradation, Renewable and Non-Renewable Electricity Consumption, and Economic Growth: Assessing the Evidence from Algeria. Energy Policy 102: 277–287.
- Belloumi, M., (2009) EnergyconsumptionandGDPinTunisia:Cointegrationandcausality analysis.» Energy Policy, 2009: 2745–2753.
- Bento, J.P.C., & V. Moutinho. (2016) CO2 Emissions,Non-Renewable and Renewable Electricity Production,Economic Growth, and International Trade in Italy.» Renewable and Sustainable Energy Reviews, 2016: 142–155.
- Chebil, Fatma. (2017) Politique énergétique en Tunisie, Notes et analyses de l’ITCEQ N°55.
- Deutsche Gesellschaft für Internationale Zusammenarbeit, (GIZ), (2019) Projet d’énergie renouvelable en Tunisie : Guide.» 2019.
- Dong, K., Dong, X., & Dong, C. (2019) Determinants of the global and regional CO2 emissions: What causes what and where? Applied Economics, 51(46): 5031-5044.
- Dong, K., R. Sun, & X. Dong. (2018) CO2 Emissions, Natural Gas and Renewables, Economic Growth: Assessing the Evidence from China.» Science of the Total Environment, 640: 293–302.
- Jammali , Dorsaf, et Naoufel Liouane. (2017) Energies Renouvelables, Efficacité Energétique Et Croissance Verte En Tunisie.» International Journal of Scientific Research & Engineering Technology - IJSET,: 32-47.
- Kangyin Dong, Xiucheng Dong & Cong Dong. (2019) Determinants of the global and regional CO2 emissions: What causes what and where? APPLIED ECONOMICS, 1-14.
- MS, Hossain. (2011) Panel estimation for CO2 emissions, energy consumption,economic growth, trade openness and urbanization of newly industrialized countries.» Energy Policy, 6991–6999.
- S Shafiei, RA Salim. (2013) Non-renewable and renewable energy consumption and CO2 emissions in OECD countries: a comparative analysis.» Energy Policy: 66, 547-556.
- Salim, R.A., & Rafiq, S. (2012) Why do some emerging economies proactively accelerate the adoption of renewable energy?» Energy Economics,34,: 1051-1057.
- Sarkodiea, Samuel Asumadu, Samuel Adams, Phebe Asantewaa Owusu, Thomas Leirvik, et Ilhan Ozturk. (2020) Mitigating Degradation and Emissions in China: the role of Environmental Sustainability, Human Capital and Renewable Energy.» Science of the Total Environment, 2020: https://doi.org/10.1016/j.scitotenv.2020.137530.
- UNDP. (2018) Plan solaire tunisien plan d’action pour l’accélération des projets d’énergies renouvelables en Tunisie, République Tunisienne Ministère de l'Énergie, des Mines et des Énergies Renouvelables.
- Y, Zhang, Zhang Q, et Pan B. (2019) Impact of affluence and fossil energy on China carbon emissions using STIRPAT model.» Environ Sci Pollut Res Int, 2019: 18814-18824.
- Yemah, Menyaha, et Wolde-Rufael. (2010) CO2 emissions, nuclear energy, renewable energy and economic growth in the US.» Energy Policy, 38, 2010: 2911-2915.