Research Article: 2018 Vol: 22 Issue: 1
The Moderating Effect of Banks on the Relationship between A Start-Ups Patent Performance and Loan Default Rate
Hyunsung D Kang, Berry College
Abstract
This study explores the moderating effect of banks on the relationship between a start-up’s patent performance and loan default rate. By building a strong relationship with a start-up, banks may want to access the start-up’s private information, better evaluate the future value of the start-up’s technological capability and avoid adverse selections that are common in the entrepreneurial credit market. Using a dataset on 2254 Small Business Administration 7(a) loan activities involved with genetic engineering and information technology based start-ups, this study finds that start-ups that have strong patent performances tend to experience a lower rate of default. This negative relationship between a start-up’s patent performance and default rate becomes salient when banks are close to the start-ups and are of considerable size. These findings fill the gap in the literature by elaborating how banks use these distance and size effects to avoid potential adverse selections in the entrepreneurial credit market.
Keywords
Bank, Patent, Start-Up, SBA, Entrepreneurial Credit Market.
JEL Codes: D82, G14, L26.
Introduction
High-technology based start-ups constantly strive to find a balance between leveraging what they know and investing in the future that may require different knowledge sets to advance their technologies (Benner & Tushman, 2003; March, 1991). For most start-ups, these technologies serve as essential factors to realize their entrepreneurial opportunities. In contrast, these start-ups are often unprofitable and lack the necessary resources so they must gain access to external resources in order to exploit their entrepreneurial opportunities (Beckman & Burton, 2008; Colombo & Grilli, 2005). Start-ups, however, may experience a “valley of death” transitional phase. In this growth stage, their technology is deemed promising yet without validated commercial potential (National Research Council, 2009) and they fail to access the direct financing sources (e.g. private equity). Since financial capital is essential to procure other types of resources, this lack of financial capital seriously hurts the start-up’ growths and survivals.
To overcome such financial constraints, start-ups often access the lending market to continue exploiting their entrepreneurial opportunities. This lending market is defined as the entrepreneurial credit market. Indeed, banks have been a critical source of financing for start-ups, providing about 60% of debt financing to small businesses (Federal Reserve Bank of Atlanta, 2014). More specifically, start-ups have increasingly utilized the Small Business Administration (SBA) 7(a) loan program through banks. While the SBA 7(a) loan program provides a government-backed guarantee on the portion of loan amounts, banks are supposed to select qualified start-ups and take a portion of responsibility associated with a default.
The role of banks in the entrepreneurial credit market is justified because they possess the continuing ability to evaluate process, disburse, service and liquidate such loans (Dilger, 2013). A growing body of literature suggests that banks are able to overcome the asymmetric information problem by producing information about potential borrowers and using the information in the selection process. This notion, however, remains not fully explored because necessary information is often not readily available due to the nature of start-ups, which are young and do not have sufficient records about their operations, in the entrepreneurial credit market. Given these distinguishable characteristics of the entrepreneurial credit market, this notion should be revisited in a new framework that is consistent with the context of entrepreneurial credit market. This framework should be involved with how banks access a start-up’s private information to alleviate information asymmetry and avoid adverse selections, eventually enhancing their credit market performances. Since technological capability is often the most important resource for a start-up, my central question becomes how a start-up’s technological capability impacts the default rate and what conditions under which banks affect the relationship between these two critical factors in the entrepreneurial credit market.
A stream of the literature I consider in this study is the literature on information asymmetry and adverse selection, which can be readily applied with the context of entrepreneurial credit market (Berger & Udell, 1995; Bhattacharya & Thakor, 1993; Boot, 2000; Fama, 1985; Fama & Malkiel, 1965; Freixas, 2005; Hodgman, 1961; Ongena & Smith, 2000; Petersen & Rajan, 1994; Rothschild & Stiglitz, 1976; Schenone, 2004). Start-ups often have private information about the value of their entrepreneurial opportunities. This private information allows start-ups to have superior information positions and distort uncertainty about their credit worthiness (Cole, 1998), leading to credit rationing equilibria (Stiglitz & Weiss, 1981) and invalidating other standard competitive market results (Broecker, 1990). Banks may obtain such private information through a continued relationship. This information can be used to set future contract terms or credit underwriting decisions, resulting in a better credit market performance by avoiding adverse selections on potential borrowers (Stein, 2002). In contrast, start-ups may want to use their superior informational positions for their own sake in order to obtain favorable contract terms and loan approvals. This tendency may become stronger if a start-up has a great magnitude of private information that would negatively affect the favorable contract terms and loan approvals.
Using a longitudinal dataset on 2254 Small Business Administration (SBA) 7(a) loans associated with genetic engineering and information technology based start-ups between 1980 and 2005, this study provides empirical evidence that start-ups with strong patent performances tend to experience a lower rate of default. This negative relationship between a start-up’s patent performance and default rate becomes stronger when lending banks are close to the start-ups (e.g. distance effect) and of considerable size (e.g. size effect). These findings highlight that banks serve to moderate the relationship between a start-up’s patent performance and default rate by exerting such distance and size effects.
Literature and Hypotheses Development
SBA 7(a) Loan
The goal of SBA 7(a) loan is to help start-ups resolve their financial constraints by encouraging banks to provide loans for start-ups. Proceeds from SBA 7(a) loans may be used to establish a new business or to assist in the operation, acquisition or expansion of an existing business. When a start-up submits an application for the SBA 7(a) loan to a bank, the bank reviews the application and decides whether it merits a loan on its own or not. If the bank determines that it is willing to provide the loan, but only with the SBA guarantee, it submits the application for approval to the Standard 7(a) Loan Guaranty Processing Centre. These centres eventually decide whether to approve the applications. These multiple steps are visualized in Panel A in Figure 1. The SBA guarantee assures the bank that, if the start-up does not repay the loan and the bank adhered to all applicable regulations concerning the loan, the SBA will reimburse the bank for its loss, up to the percentage of the SBA’s guarantee. The SBA charges banks upfront a one-time guarantee fee and an annual on-going servicing fee, which cannot exceed 5.55% per year of the outstanding balance of the SBA’s share of the loans. The bank may charge start-up reasonable fees customary for similar banks in the geographic area where the loan is being made for packaging and other services. The simple statistics of SBA loan activities are presented in Panel B in Figure 1.
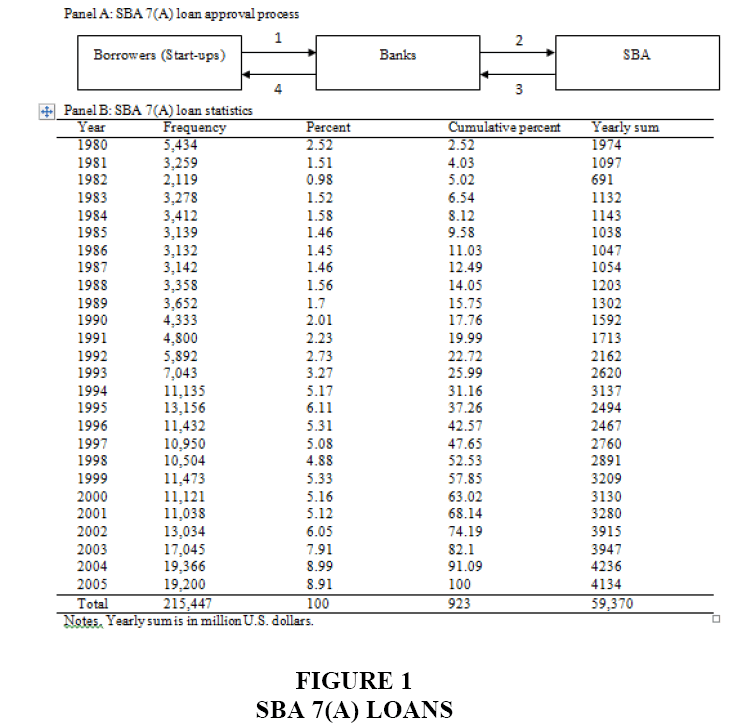
Figure 1: Sba 7(A) Loans
To be eligible for the loan, a start-up must be located in the United States, be a for-profit-operating business, be qualified as a small business under the SBA’s size requirements, demonstrate a need for the desired credit and be certified by a banker designated by the SBA. The maximum loan amount is up to $ 5 million (up to $3.75 million maximum guarantee). The average loan amount was $ 34,000 in 2012. The maximum loan term is typically 10 years and can be extended up to 25 years with extensions. Banks are allowed to charge start-ups a reasonable fixed interest rate or a variable interest rate. The maximum allowable fixed interest rate in 2013 was typically up to 9.42%. The interest rates vary by the loan amount and are determined by a multi-step formula published in the Federal Register.
There is a debate that the SBA should be provided additional resources to assist start-ups that would create more jobs (Evans & Jovanovic, 1989; Evans & Leighton, 1989; Stiglitz & Weiss, 1981). Others worry about the long-term adverse economic effects of spending programs that increase the federal deficit and that many of the small businesses are not Schumpeterian innovators–they do not attempt to introduce new ideas, nor do they seek to enter a new or underserved market (Haltiwanger et al., 2013; Hurst & Pugsley, 2011; Neumark et al., 2011). This debate is still on-going in the literature. Some studies report that a small but positive and statistically significant relationship exists between guaranteed loans and regional economics (Craig et al., 2007; Lee, 2013; Riding & Haines Jr., 2001). Young et al. (2014) found that the SBA lending activity has a negative effect on per capita income growth; and De Andrade and Lucas (2009) found that the SBA loan borrowers are charged rates that are no lower than on comparable uninsured securities.
Given this line of studies, it is surprising that little is known about what factors eventually determine the default rates, which is a dimension of a start-up’s performance. To explore this issue, it is essential to examine the technological capability of start-up, which is often the most important resource for start-ups. Moreover, it is interesting to examine how banks serve to determine the nature of relationships between these two factors, including a start-up’s technological capability and default rate. In a broad sense, these issues help us understand how banks allocate SBA 7(a) loans in an efficient manner and what external contingencies shape the entrepreneurial credit market.
Information Asymmetry and Adverse Selection in the Entrepreneurial Credit Market
Start-ups want to acquire necessary capital to exploit their entrepreneurial opportunities and banks seek opportunities that match up deposits and borrow for reasonable rates of return. These two parties exchange their resources with each other in the entrepreneurial credit market. However, they may have difficulties when exchanging resources, particularly due to limited information about each other (Agarwal et al., 2012; Barkema & Schijven, 2008; Coff, 1999; Duhaime & Schwenk, 1985; Haspeslagh & Jemison, 1991; Reuer & Koza, 2000; Sleptsov & Anand, 2008). Start-ups are typically more informationally opaque than large corporations because they often do not have certified audited financial statements to yield credible financial information on a regular basis (Berger, Frame & Miller, 2005). Due to this opacity, start-ups take informationally superior positions, compared to banks and determine the ability and willingness of providing their private information (Hansen, 1999).
Banks, despite their inferior informationally inferior position, try to constitute an important source of specialized information and expertise for the credit market. Banks should utilize a number of lending technologies to cope with the information asymmetry. They necessarily use public information and combine it with relatively limited data about start-ups using statistical methods to predict future credit performance. The public information includes credit history, identifiable assets and business data involved with the stock holders of start-ups. Public information is useful because it is available in the secondary market with lower cost and yields significant growth in the credit availability of start-ups.
For an alternative information source, banks use private information gathered through contacts over time with start-ups, including the owners, managers and other members of local communities. Private or soft information refers to any kind of data other than the relatively transparent public information about the start-up such as financial statements or the availability of collateral. Private information is essentially qualitative in nature, so it cannot be easily or verifiably recorded in written form (Garcıa-Appendini, 2011). It takes a significant amount of time to accumulate private information about start-ups. Banks may interchangeably use private and public information to allocate their credits among start-ups.
When start-ups and banks have different information, it is a state of asymmetric information. Start-ups that have better private information about the quality of their entrepreneurial opportunities will selectively provide their information for banks to benefit themselves the most at the expense of banks, causing adverse selections. The appropriate information flow from start-ups may not occur for a variety of reasons, including lack of recording, inadequate incentives and conflicts of interests. Banks are naturally worried about this distorted flow of information that start-ups may selective provides their information for their own sakes. To alleviate their concerns about adverse selections, banks use both public and private information in the entrepreneurial credit market.
Hypotheses Development
As a start-up accumulates its technology in its life cycle, it is likely to become more competent to complete its product development process by reducing uncertainty around the technology, allowing it to become an attractive borrower in the credit market. Moreover, the accumulation of technological capability enables a start-up to better understand and recognize the value of the technology and the nature of necessary resources for future uses. With these benefits, technological capabilities eventually enable a start-up to develop and implement strategies that have the effect of lowering a start-up’s net costs and increase the start-up’s net revenues beyond what would otherwise be expected (Barney and Arikan, 2001). In any case, technological capability is multifaceted and heterogeneously distributed across firms. However, it may manifest itself singularly in a start-up’s intellectual property such as a start-up’s patent performance.
As a legal right to exclude others from the use of proprietary inventions, a patent serves a well-known isolating role against imitation in markets for final goods and services (Rumelt, 1984; Teece, 1986). By reducing informational imperfections in factor input markets, patents also may serve a signaling function (Haeussler et al., 2009; Long, 2002) and improve access or terms of trade in this earlier competitive arena. Indeed, patents serve as quality signals to entrepreneurial investors and create a separate set of advantages in the credit market. Much like human capital markets, the market for entrepreneurial financing is rife with informational imperfections (Hall & Lerner, 2010). When investors find it difficult to separate good projects from bad, financial backing can be more costly or difficult to secure (Leland & Pyle, 1977). Given that the quality of start-ups often cannot be observed directly, banks therefore assess value by estimating the conditional probability that a firm will succeed, given a set of observable characteristics of the start-ups. Combining both isolating and signalling functions of patents, start-ups that have a strong patent performance may more easily procure external resources, including lending from banks, in order to successfully proceed the commercialization and marketing process of their products or services. As a result, I predict:
Hypothesis 1: Start-ups that have strong patent performances are likely to experience a lower rate of default.
A start-up’s private information may travel within a limited range of local community because such information difficult to communicate and quantify. This type of information includes the technological information regarding a start-up’s patents. All the patents have different future values. Banks often should have a local presence to maintain direct and indirect contacts with start-ups to collect available information (Berger & Udell, 1995; Petersen & Rajan, 1994) and efficiently evaluate the future values of patents possessed by start-ups. This information is rather private information that can be selectively provided by start-ups and obtained by strong relationships with start-ups. Typically, such information would increase the cost of having large scale, geographically spread-out lending operations, implying strong diseconomies of scale in the entrepreneurial credit market (Petersen & Rajan, 2002). Beyond the range of community, start-ups are more likely to exert to their efforts, in necessary, to conceal the private information that would negatively affect the likelihood of loan approvals and contract terms.
As such, if the physical distance between banks and start-ups increases, the contacts between two parties may become more impersonal and dependent on public information. This nature of relationship allows start-ups to more easily release selected information that are prepared by their loan professionals, such as brokers, accountants and lawyers, in favour of them. With a greater information asymmetry, banks become more difficult to closely observe and evaluate the future values of patents possessed by start-ups. Start-ups that perceive a high chance of default or predict the unpromising future of business for some reasons, despite their considerable patent performances, especially are more likely to access banks at a distance. If this conjecture is true, the relationship between a start-up’s patent performance and default rate becomes contingent on the capabilities of banks to collect private information. As a result, it is predicted:
Hypothesis 2: The negative relationship between start-ups’ patent performances and default rates will be stronger when start-ups are close to the lending banks.
Large banks may be able to serve start-ups well by using a greater volume of public information, such as credit scoring and lending against fixed asset collateral with values (Berger & Udell, 2006; Frame et al., 2001; Frame et al., 2004;). Large banks also recently maintained decentralized decision making structures and are able to respond more to local market competition (Canales & Nanda, 2011), allowing them to better access start-ups’ private information. Combining both types of information, large banks may outcompete in the entrepreneurial credit market. In other words, large banks can reduce information asymmetry and adverse selections by using their rich resources and better organizational structures those smaller banks would not emulate. This competence of large banks can be readily applied to observe and evaluate the future values of patents possessed by start-ups. In this regime, large banks may make the negative relationship between a start-up’s patent performance and its default rate more salient.
Notice that contrary to my prediction, it can be argued that small banks are better able to form strong relationships with start-ups, while large banks tend to serve more transparent firms (Berger & Udell, 2002; Stein, 2002). This approach seems reasonable in the credit market where transparent and non-transparent firms co-exist, but less so in the entrepreneurial credit market in which most potential borrowers are not considerably transparent. In other words, as long as large banks compete in the entrepreneurial credit market, their applicants are often not transparent. As long as large banks maintain decentralized structure, they are still likely to advantageous in terms of accessing private information in the entrepreneurial credit market. If this conjecture is true, we will see:
Hypothesis 3: The negative relationship between start-ups’ patent performances and default rates will be stronger when start-ups borrow from banks of considerable size.
Data and Empirical Strategy
Data
To analyse the moderating effects of banks between a start-up’s patent performance and default rate, this study has utilized three data sources. These data sources include a dataset on SBA 7(a) loan activity involved with genetic engineering and information technology based start-ups obtained from the SBA via a Freedom of Information Act request, the Bank Regulatory database available from Wharton Research Data Services and the patent database provided by the US Department of Commerce's United States Patent and Trademark Office (USPTO). Both industries are identified by the sectorial input-output database developed by Dale W. Jorgenson and associated with sectors that have the KLEM numbers of 15, 23 and 29. Given that the SBA has several loan programs; their main effort is the 7(a) loan program that facilitates loans to existing small businesses by guaranteeing varying percentages of loans. This study used observations within 7(a) loan program because this program is over 90% of loans approved by the SBA and intended to provide long-term entrepreneurial credit without any special benefit for a specific group of applicants.
The SBA provided a number of variables, including the identities of lending banks and start-ups and associated locations and the loan amounts and interest rates of each individual loans. Furthermore, they provided data on loan failure (i.e., default) amounts on each loan. This data allows me to estimate the actual default rates of individual loans, which are, on average, 9.27% according to my sample. This actual default rate is considerably lower than the probability of SBA loan failures (i.e., 17%) estimated by prior studies (Treacy & Carey, 1998; Glennon & Nigro, 2005) and higher than the average loan failure rates of the US commercial banks (i.e., 3.5%) (http://www.federalreserve.gov/releases/chargeoff/delallsa.htm).
The Bank Regulatory database provides financial accounting data for regulated depository financial institutions, including bank holding companies, commercial banks, saving banks and saving and loans institutions. The source of the data comes from the required regulatory forms filed for supervising purposes. Specifically, the Commercial Bank database, from the Federal Reserve Bank of Chicago, is used. It contains data from all banks filing the Report of Condition and Income that are regulated by the Federal Reserve System, Federal Deposit Insurance Corporation and the Comptroller of the Currency. From these data sources, this study utilized the total amounts of assets and the net income of sample banks.
The observations drawn from the dataset on SBA 7(a) loan activity and the Bank Regulatory database are matched with the patent information provided by USPTO. To appropriately utilize these datasets, two identification systems are used: PDPCO and Compustat GVKEY. PDPCO was introduced in the NBER PDP project, which aims to facilitate the matching of patent data to the Compustat data, which provides accounting data. The use of these two identification systems alleviates a potential mismatching problem, in which assignee names do not necessarily correspond to the records within other databases and tracks changes in patent ownership. The observations that were not matched with PDPCO and GVKEY were manually searched from the website of USPTO. My dataset is eventually composed of 2254 individual SBA 7(a) loans.
Dependent Variable: Default
An outcome variable (i.e., default) is defined as the log amount of default at the end of individual loan term. All dollar values are converted into 2005 constant dollars using the GDP deflator. Ideally, one would measure the amount of default by observing at the time of loan approval to alleviate time-varying unobserved heterogeneity that may lead me to mistakenly estimate the effects of independent variables on default (Variables names are in italic hereafter). However, such a measure is hardly available at the level of individual loans, except for a perceptual measure that also may lead to a bias in parameter estimation (Ketokivi & Schroeder, 2004). For a sensitivity analysis, I use the rank variable of default (i.e., default rank). The greater rank denotes a greater value of default. This approach alleviates my concerns about the abnormal effects of outliers.
Independent Variables
Distance
Distance measures the linear distance between the zip codes of a start-up and a lending bank. A lending bank is defined as the branch of bank that actually manages all the loan processing. All the longitude/latitude data came from the 2000 US Census. A simple distance calculation method is used and calculates the distance in miles by passing the latitude and longitude coordinates.
Size
Bank size can impact the bank’s decision on loan applications and approvals. While larger banks can benefit from economies of scale and scope, smaller firms are often more nimble and can make faster decisions on loan activities. Size is measured by the log of total assets of bank (Berger et al., 2014). This measure may capture the effect of bank size on the capabilities of banks to observe and evaluate the future values of patents possessed by start-ups.
Patent
As noted, several different measures of technological progress have been proposed in the literature and a start-up’s patenting capacity is an important alternative measure to capture its ability to finance and encourage and stimulate following R&D activities (Jaffe et al., 2002). Some studies have reported that a start-up’s patenting capacity is positively correlated with the amount of its external financing received (e.g. Baum & Silverman, 2004; Mann & Sager, 2007). Thus, I estimate patent by using a start-up’s patent stock at t (Hall et al., 2005) and include it in the following analysis.
Control Variables
Loan Characteristics
Net income is measured by the log of a bank’s net income. Bank net income is a measure of banks’ financial performances and has been found to affect the likelihood of effective monitoring and controlling of the banks’ loan processes (Cole, 1998). As such, banks that already have strong financial performances are more likely to select start-ups that are more likely to repay the bank credits.
Loan amount and loan interest rate, can impact the likelihood of the default rates of start-ups (Glennon & Nigro, 2005; Riding & Haines, 2001). The former is measured by the log of the amount of individual loans and the latter is the interest rates approved with the loans. As the dollar amount of loans increase, banks are likely to utilize a more rigorous asset protection in the event that borrowers do not repay the bank credits, impacting the variation of default. Interest rates on individual loans inversely reflect how start-ups have capacities to repay bank credits and represent the financial burdens imposed on them.
Technology Characteristics
Forward citations are the citations that a patent receives from subsequent patents. The number of forward citations has been shown to be positively related with the value of patents and often used to control for the potential value of a start-up’s technology in the literature (Dyer & Singh, 1998). Since the value of technology is heterogeneously distributed and impacts a start-up’s performance, it is controlled for using forward citation that counts a start-up’s forward citation stock at t.
In contrast, backward citations that a patent cites previous patents are involved with technological uncertainty that may serve as a proxy for a reciprocal for commercial potential in high-technology sectors (Iansiti, 1995; Krishnan & Bhattacharya, 2002). This uncertainty is likely to be higher for technology that is more basic or more distant from commercialization (Ziedonis, 2007). I estimate this nature of technology using backward citation that counts a start-up’s backward citation stock at t (Lanjouw & Schankerman, 2001). The greater backward citations represent the more matured technology and vice versa.
Fixed Effects: Ownership, State, Year Fixed Effects
To alleviate concerns about the existence of confounding variables with the limitation of data availability, I use several fixed effects in the following analyses. First, ownership fixed effects control for the ownership structure of start-ups. This variable is categorized into three groups, including sole proprietorships, limited partnerships and corporations. The ownership structure can determine how much private information banks will use. For example, a bank may need more private information for a start-up that has a single owner because this start-up does not produce sufficient hard information. Second, state fixed effects control for states in which start-ups operate. These fixed effect control for institutional factors that are different among states, such as tax conditions and entrepreneurial policies. Finally, year fixed effects control for time varying conditions. The risk of default is not constant, but varies significantly over time varying economic conditions (Glennon & Nigro, 2005).
Empirical Specification
This study uses two econometric approaches to estimate the effects of patent on default, including ordinary least squares (OLS) and negative binomial (NB) regressions. The OLS regression approach, which has been popular due to its simplicity, performs a one-tailed t-test on one variable of interest and all observable exogenous variables in the regression of other variables of interest (Lokshin et al., 2007). In the OLS specification, I estimate the following models: Ci = α;+βXi+γZi+εi, where Ci denotes my dependent variable, default; Xi are independent variables of interest, patent; and Zi are control variables. Control variables include loan characteristics, technology characteristics and several fixed effects.
For a sensitivity analysis, I use default rank, the rank variable of default, with negative binomial regression models. This specification uses the negative binomial distribution that is a discrete probability distribution of the number of successes in a sequence of independent and identically distributed Bernoulli trials before a specified number of failures occur. This approach is well suited to predict the probabilities of default rank because it is a type of generalized linear model in which the dependent variable is a count of the number of times an event occurs. As discussed, this approach alleviates my concerns about the abnormal effects of outliers.
To estimate the interaction effects of patent and bank characteristics, including distance and size, this study uses a product function approach that performs a simple one-tailed t-test on the interaction term of the two variables of interest in the regression of a performance variable and thus examines the cross-derivative of the two variables. If hypothesis 2 is supported, we should see the interaction of variable of patent and distance significantly and negatively impact default. Using the same logic, it is expected that the interaction variable of patent and size significantly and positively impact default in order to support hypothesis 3.
To elaborate on the interaction effects, this study uses two approaches: Seemingly unrelated (SU) post-estimation and segmented regression approaches. The purpose of using SU estimation is to compare two regression coefficients from two SU regressions. For example, I first split the sample along with the mean of distance, resulting in two groups of samples (e.g. high and low distance). I then use SU estimation to see the extent to which patent responds in these two categories differently to determine the probabilities of default. Using the same logic, I replicate these steps with size.
Finally, this study uses a segmented regression approach to find the optimal range of independent variables (e.g. distance and size) to maximize the interaction effects of other variables (e.g. patent) on the performance variable (e.g. default). When analysing a relationship between a dependent and an independent variable, it may be apparent that for different ranges of independent variables, different linear relationships occur. In these cases, a single linear model may not provide an adequate description and a nonlinear model may not be appropriate (Ryan & Porth, 2007). Segmented regression is a form of regression that allows multiple linear models to be fit to the data for different ranges of independent variables. Breakpoints are the values of independent variables where the slope of the linear function changes.
Empirical Results
Descriptive Statistics
The descriptive statistics are presented in Table 1. In Panel A, Group 1 (i.e., all samples) has 2254 observations and is categorized into two groups: Groups 2 (i.e., default) and 3 (i.e., paid in full). Columns report the distribution of samples and the summary statistics categorized by the variables of interest, including distance and size. The first column reports the distribution of all samples. Group 2 has 209 observations and accounts for 9.27% of samples; and Group 3 has 2045 observations and accounts for 90.73% of samples. The proportion of each group is overall consistent with the statistics provided by prior studies (e.g. De Andrade & Lucas, 2009).
In the second column, Group 3 has, on average, a considerably greater patent (i.e., 1.710) than Group 2 does (i.e., 1.105). This difference is statistically significant at the 1% level and consistent with my prediction made in Hypothesis 1. It is also observed in the third column that Group 2 indicates, on average, greater distance (i.e., 175.967) than Group 3 does (i.e., 164.548). Moreover, Group 3 indicates greater size (i.e., 13.232) than Group 2 does (i.e., 12.276). These statistics are supportive of my predictions that distance and size impact default in a certain manner. The interaction effects of patent and two bank characteristics, including distance and size, are not examined with these simple statistics. Furthermore, these statistics need to be interpreted with caution because they are simply univariate results and may be biased due to unobserved heterogeneity.
Panel B reports summary statistics for the five groups of variables used in the following analyses. These groups include dependent variables, variables of interest, loan characteristics, technology characteristics and environmental characteristics. Start-ups borrow, on average, $376 thousand with a 10.12% interest rate. Banks have, on average, $ 7.81 billion of total assets: And $ 98.51 million of net incomes. These numbers are calculated by converting logarithms back to natural numbers (Tables 1A and 1B).
| Table 1A Panel A: Sba 7(A) Loan Approval Process |
||||||||
| Sample distribution | Patent | Distance | Size | |||||
| N | % | Mean | S.D. | Mean | S.D. | Mean | S.D. | |
| 1. All samples | 2254 | 100 | 1.654 | 1.807 | 165.609 | 451.301 | 13.143 | 2.504 |
| 2. Default | 209 | 9.27 | 1.105 | 1.689 | 175.967 | 500.899 | 12.276 | 2.558 |
| 3. Paid in full | 2045 | 90.73 | 1.71 | 1.809 | 164.548 | 446.03 | 13.232 | 2.482 |
| Table 1B Panel B: Sba 7(A) Loan Statistics |
|||||
| All samples | |||||
| N | Mean | S.D. | Min | Max | |
| 1. Dependent variables | |||||
| Default | 2254 | 1.05 | 3.315 | 0 | 13.869 |
| Default rank | 2254 | 1408.5 | 408.885 | 1278 | 2817 |
| 2. Variables of interest | |||||
| Patent | 2254 | 1.654 | 1.807 | 0 | 7 |
| Distance | 2254 | 165.61 | 451.301 | 0 | 2908 |
| Size | 2254 | 13.143 | 2.504 | 8.863 | 20.69 |
| 3. Loan characteristics | |||||
| Net income | 2254 | 8.673 | 2.678 | 0.693 | 14.684 |
| Loan amount | 2254 | 12.224 | 1.256 | 8.376 | 15.065 |
| Loan interest rate | 2254 | 10.124 | 2.804 | 0 | 23.75 |
| 4. Technology characteristics | |||||
| Forward citation | 2254 | 0.02 | 0.025 | 0 | 0.061 |
| Backward citation | 2254 | 0.022 | 0.027 | 0 | 0.061 |
| 5. Environmental characteristics | |||||
| Ownership fixed effects | 2254 | N/A | N/A | 0 | 1 |
| State fixed effects | 2254 | N/A | N/A | 0 | 1 |
| Year fixed effects | 2254 | N/A | N/A | 0 | 1 |
| Note: Forward citation and backward citation are divided by 1000 to adjust their units in the table | |||||
Effects of Patent Performance and Banks on Default
To understand the effects of patent on default and the interaction effects of patent and distance and size, several OLS and NB regression models are used and the results are presented in Table 2. Model 1 uses the OLS specification to estimate the effect of patent on default. patent indicates a negative and significant regression coefficient on default at the 1% level. More specifically and by converting logarithms back to the real amounts, as a start-up has one more patent, the amount of default decreases by, on average, $ 8002. These statistics support my first hypothesis. Model 2 includes the interaction term of patent and distance as an independent variable and shows that this interaction term indicates a negative regression coefficient with the effect statistically significant at the 10% level. This result supports my second hypothesis and suggests that the effect of patent is more salient when banks and start-ups are close to each other. Using a similar logic, I include the interaction term of patent and size in Model 3. patent×size indicates a positive and significant regression coefficient at the 5% level. These statistics suggest that the effect of patent on default is more salient when start-ups borrow from larger banks. Model 4 includes all the variables of interest together. The results are overall consistent with those in the prevision models. The interaction effects of patent and two moderating variables, distance and size, are illustrated in Figures 2A and 2B (Interaction effects of patent performance and banks).
| Table 2 Effects of Patent Performance and Banks on Default Rates |
||||||||
| OLS | OLS | OLS | OLS | NB | NB | NB | NB | |
| -1 | -2 | -3 | -4 | -5 | -6 | -7 | -8 | |
| Dependent variable | Default | Default | Default | Default | Default rank | Default rank | Default rank | Default rank |
| Patent | -0.195*** | -0.168*** | -0.688*** | -0.669*** | -0.014*** | -0.012** | -0.049*** | -0.048*** |
| -0.063 | -0.064 | -0.222 | -0.222 | -0.005 | -0.005 | -0.017 | -0.017 | |
| Patent×Distance | -0.171* | -0.176* | -0.012* | -0.012* | ||||
| -0.089 | -0.09 | -0.007 | -0.007 | |||||
| Patent×Size | 0.037** | 0.038** | 0.003** | 0.003** | ||||
| -0.016 | -0.016 | -0.001 | -0.001 | |||||
| Distance | 0.537*** | 0.776*** | 0.523*** | 0.768*** | 0.040*** | 0.056*** | 0.039*** | 0.055*** |
| -0.177 | -0.254 | -0.177 | -0.254 | -0.013 | -0.018 | -0.013 | -0.018 | |
| Size | -1.144*** | -1.142*** | -1.181*** | -1.179*** | -0.071*** | -0.071*** | -0.073*** | -0.073*** |
| -0.098 | -0.098 | -0.097 | -0.097 | -0.006 | -0.006 | -0.006 | -0.006 | |
| Net income | 0.975*** | 0.975*** | 0.950*** | 0.950*** | 0.059*** | 0.059*** | 0.057*** | 0.057*** |
| -0.094 | -0.094 | -0.094 | -0.094 | -0.006 | -0.006 | -0.006 | -0.006 | |
| Loan amount | -0.250*** | -0.248*** | -0.251*** | -0.249*** | -0.026*** | -0.027*** | -0.026*** | -0.027*** |
| -0.064 | -0.064 | -0.064 | -0.064 | -0.005 | -0.005 | -0.005 | -0.005 | |
| Loan interest rate | -0.280*** | -0.280*** | -0.278*** | -0.278*** | -0.021*** | -0.021*** | -0.021*** | -0.021*** |
| -0.073 | -0.073 | -0.073 | -0.073 | -0.005 | -0.005 | -0.005 | -0.005 | |
| Forward citation | 0.775 | 0.967 | 0.314 | 0.502 | 0.135 | 0.149 | 0.101 | 0.115 |
| -4.731 | -4.71 | -4.728 | -4.705 | -0.372 | -0.369 | -0.372 | -0.37 | |
| Backward citation | 7.389* | 7.477* | 7.816* | 7.914* | 0.408 | 0.41 | 0.441 | 0.443 |
| -4.356 | -4.338 | -4.343 | -4.325 | -0.339 | -0.338 | -0.338 | -0.337 | |
| Constant | 20.237*** | 11.641*** | 12.342*** | 12.347*** | 8.086*** | 8.090*** | 8.134*** | 8.138*** |
| -4.918 | -1.756 | -1.779 | -1.795 | -0.15 | -0.15 | -0.152 | -0.151 | |
| Ownership fixed effects | Yes | Yes | Yes | Yes | Yes | Yes | Yes | Yes |
| State fixed effects | Yes | Yes | Yes | Yes | Yes | Yes | Yes | Yes |
| Year fixed effects | Yes | Yes | Yes | Yes | Yes | Yes | Yes | Yes |
| N | 2254 | 2254 | 2254 | 2254 | 2254 | 2254 | 2254 | 2254 |
| Log likelihood | -5.70E+03 | -5.60E+03 | -5.60E+03 | -5.60E+03 | -16000 | -16000 | -16000 | -1.60E+04 |
| Prob>F (Chi2) | 0 | 0 | 0 | 0 | 0 | 0 | 0 | 0 |
| R2 (Pseudo R2) | 0.197 | 0.199 | 0.199 | 0.201 | 0.018 | 0.018 | 0.018 | 0.018 |
| Note: Robust standard errors are presented in parentheses. * p<0.10, ** p<0.05, *** p<0.01. Distance, forward citation and backward citation are divided by 1000 to adjust their units in the table. | ||||||||
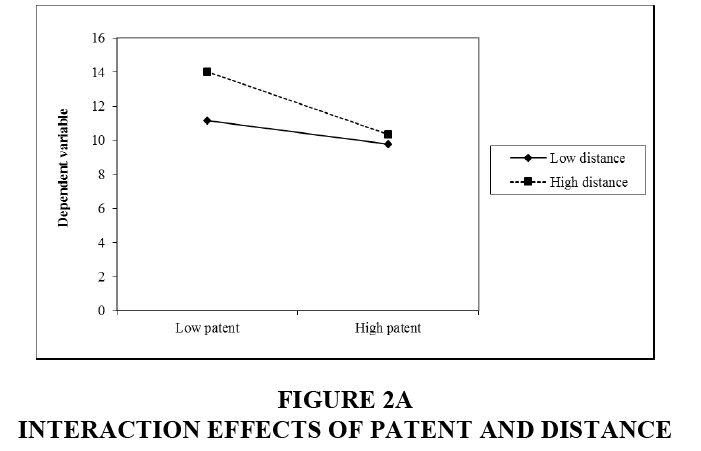
Figure 2A: Interaction Effects of Patent and Distance
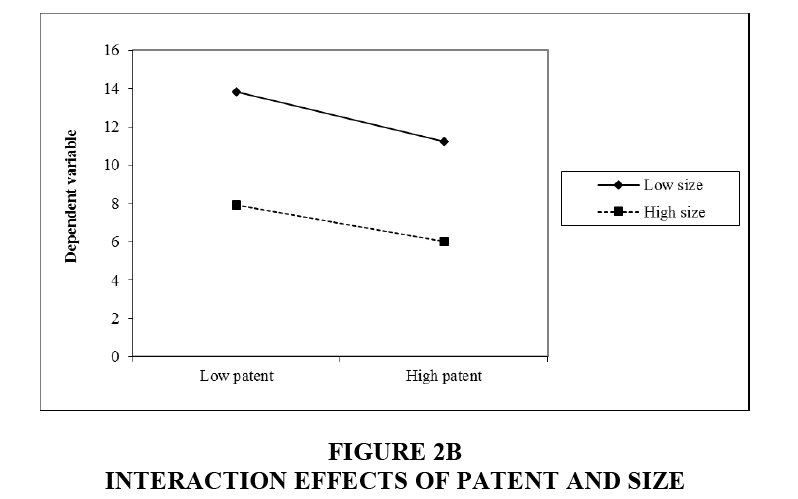
Figure 2B: Interaction Effects of Patent and Size
To control for the abnormal effects of outliers, I use the NB specification using the rank variable of default, default rank, in Models 4 through 8. Consistent with the result in Model 1, patent indicates a negative and significant regression coefficient at the 1% level in Model 5. These results suggest that my finding in Model 1 is robust against the effects of outliers. In Model 6, Patent×Distance has a negative and significant effect at the 10% level, supporting my finding in Model 2.
Similarly, in Model 7, Patent×Size indicates a positive and significant regression coefficient at the 5% level. In Model 8, all the variables of interest are included and indicate overall consistent results shown in Models 1 through 4. As a result, I conclude that all of my hypotheses are supported and these findings are robust to the abnormal effects of outliers.
Refining the Moderating Effects of Patent
This study moves beyond just identifying the existence of complementarities between patent and two bank characteristics, distance and size and elaborate the complementarities using SU post-estimation and segmented regression approaches. Table 3 reports these results. First, we focus on finding more robust evidence about the moderating effects of patent. We split the sample along with the mean of distance (i.e., 16 miles), resulting in two groups of samples. Model 1 uses a group that contains less distance (i.e., low distance) than its mean; and Model 2 uses the other group. While patent has -0.223 of regression coefficient with significance at the 10% level in Model 1, it indicates -0.133 of coefficient with significance at the 10% level in Model 2. SU post-estimation tests the difference between these two regression coefficients across Models 1 and 2 and shows χ2=4.39 and Prob>χ2=0.036. These results indicate that two regression coefficients are significantly different at the 5% level. These results support that the effects of patent are distinguishable depending on whether banks are close to start-ups or not.
| Table 3 Refining the Moderating Effects of Banks |
||||||||
| OLS | OLS | OLS | OLS | OLS | OLS | OLS | OLS | |
| -1 | -2 | -3 | -4 | -5 | -6 | -7 | -8 | |
| Dependent variable | Default | Default | Default | Default | Default | Default | Default | Default |
| Data range | Distance<16 | Distance≥16 | Size<12.315 | Size≥12.315 | Distance<26 | Distance≥26 | Size<11.115 | Size≥11.115 |
| Patent | -0.223** | -0.133* | -0.077 | -0.285*** | -0.279** | -0.100** | -0.026 | -0. 391*** |
| -0.098 | -0.078 | -0.101 | -0.08 | -0.084 | -0.089 | -0.139 | -0.071 | |
| Distance | 0.611 | 0.597*** | 0.814*** | 0.058 | -9.404 | 0.527** | 0.941** | 0.094 |
| -22.557 | -0.197 | -0.273 | -0.284 | -12.4 | -0.206 | -0.382 | -0.201 | |
| Size | -1.259*** | -0.973*** | -1.312*** | -0.226 | -1.180*** | -1.033*** | -1.716*** | 0.017 |
| -0.122 | -0.156 | -0.182 | -0.217 | -0.121 | -0.165 | -0.313 | -0.154 | |
| Net income | 1.094*** | 0.814*** | 1.047*** | 0.247 | 1.050*** | 0.842*** | 1.269*** | -0.048 |
| -0.13 | -0.139 | -0.096 | -0.208 | -0.122 | -0.15 | -0.108 | -0.146 | |
| Loan amount | -0.170* | -0.260*** | -0.133 | -0.330*** | -0.171** | -0.279*** | 0.014 | -0.288*** |
| -0.1 | -0.085 | -0.107 | -0.076 | -0.085 | -0.096 | -0.177 | -0.067 | |
| Loan interest rate | -0.396*** | -0.213* | -0.336*** | -0.174* | -0.376*** | -0.211* | -0.297** | -0.283*** |
| -0.094 | -0.111 | -0.104 | -0.102 | -0.087 | -0.124 | -0.136 | -0.085 | |
| Forward citation | 1.966 | 0.481 | 5.204 | -2.54 | 2.404 | 1.773 | 8.555 | 0.331 |
| -7.775 | -5.932 | -7.681 | -6.015 | -6.607 | -6.663 | -12.485 | -5.038 | |
| Backward citation | 10.506 | 3.303 | 8.703 | 5.158 | 7.713 | 3.717 | 8.429 | 3.695 |
| -6.425 | -6.201 | -7.211 | -5.479 | -5.642 | -7.196 | -11.689 | -4.595 | |
| Constant | 16.171*** | 15.656*** | 18.896*** | 10.072*** | 13.255*** | 16.671*** | 13.219** | 17.969*** |
| -2.149 | -5.482 | -5.423 | -2.744 | -2.144 | -3.61 | -5.409 | -1.989 | |
| Ownership fixed effects | Yes | Yes | Yes | Yes | Yes | Yes | Yes | Yes |
| State fixed effects | Yes | Yes | Yes | Yes | Yes | Yes | Yes | Yes |
| Year fixed effects | Yes | Yes | Yes | Yes | Yes | Yes | Yes | Yes |
| N | 1107 | 1147 | 1083 | 1171 | 1339 | 915 | 571 | 1683 |
| F (Log likelihood) | -2.80E+03 | -2.80E+03 | -2.80E+03 | -2.70E+03 | -3.40E+03 | -2.20E+03 | -1.50E+03 | -4.00E+03 |
| Prob>F (Chi2) | 0 | 0 | 0 | 0 | 0 | 0 | 0 | 0 |
| R2 (Pseudo R2) | 0.259 | 0.217 | 0.285 | 0.128 | 0.229 | 0.27 | 0.414 | 0.133 |
| Note: Robust standard errors are presented in parentheses. * p <0.10, ** p <0.05, *** p <0.01. Distance, forward citation and backward citation are divided by 1000 to adjust their units in the table. SU post-estimation tests the regression coefficients of patent across Models 1 and 2 and shows two regression coefficients are significantly different at the 5% level (χ2=4.29 and Prob>χ2=0.0311). Similarly, regression coefficients of patent are significantly different at the 10% level across Models 3 and 4 (χ2=2.82 and Prob>χ2=0.093). | ||||||||
Using the same logic, I create two groups of samples in Models 3 and 4. Model 3 uses a group that contains less size (i.e., low size) than its mean (e.g. 12.315): And Model 4 uses the other group. While patent indicates -0.077 of regression coefficient in Model 3, it indicates 0.285 of regression coefficient in Model 4. Once again, we use the SU post-estimation approach and find that χ2=2.82 and Prob>χ2=0.093. However, these results should be interpreted with caution because patent does not indicate a statistically significant regression coefficient in Model 3. Given the condition under which the complementarities of patent and size are examined with the production function approach in Table 2; these results suggest that the effects of patent are contingent on the size of banks.
To elaborate the moderating effects of patent along with distance and size, Models 5 through 8 carry out segmented regressions. In Models 5 and 6, I optimize a break point (i.e., distance=0.026) where the slope of the linear function drastically changes to better fit to the data for different range of distance. I used the nl command in Stata that performs nonlinear least-squares estimation and allows me to define the function for piecewise functions for size. I used a break point that generates the maximum difference between the two resulting functions. I find the regression of coefficient of patent is -0.279 in the range of distance<0.026 in Model 5; and that of patent is -0.100 in the range of distance>0.026 in Model 6. This approach shows that the effect of patent can be differentiated at most in these ranges of distance. In Models 7 and 8, we use similar steps to better fit the data for different ranges of size. We optimize a break point (size=11.115) and split the sample into two groups. While the regression coefficient of patent indicates -0.096 in Model 7, that of patent shows -0.391 in Model 8. These results suggest that the effects of patent are more distinguishable in these ranges.
Discussion and Conclusion
This paper empirically examines the role of banks to determine the relationship between a start-up’s patent performance and its rate of default in the entrepreneurial credit market. A longitudinal dataset on SBA 7(a) loans associated with genetic engineering and information technology based start-ups, this study provides empirical evidence that start-ups that have strong patent performances tend to experience a lower rate of default. This negative relationship becomes salient when lending banks are close to the start-ups and of considerable size. These distance and size conditions could allow banks to better observe and evaluate the future values of start-ups’ patents by reducing the information asymmetry that is common in the entrepreneurial credit market.
My findings clarify the contribution of this study. First, the prior literature has not explicitly examined how banks contribute to shape the relationship between a start-up’s technological capability and performance. This study is aimed at fulfilling this gap by examining the informational configuration between banks and start-ups and the default rates of start-ups. By doing so, this study contributes to the on-going debate about the optimal mechanism for nurturing entrepreneurial ventures by SBA loan programs.
Secondly, my findings expand our understanding about the entrepreneurial credit market by highlighting how a bank’s location and size serve to alleviate adverse selections. A bank’s capacity to observe and evaluate the future value of patents possessed by a start-up may reduce information asymmetry between the bank and start-ups and eventually enhance effective selections on promising start-ups.
Finally, this study expands the information asymmetry theory into the entrepreneurial credit market. This perspective is particularly suitable to analyse how a start-up’s private information is revealed in the entrepreneurial credit market and what mechanism the bank uses to access such information.
Limitations from this study provide avenues for future research. Specifically, this study did not fully consider the characteristics of start-ups mainly due to the lack of data availability. This study uses several fixed effects, including ownership, state and year fixed effects, to control for the characteristics of start-ups. However, these fixed effects cannot perfectly control for the numerous dimensions of characteristics of start-ups. Future studies could examine on how a start-up’s specific characteristics determine its consequent performance in the entrepreneurial credit market.
References
- Agarwal, R., Anand, J., Bercovitz, J. & Croson R. (2012). Spill overs across organizational architectures: The role of prior resource allocation and communication in post-acquisition coordination outcomes. Strategic Management Journal, 33(6), 710-733.
- Barkema, H. & Schijven, M. (2008). Toward unlocking the full potential of acquisitions: The role of organizational restructuring. Academy of Management Journal, 51(4), 696-722.
- Barney, J.B. & Arikan, A.M. (2001). The resource-based view: Origins and implications. In Handbook of Strategic Management, Hitt, M.A., Freeman, R.E., & Harrison, J.S. (eds). Oxford, UK: Blackwell, 124-288.
- Baum, J.A. & Silverman, B.S. (2004). Picking winners or building them? Alliance, intellectual and human capital as selection criteria in venture financing and performance of biotechnology start-ups. Journal of Business Venturing, 19, 411-436.
- Beckman, C.M. & Burton, M.D. (2008). Founding the future: Path dependence in the evolution of top management teams from founding to IPO. Organization Science, 19(1), 3-24.
- Benner, M.J. & Tushman, M.L. (2003). Exploitation, exploration and process management: The productivity dilemma revisited. Academy of Management Review, 28(2), 238-256.
- Berger, A.N., Frame, W.S. & Miller, N. (2005). Credit scoring and the availability, price and risk of small business credit. Journal of Money, Credit and Banking, 37, 191-222.
- Berger, A.N., Goulding, W. & Rice, T. (2014). Do small businesses still prefer community banks? Journal of Banking & Finance, 44, 264-278.
- Berger, A.N., Miller, N.H., Petersen, M.A., Rajan, R.G. & Stein, J.C. (2005). Does function follow organizational form? Evidence from the lending practices of large and small banks. Journal of Financial Economics, 76, 237-269.
- Berger, A.N. & Udell, G.F. (1995). Relationship lending and lines of credit in small firm finance. Journal of Business, 68, 351-382.
- Berger, A.N. & Udell, G.F. (2002). Small business credit availability and relationship lending: The importance of bank organizational structure. Economic Journal, 112, 32-53.
- Berger, A.N. & Udell, G.F. (2006). A more complete conceptual framework for SME finance. Journal of Banking and Finance, 30, 2945-2966.
- Bhattacharya, S. & Thakor, A.V. (1993). Contemporary banking theory. Journal of Financial Intermediation, 3(1), 2-50.
- Boot, A.W.A. (2000). Relationship banking: What do we know? Journal of Financial Intermediation, 9, 7-25.
- Broecker, T. (1990). Credit-worthiness tests and interbank competition. Econometrica, 58(2), 429-452.
- Canales, R. & Nanda, R. (2012). A darker side to decentralized banks: Market power and credit rationing in SME lending. Journal of Financial Economics, 105, 353-366.
- Coff, R. (1999). How buyers cope with uncertainty when acquiring firms in knowledge-intensive industries: Caveat emptor. Organization Science, 10(2), 144-161.
- Cole, R. (1998). The importance of relationships to the availability of credit. Journal of Banking and Finance, 22, 959-977.
- Colombo, M.G. & Grilli, L. (2005). Founders’ human capital and the growth of new technology-based firms: A competence-based view. Research Policy, 34(6), 795-816.
- Craig, B.R., Jackson, W.E. & Thomson, J.B. (2007). Small firm finance, credit rationing and the impact of SBA-guaranteed lending on local economic growth. Journal of Small Business Management, 45, 116-132.
- De Andrade, F. & Lucas, D. (2009). Why do guaranteed SBA loans cost borrowers so much? Unpublished working paper, Northwestern University and MIT.
- Dilger, R.J. (2013). Small Business Administration 7(a) loan guaranty program. Congressional Research Service, 7-5700.
- Duhaime, W. & Schwenk, C. (1985). Conjectures on cognitive simplification in acquisition and divestment decision making. Academy of Management Review, 10(2), 287-295.
- Dyer, J.H. & Singh, H. (1998). The relational view: Cooperative strategy and sources of interorganizational competitive advantage. Academy of Management Review, 23, 660-679.
- Evans, D. & Jovanovic, B. (1989). An estimated model of entrepreneurial choice under liquidity constraints. Journal of Political Economy, 97, 808-827.
- Evans, D. & Leighton, L.S. (1989). Some empirical aspects of entrepreneurship. American Economic Review, 79, 519-535.
- Fama, E.F. (1985). What’s different about banks? Journal of Monetary Economics, 15, 29-39.
- Federal Reserve Bank of Atlanta. (2014). Small business survey.
- Frame, W.S., Padhi, M. & Woolsey, L. (2004). The effect of credit scoring on small business lending in low-and moderate income areas. Financial Review, 39, 35-54.
- Frame, W.S., Srinivasan, A. & Woosley, L. (2001). The effect of credit scoring on small business lending. Journal of Money, Credit and Banking, 33, 813-825.
- Freixas, X. (2005). Deconstructing relationship banking. Investigaciones Economicas, 29(1), 3-31.
- Garcia-Appendini, E. (2011). Lending to Small Businesses: The value of soft information. Working paper, SSRN.
- Glennon, D. & Nigro, P. (2005). Measuring default risk of small business loans: A survival analysis approach. Journal of Money, Credit and Banking, 37, 923-947.
- Haeussler, C., Harhoff, D. & Mueller, E. (2009). To be financed or not: The role of patents for venture capital financing. Unpublished working paper, University of Munich.
- Hall, B., Jaffe, A. & Trajtenberg, M. (2005). Market value and patent citations. RAND Journal of Economics, 36(1), 16-38.
- Hall, B.H. & Lerner, J. (2010). The financing of R&D and innovation. In Elsevier Handbook of the Economics of Innovation, Hall, B.H. and Rosenberg, N.(eds). Amsterdam, The Netherlands: Elsevier, 609-639.
- Haltiwanger, J.C., Jarmin, R.S. & Miranda, J. (2013). Who creates jobs? Small versus large versus young. Review of Economics and Statistics, 95(2), 347-361.
- Hansen, M. (1999). The search-transfer problem: The role of weak ties in sharing knowledge across organizational subunits. Administrative Science Quarterly, 44(1), 82-111.
- Haspeslagh, P. & Jemison, D. (1991). Managing acquisitions: Creating value through corporate renewal. New York: Free Press.
- Hodgman, D.R. (1961). The deposit relationship and commercial bank investment behavior. Review of Economics and Statistics, 43(3), 257-268.
- Hurst, E. & Pugsley, B.W. (2011). What do small businesses do? Brookings Papers on Economic Activity, 43, 73-118.
- Fama, E. & Malkiel, B. (1965). Bank portfolio allocation, deposit variability and the available doctrine. Quarterly Journal of Economics, 79, 113-134.
- Iansiti, M. (1995). Technology integration: Managing technological evolution in a complex environment. Research Policy, 24, 521-542.
- Jaffe, A.B., Trajtenberg, M. & Romer, P.M. (2002). Patents, citations & innovations: A window on the knowledge economy. Cambridge, MA: MIT Press.
- Ketokivi, M.A. & Schroeder, R.G. (2004). Perceptual measures of performance: Factor or fiction? Journal of Operations Management, 22(3), 247-264.
- Krishnan, V. & Bhattacharya, S. (2002). Technology selection and commitment in new product development: The role of uncertainty and design flexibility. Management Science, 48(3), 313-327.
- Lanjouw, J.O. & Schankerman, M. (2001). Characteristics of patent litigation: A window on competition. RAND Journal of Economics, 32(1), 129-151.
- Lee, Y.S. (2013). Entrepreneurship, small business and urban growth. Unpublished working paper, Williams College.
- Leland, H.E. & Pyle, D.H. (1977). Information asymmetries, financial structure and financial intermediation. Journal of Finance, 33(2), 371-387.
- Lokshin, B., Carree, M. & Belderbos, R. (2007). Testing for complementarity and substitutability in the case of multiple practices. Unpublished working paper, Universiteit Maastricht.
- Long, C. (2002). Patent signals. University of Chicago Law Review, 69, 625-679.
- Mann, R.J. & Sager, T.W. (2007). Patents, venture capital and software start-ups. Research Policy, 36, 193-208.
- March, J.G. (1991). Exploration and exploitation in organizational learning. Organization Science, 2(1), 71-87.
- National Research Council. (2009). Venture funding and the NIH SBIR program. Washington, DC: National Academy Press.
- Neumark, D., Wall, B. & Zhang, J. (2011). Do small businesses create more jobs? New evidence for the United States from the National Establishment Time Series. Review of Economics and Statistics, 93, 16-29.
- Ongena, S. & Smith, D.C. (2000). Bank relationships: A review, performance of financial institutions. Cambridge, UK: Cambridge University Press.
- Petersen, M.A. & Rajan, R.G. (1994). The benefits of firm-creditor relationships: Evidence from small business data. Journal of Finance, 49, 3-37.
- Petersen, M.A. & Rajan, R.G. (2002). The information revolution and small business lending: Does distance still matter? Journal of Finance, 57, 2533-2570.
- Reuer, J. & Koza, M. (2000). Asymmetric information and joint venture performance: Theory and evidence for domestic and international joint ventures. Strategic Management Journal, 21(1), 81-120.
- Riding, A.L. & Haines Jr., G. (2001). Loan guarantees: Costs of default and benefits to small firms. Journal of Business Venturing, 16, 595-612.
- Rothschild, M. & Stiglitz, J. (1976). Equilibrium in competitive insurance markets: An essay on the economics of imperfect information. Quarterly Journal of Economics, 90, 629-650.
- Rumelt, R.P. (1984). Towards a strategic theory of the firm. In Competitive Strategic Management, Lamb, B. (edn). Englewood Cliffs, NJ: Prentice Hall; 556-570.
- Ryan, S.E. & Porth, L.S. (2007). A tutorial on the piecewise regression approach applied to bed load transport data. General Technical Report RMRS-GTR-189, United States Department of Agriculture.
- Schenone, C. (2004). The effect of banking relationships on the firm’s IPO underpricing. Journal of Finance, 59(6), 2903-2958.
- Sleptsov, A. & Anand, J. (2008). Exercising entrepreneurial opportunities: The role of information-gathering and information-processing capabilities of the firm. Strategic Entrepreneurship Journal, 2, 357-372.
- Stein, J.C. (2002). Information production and capital allocation: Decentralized vs. hierarchical firms. Journal of Finance, 57, 1891-1921.
- Stiglitz, J. & Weiss, A. (1981). Credit rationing in markets with imperfect information. American Economic Review, 81, 393-410.
- Teece, D.J. (1986). Profiting from technological innovation: Implications for integration, collaboration, licensing and public policy. Research Policy, 15, 285-305.
- Treacy, W.F. & Carey, M.S. (1998). Credit risk rating at large US Banks. Federal Reserve Bulletin, 84, 897-921.
- Young, A.T., Higgins, M.J., Lacombe, D.J. & Sell, B. (2014). The direct and indirect effects of Small Business Administration lending on growth: Evidence from US county-level data. Unpublished working paper, Georgia Institute of Technology.
- Ziedonis, A.A. (2007). Real options in technology licensing. Management Science, 53(10), 1618-1633.