Research Article: 2022 Vol: 26 Issue: 1
The return and winning rate of stock option investments in Indonesia stock exchange.
Ikin Solihin, Universitas Pelita Harapan
Sugiarto, Universitas Prasetiya Mulya
Gracia Shinta S. Ugut, Universitas Pelita Harapan
Edison Hulu, Universitas Pelita Harapan
Tufrida M. Hasyim, STIE Jayakarta
Citation Information: Solihin I., Sugiarto., Ugut G. S. S., Hulu E., Hasyim T. M. (2022). The return and winning rate of stock option investments in Indonesia stock exchange. International Journal of Entrepreneurship, 26(1), 1-12.
Abstract
Options are one of the important instruments in the capital market. In Indonesia, the stock option market has not run since 2010. This study wants to discover if the Indonesian option is exercised, whether it generates profit for the seller and the buyer of the option. The calculation of stock option prices is calculated using the Black-Scholes-Merton model by taking into account several factors such as the Weighted Moving Average (WMA), strategy, interest rate, dividends, and volatility. There are three volatility models used to calculate option prices. From the calculated option prices, the yield for each sample of options is obtained. The results show that both the writer's position and the option taker's position can benefit. The advantage of each position is different; where the writer has a greater profit potential than the taker in both put and calls options.
Keywords
Black-Scholes-Merton model, Intraday Volatility, Stock Option, Weighted Moving Average
JEL Classification Codes
C18, C38, G12, G13, C53
Introduction
The capital market has an important role for the economy of a country because the capital market performs two functions, namely first as a means for business funding or as a means for companies to obtain funds from the investor community. Funds obtained from the capital market can be used for business development, expansion, additional working capital and others, the two capital markets have become a means for the public to invest in financial instruments such as stocks, bonds, mutual funds, etc. The Indonesian stock market has shown growth in recent years. In terms of market capitalization, market growth has reached 966.6% from Rp. 679.95 trillion in 2004 to Rp. 7,252.45 trillion as of July 2019 (Indonesian Stock Exchange, 2019).
A growing stock market is an indicator of prosperous economic conditions in any country, and it attracts both domestic and foreign investors to invest in the country (Murtaza & Ali, 2015). According to the results of the OECD (2019) research, the government and the corporate sector in Indonesia are highly dependent on foreign funding (61 and 33 percent of total debt, respectively). As an investment instrument, the stock market cannot be separated from risks. Coronavirus (COVID-19) is having a huge impact on the global economy. The S&P 500 hit a record closing high of 3,386 on February 19, 2020. However, more than three weeks later, the market closed at 2,480, which represented a decline of about 26 percent. The index started to recover in early April 2020 with the supply and demand sides fundamentally rising (Statistika, 2020).
In the midst of very tight and multidimensional global business competition. The movement of funds that occurred became very dynamic and global in nature. Investors always minimize the various risks that arise, both long-term risks and short-term risks. According to Markowitz's (1952) portfolio theory, investors estimate the expected return and risk. This estimate is statistically analyzed to get an efficient investment portfolio. An efficient portfolio is a combination and diversification of investments.
One way of hedging in the investment world is by utilizing derivative products. Derivatives are securities that move according to one or more underlying assets. This includes options, swaps, futures and futures contracts. The underlying asset can be stocks, bonds, commodities, currencies, indices, or interest rates. Derivatives Markets are becoming an important feature of global financial developments (Islam et al., 2020).
The adoption of the FED's monetary policy in 1979 led to the volatility of Treasury bond interest rates which in turn increased the need for derivatives to protect interest rate movements. Many financial crises occurred in the 1990s, which expanded the needs of investors around the world for hedging products. As a derivative instrument, options have unique characteristics. Some of the advantages of using options include as a hedging instrument for investment in the capital market and completing the risk and return spectrum (Baruno & Sembel, 2014).
In Indonesia, options trading were first conducted on October 6, 2004, at that time it was managed by the JSX (Tandelilin, 2017). However, the options market in the Indonesian capital market has not run since 2010 (Dewi & Ramli, 2019). Whereas options are one of the important instruments in the capital market. So in this paper, if the options market in Indonesia is running again, the author wants to show whether stock options in Indonesia generate profits for the seller (writer) and the buyer (taker).
To see whether options in the Indonesian market provide an attractive yield spectrum for investors, both for option writers or put option takers, it is necessary to establish a product valuation infrastructure. For option products, the Black-Scholes formula can be used as a starting point for the initial assessment. Options exchanges such as CBOE, HKEX, and NSE use this Black-Scholes model to price options. Then the Black-Scholes formula is combined with three historical volatility models. With this paper, it is hoped that the Indonesian capital market will be able to play a greater role in the development of the national economy and the movement of business activities in the real sector.
Research Methods
This study uses four stock samples, namely PT Astra International Tbk (ASII), PT Bank Central Asia Tbk (BBCA), PT Indofood Sukses Makmur Tbk (INDF), and PT Telekomunikasi Indonesia Tbk (TLKM). The shares were taken by using judgment sampling technique. This technique is used because the researcher has certain considerations that are tailored to the research objectives. ASII, BBCA, INDF, and TLKM were chosen because these shares are the underlying stock of options trading on the Indonesia Stock Exchange and have a large market capitalization in Indonesia (Saham, 2020). As underlying stocks, these four stocks can be a reflection of stock option trading in Indonesia. Based on the predetermined data sample, historical data for the closing price of three minutes was obtained from February 28, 2020 at 09.30 to May 21, 2021 at 15.00 for each share. The data is sourced from investing.com.
With the option specifications as in the table above, options are calculated every month and start from March 2020 to May 2021. Thus, in this study there were 15 sample options. The signing or sale of KOS is carried out on the trading day before the beginning of the following month. For example, for KOS March 1, 2020, the contract is traded on the last day of February, which is February 28, 2020.
Option price calculation uses the Black-Scholes-Merton (BSM) model. The determination of option prices based on the Black-Scholes-Merton model in Indonesian options is influenced by several variables, such as the underlying price, strike price, dividends, interest rate, and volatility. In this study, the underlying price used is the Weighted Moving Average (WMA) price. The strike price used consists of 15 strikes, namely 7 in-the-money (ITM), 1 at-the-money (ATM), and 7 out-of-the-money (OTM). This strike price calculation uses the interval guideline in accordance with the provisions of the Indonesia Stock Exchange. Then, volatility is calculated using three methods, namely Standard Deviation (SD), Mean Absolute Deviation (AR), and Zero Mean (ZM).
In this study, the dividend used is the 5-year average dividend yield sourced from investing.com and adjusted for each stock. The 2020 option uses the 2015-2019 average dividends, while the 2021 option uses the 2016-2020 average dividend.
The determination of the interest rate follows the average Jakarta Interbank Offered Rate (JIBOR) with a one-month tenor issued by Bank Indonesia and in effect when the option contract is traded. Then, this JIBOR interest rate is assumed to be constant for the duration of the option contract. JIBOR used is sourced from https://www.bi.go.id/en/statistik/indikator/IndONIA.aspx.
Weighted Moving Avarage(WMA)
In Indonesian options the WMA is updated every 15 minutes based on the previous 30 minutes of stock price data. WMA is calculated using the three-minute share price. For example, the closing price of ASII which is used to calculate WMA starts from January 1, 2020 at 09.00. Since WMA appears once every 15 minutes, it can be determined WMA for the first period which is valid from 09.31-10.45 and is calculated as follows:
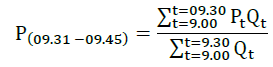
Where,
Pt=stock price in period t
Qt=transaction volume in period t
Then the second period WMA (09.46-10.00) can be calculated in a similar way. WMA calculation on this first trading day is carried out until the end of trading time. On the second trading day and the following days, the WMA is also calculated in the same way as the first trading day and starts at 09.00.
The following is an example of the WMA calculation results presented in a chart of ASII stocks.
In this study, volatility is calculated using the intraday system Figure 1. This is because intraday volatility demonstrates strong persistence and forecasting in both the price market and the index market (Chan, 1991). In calculating this volatility, there are three parameters that need to be considered. First, the baseline period used in the study was 15 minutes. Second, the number of periods that count is 21 trading days. Third, the number of periods in one year used is 225.

Figure 1: Volatility.
In this study, the log return is calculated based on the WMA value. The calculation of the WMA log return is carried out in a compound and continuous manner for each period. The log return is calculated for each period by the following formula.
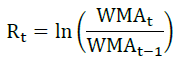
ln = natural log
 = WMA price period t
 = WMA price period t-1
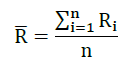
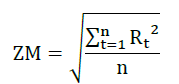
Furthermore, the volatility is calculated by three methods, namely standard deviation, mean absolute deviation, and zero mean.
Standard Deviation Method:
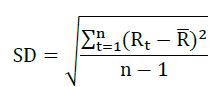
Where,
Mean Absolut Deviation Method:
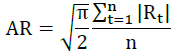
Zero Mean Method:
The final step in calculating volatility is to annualize the Historical Volatility (HV), by multiplying by the root of 252 (the number of trading days in a year). The following is an example of the volatility calculation results displayed in the graph.
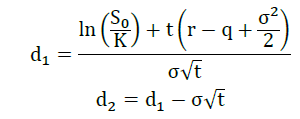
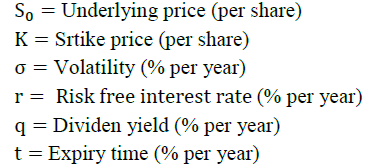
Formula Black-Scholes yang dipergunakan adalah formula yang disesuaikan untuk nilai opsi saham dengan deviden yield. Dividen yield ditambahkan oleh Merton dalam Theory of Rational Option Pricing (Merton, 1973). This formula is known as the Black-Schole-Merton model Figure 2.

Figure 2: Option Price For Black-Scholes-Merton Model.
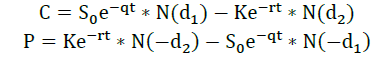
Where
Information
There are three options pricing models used in this study. The first model is an option price model based on the historical volatility standard deviation. The second model is the option price model based on the historical volatility of the mean absolute deviation. The third model is an option pricing model based on zero mean historical volatility. The following is an example of the result of calculating option prices based on the standard deviation model.
Return Analysis and Winning Rate
In this study, the yield is based on two actions, namely the option to exercise or resell. Investors can carry out these actions; investors must provide a margin guarantee (as a writer) or pay a premium (as a taker). The premium is the option price paid in the stock option contract agreement. While the margin or writer's guarantee fund is calculated based on the rules used by the CBOE.
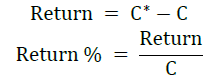
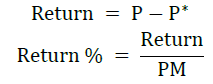
Supposing that the call option premium is denoted by C and the put option premium is denoted by P. The current call option price is denoted by C* and the current put option price is denoted by P*. By reselling options, investors can earn returns calculated in the following ways.
• When the stock goes up, the price of the call option also goes up. Then the taker call can sell the option and have the following yield.
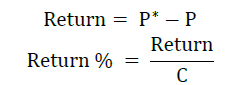
• When the stock goes down, the price of the put option goes up. Then the put taker can sell the option and have the following yield.
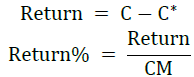
• When the stock falls, the price of the call option also falls. Then the writer call can sell the option and have the following yield.
• When the stock goes up, the price of the put option goes down. Then the put writer can sell the option and have the following yield.
Then the value of the return that has been obtained is averaged every month for each strategy and how much profit (winning rate) is calculated each month. The potential winning rate by exercising or reselling is obtained by calculating how much a position is profitable in a strike each month. If the profit is given a point of 1 and if it is not given a point 0. Thus, the total potential profit of the taker and writer can be obtained in the put and call options.
Yield with Option Action Executed
Once the investor taker exercises, when S>K the taker gains and the writer loses. When S<K the taker loses and the writer gains, and when S=K then both break even. If the taker investor is diused, the taker loses and the writer gains at the premium. When the investor resells the option at the current market price, the taker makes a profit. When the current market price is greater than the premium paid, while the writer loses in that condition. The following is an example of the results of a yield analysis.
The analysis of the return on call options trading on ASII shares shows takers have an overall average return of 5.3%. Based on trikes 1-15, the largest average yield occurred in October 2020, which was 553.6%. Meanwhile, based on periods 1-15, the largest average yield occurred on strike 7, which was 19.2%.
The results of the analysis of the potential winning rate of model 1 of ASII stock call options, takers have an overall winning rate potential of 84 times. Based on trike 1-15, the highest potential winning rate occurred in May and October 2020, which was 15 times. Meanwhile, based on the period 1-15, the highest potential winning rate occurs in strikes 1 to 7, which is 9 times.
Yield by Resell Option Actions
In this study, the calculation of returns is based on the actions of investors (takers or writers) who resell their stock options at the latest prices in the options market during the option period.
The results of the analysis of the return on call options trading on ASII shares, takers have an overall average return of 32.4%. Based on strategies 1-15, the largest average yield occurred in November 2020, which was 445.4%. Meanwhile, based on periods 1-15, the largest average yield occurred on strike 15, which was 125.9%.
The results of the analysis of the potential winning rate of model 1 of ASII stock call options, the taker has a potential winning rate of 27549 times. Based on strategies 1-15, the highest potential winning rate occurred in October 2020, which was 3819 times. Meanwhile, based on the period 1-15, the highest potential winning rate occurred in strategy 1, which was 2442 times.
Results and Winning Rate Statistics Test
Hypothesis Testing Average Yield
Testing the average return between takers and writers uses an independent sample t-test and is carried out with the help of the SPSS program. To find out the two samples, namely takers and writers, see Levene's Test for Equality of Variances. If the p-value > 0.05, then the population variance of the two samples is homogeneous. Meanwhile, if the p-value 0.05 then the variance of the population of the two samples is not homogeneous (Sujarweni, 2014: 99). If the population variance is homogeneous, the test criteria are based on the value of sig. (2-tailed) which uses the assumption of equal variance assumed; otherwise it is based on the value of sig. (2-tailed) which uses the assumption of equal variances not assumed.
With a significance level of 5%, the hypothesis used in each test is as follows:
Ho: There is no difference in average returns between takers and writers.
Ha: There is a difference in average returns between takers and writers.
The decision to test the hypothesis is based on the value of sig. (2 tails). If sig.(2 tailed) > 0.05 then Ho is not rejected and if sig.(2 tailed) 0.05 then Ho is rejected. The following is an example of an average hypothesis test output result.
From the results of the difference test or t test, it is found that the four hypotheses are acceptable which means that there is no difference in the average yield between takers and writers in call options. However, when viewed directly between takers and writers, the average difference is quite large. This is acceptable because the entire writer call yield range is still within the taker call yield range. For example, ASII stocks for model 1 yields, taker call positions have a range (-0.9939; 5.5363) and writer calls have a range (-0.5766;1.0754). This is what causes the results of the Difference Test of yields to accept Ho, or it means that the two yields are almost similar. The results of the other two population averages from the three models on call and put options with exercised and resold actions on ASII, BBCA INDF, TLKM shares also showed the same results.
The Two-Sample Proportion Hypothesis
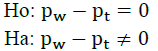
Testing the potential winning rate between takers and writers uses a two-sample proportion test and is carried out with the help of Excel. In this study, a two-way hypothesis test was used. For example,  represents the potential winning rate taker and
 represents the potential winning rate writer, then the hypothesis used is as follows.
With a significance level of 5%, the decision is based on the p-value. Ho is not rejected if the p-value > 0.05 while Ho is rejected if the p-value 0.05. The following is an example of the results of the two-sample proportion test.
Based on the results of the two-way sample proportion test, it was found that the p-value <0.05. So Ho for all treatments is rejected. This means that the taker call and the writer call have different potential winning rates in the exercised call options.
The results of the test of the proportion of two other samples from the three models on call and put options with actions being exercised and resold on ASII, BBCA INDF, TLKM shares also showed the same results.
One Sample Proportion Hypothesis Test
The potential winning rate test with the one sample proportion hypothesis test is used to test whether the proportion of a sample is the same as the desired value. This test is done with the help of Excel. The value of the proportion you want to show is 50%. For example, p represents the potential winning rate of the sample; the hypothesis used is as follows (Anderson, Sweeney & William, 2011).
Ho: p=50%
Ha: p≠50%
Ho: p≥50%
Ha: p<50%
Ho: p≤50%
Ha: p>50%
Hypothesis 1 was used for a two-way test while hypotheses 2 and 3 were used for a one-way test.
With a significance level of 5%, the decision is based on the p-value. If p-value > 0.05 then Ho is not rejected. If the p-value 0.05 then Ho is rejected. The following is an example of the results of the one-sample proportion test, namely the test on model 1 of the exercised call option.
Based on the test results, it was found that Ho in all treatments was rejected. This means that taker calls and writer calls on ASII, BBCA, INDF, and TLKM stock options do not have a 50% winning rate proportion. Furthermore, in the second test, it is shown whether the proportion of the winning rate is more than 50% or not.
The second test is carried out in one direction (1-sided). This test is carried out in two cases. The first case is to show whether the proportion of the winning rate is less than 50% and the second case is to show whether the proportion of the winning rate is more than 50%. The following is one of the results of the one-way sample proportion test, namely the test on model 1 of the exercised call option.
The results of the one-sided hypothesis test between case 1 and case 2 support each other. So it can be concluded that in ASII, BBCA, INDF, and TLKM stock options, the taker call has a winning rate proportion of less than 50%. Meanwhile, the writer call position has a winning rate proportion of more than 50%. This means that the potential for a writer call winning rate is greater than a taker call.
The results of the test of the proportion of one other sample from the three models on call and put options with actions being exercised and resold on ASII, BBCA INDF, TLKM shares also show the proportion of winning rate takers is less than 50%. Meanwhile, the proportion of winning rate writers is more than 50%. Except for takers on ASII put options exercised on model 2 and BBCA put options resale.
Conclusion
Option prices are affected by several factors. In this study, option prices are influenced by WMA, strikes, dividends, interest rates, and volatility. From buying or selling options, a return is obtained. The results of the analysis of the actions of investors choosing positions, exercising or reselling options with three volatility models, the following conclusions are obtained:
1. Options provide benefits for both takers and writers.
2. The results of the study show that the returns on the exercised call and put options indicate that there is no significant difference in average returns between takers and writers.
3. The results of the study show that the returns on call and put options that are resold indicate that there is no significant difference in average returns between takers and writers.
4. The potential winning rate between takers and writers is different in call and put options, whether exercised or resold.
5. The majorities of potential winning rate writers are greater than takers in call and put options, both exercised and resold options.
References
Anderson, D.R., Sweeney, D.J., Williams, T.A., Camm, J.D., & Cochran, J.J. (2016).Statistics for business & economics. Cengage Learning.
Black, F. and Scholes, M. (1973) ‘The pricing of options and corporate liabilities’, Journal of Political Economy, 81(3), 637657.
Merton, R.C. (1973) ‘Theory of Rational Option Pricing’, Bell J Econ Manage Sci, 4(1), pp. 141183.
Tandelilin, E. 2017. Pasar Modal Manajemen Portofolio dan Investasi. Depok: Kanisius.