Research Article: 2019 Vol: 23 Issue: 1S
A Formal and Informal Rural Credit Accessibility of Ethnic Minority Households: Empirical Study in Vietnam
Do Hong Nhung, National Economics University
Michel Simioni, MOISA INRA University of Montpellier
Phan Thi Thanh Huong, MOISA INRA University of Montpellier
Dinh Tran Ngoc Huy, Banking University HCM city Vietnam
Tran Huu Y, Vietnam Bank for Social Policies
Abstract
The rural credit market plays an important role in poverty alleviation in Vietnam, especially in rural and mountainous area. Yet, little if anything is known about the formal and informal credit market for ethnic minority households. The paper, therefore, contributes to the microfinance literature by presenting an empirical analysis of the gap in rural housesholds’ accessibility to credit of different ethnic groups. More specifically, we compare factors affecting credit demands in rural area and ethnic groups. The lack of attention to the credit demand in the previous studies of credit rationing leads to a problem that the magnitude of credit rationing in the formal credit market is likely to be overestimated (Kochar 1997). For this purpose, while other studies use logit model, we employ a new methodology of random forest (RF) based classification and decision tree to analyse the formal and informal rural credit market and uncovered the factors influencing credit accessability of ethnic groups in rural area. This approach will bring more accurate projections and measurements of the gap in credit accessibility of King and minority groups. Using data of the Vietnam Access Resource Household Survey (VARHS) 2014, our empirical results show that land ownership and household’s labour size positively correlate with rural credit accessibility. In contrast, those with saving account acquire less credit from both formal and informal market. This suggests that if a household possesses production inputs, the demand for capital increase to make effective use of these inputs, In contrast, family have capital prefer using internal resources than those on financial market. Moreover, it is interesting to note from our model that poorer rural family in Vietnam have better chance to acquire formal credit and lower education level ones have less credit from informal market. It may imply that both poor and lower education households heavily depend on government’s subsidies which are provided through formal markets to fulfil their needs for capital. Finally, the Kinh group has higher income and therefore this group has more advantage to obtain credit from both formal and informal market. However, insight into the formal market, minority group has better chance to get credit from the Vietnam Bank of Social Policy (VBSP).
Keywords
Ethnic Minority, Rural Credit, Micro Credit, Household Income, Outreach, Vietnam.
JEL Classifications
G21, O17, Q14.
Introduction
Vietnam has achieved good economic growth and poverty reduction over the past two decades. The poverty rate reduced significantly from 58 percent in 1993 to 20 percent in 2004 and 15 percent in 2010 (Nguyen, 2012). However, there is still a gap in living standards between the Kinh majority and ethnic minorities.
In Vietnam, there are 54 ethnic groups, of which the Kinh is the major group which accounts for nearly 86 percent of the total population (World Bank, 2012). Although the ethnic minorities’s population represents only 15 percent of Vietnam’s population, poverty is concentrated among these ethnic groups which make up 60 percent of the poor. (Bank, Country Partnership Framwork for Vietnam, 2017). The proportion of minorities among the poor increased from 29 percent in 1998 to 47 percent in 2010. There was still about 66 percent of ethnic minorities living below the poverty line and around 7 percent living below the extreme poverty line in 2010. By contrast, the figures for the Kinh majority population were about 13 percent and 3 percent, respectively (World Bank, 2012). Moreover, most of the poor and ethnic groups live in rural and mountainous areas. This area populated 82 percent of the near poor and 84 percent of those below the 40th income percentile.
In order to help the poor increase their income and living standard, an improvement for credit accessibility is highly suggested. Credit is essential for households to develop their business and increase their income (Eswaren & Kotwal, 1989); Urdy, 1990). For example, providing access to borrowings that can be put to productive uses can allow farmers and rural households to build economies of scale in production and generate the profits necessary to lift themselves out of poverty. Diagne et al. (2000) claim that access to credit impacts household welfare in at least two main ways. It increases households´ risk bearing capacity and enables long term investments (Camille Saint-Macary & Manfred Zeller, 2012)). For rural families, credit can allow them to promote agricultural production and transformation (Eswaran & Kotwal, 1989) Urdy, 1990). On the other side, Guirkinger & Boucher (2007) proves that 27% loss of agricultural output related to credit constraints in rural Peru. (Zeller, 2012)
In developing countries, the economic choices of poor households are often limited due to the inefficient financial markets (Banerjee & Duflo Esther). A key issue is the extent to which households can access to financial services, particularly in the formal sector. Throughout the developing world, the establishment of microfinance institutions is a typical response to fill a gap on formal financial market. These institutions, many of which work on a not-for-profit basis, operate at the grassroots level providing small loans to people who otherwise would not be served by formal financial institutions (Morduch, 1999). Although the microfinance institutes have been found to be effective in many settings, they have been criticised for not being able to reach the very poor and its cost-ineffective (Robert Cull, A sli Asli Demirgüç-Kunt and Jonathan Morduch, 2009). An alternative approach to correcting for the failure of formal financial institutions to reach the poorest and most vulnerable is for the government to support credit access for these households. In this article, we focus on the gap of credit access on rural finance between Kinh group and ethnic minority. We analyse how household characteristics affect the probability and amount of credit acquired by ethnic groups. We provide a better insight into the reasons for the gap between Kinh and ethnic minority at household level. This is important for evaluating the current outreach of the microfinance institutions and for improving credit accessibility in Vietnamese rural areas. Reportedly, very few empirical studies have so far dealt with the determinants of a household access to credit in the ethnic minority region (Putzeys, 2002; Ninh, 2003).
In comparison to the previous studies, this study will has two different features. Firstly, this paper contributes to the rural credit literature by presenting an empirical analysis of the impact of formal and informal credit in Vietnam which emphasizes the gap of credit access between the Kinh and other ethnic minority groups. Secondly, it uses the random forest and decision tree to forecast and evaluate the impacts to credit accessibility. Therefore, this study provides a different way of measuring the access of credit and thereby advances our projection capacity which is quite different with traditional method used by most recent papers such as logistics.
The paper is structured into five sections. Section two focuses on background information on rural finance and ethnic minorities in Vietnam. Section three presents literature review of influential factors on credit accessibility to rural households. It will be followed by the data and methodology used to analyse the household characteristics, which potentially influence the probability of being credit rationed. Finally, the empirical results and some key policy implication to further the allocation of rural credit in Vietnam and develop the credit market for ethnic minority group are discussed in the last two sessions.
Literature Review
Arguably, the success of credit provision for poverty reduction depends on the available credit that poor households can access on formal and informal markets. In turn, the credit accessibility will be determined by both demand and supply of rural credit. While the credit demand depends on households’ decisions on whether they want to borrow and how large the loans are, the credit supply is an outcome of the credit rationing policy of the financial institutions.
While many studies on credit accessibility focus on factors affecting the supply of rural credit, this paper will emphasize the determinants of credit approachability from the demand side. In fact, rural and disadvantage groups may have lower demand for the loan due to the typical characteristics of these rural and minority families. Specifically, these groups earn a very low income, even below the poverty line. They only have limited access to infrastructure, education, health services and non-farm employment. Empirical evidence shows that minority group is 12 percent less likely to hold wage jobs than the Kinh & Hoa ethnic groups. Their access to sanitation and the rates of enrolment in upper secondary school are also lower than other groups (Nguyen, 2012). The low accessibility to production inputs diminishes their need to credit. A depth analysis of rural and minority householders’ characteristics can, therefore, enlighten obstacles to approach the least favourite market for financial suppliers and policy makers.
Previous studies have been identified a number of key factors determining rural and minority households’ overall demand for credit. These factors can be categorized into four following components: (1) demographic factors, (2) socio-economic factors, (3) cooperation development factors and social network factors, and (4) other factors.
Regarding the demographic component, Biyase & Fisher (2017) have shown that the educational level, occupation and income of household heads are positively correlated with household loans in South Africa. It means that the above three factors have strong influence on the probability of one Households can get a loan approval. Other factors like age and education background also play an important role in narrowing the gap between rural families and formal credit. Hussien (2017) argued that the older families’ head are, the more experience, knowledge and network is built up. They, therefore, can improve their family’s outputs by efficient economic decisions and sequentially credit approval from commercial banks. As a matter of fact, the probability of households with successful credit history to take on new loans is also higher than other households (Yehuala, 2008; Dube et al., 2015). Therefore, minority and disadvantage groups often ignore the formal credit when they believe that their probability to get loan approval from the commercial banks is extremely low. In contrast, the impact of the number of family’s members in working age has inverse relationship with credit accessibility. These families have more resources for their production which will reduce the need for production expenses and capital (Yehuala, 2008; Dube et al., 2015).
For socio-economic component, Sisay Yehuala (2008) pointed out that the size of production is correlated with the capital for rural families. This is the same problem faced by small and medium enterprises. Banks and other big financial institutions may be not willing to lend their money to small sized businesses due to the high risk and transaction costs. The difficulty to obtain credit from the banks discourages farmers and minority groups to make demand for this formal capital. Other factor inputs for production like land, size of cattle herd can increase the credit demand and improve the chance to get credit approval (Dube et al., 2015). These authors believed that the larger land size and cattle herd require higher cost of labours and production. Thus, the families may have higher demand for credit. However, Yadev (1992); Amjad & Hasnu (2007) suggested that the demand for credit first increase, then decrease in according to the increasing size of land and cattle herd. Credit history also positively impacts on the demand for credit. According to Dube et al. (2015), rural families with broaden experience in borrowing money from commercial banks are likely to be in favour of this capital in the future. Finally, low demand for credit can be caused by attitude of rural households toward risk. Study by Yehuala (2008) shows that farmers tend to be risk averse. Unpredictable losses from crops are generally high due to insect infestation and natural disasters. They, therefore, feel hesitate to venture into seasonal crops even if credit is available on the market.
In the cooperation development and social network category, empirical evidence shows that members of a cooperative can enhance their credit accessibility. While Paxton (2000) found joining a cooperative is the first condition to access to formal credit in Mali, Yehuala (2008) blames the policy for making individual producers disadvantageous. In supports to the former view, Konare (2001) claims that preferential loans commonly targets at cooperatives. Rural household, therefore, participate in these organizations to be able to access to these loans.
There is other factor also affect the demand for credit. Total savings or the total value of liquid assets relative to production was identified as an important factor determining household’s overall need for credit (Vuong, 2012). Covariate and/or idiosyncratic shocks would also affect the overall demand for credit. High interest rates and other transaction costs including tedious paper work, bureaucratic loan processes associated with formal loans (Foltz, 2004), collateral risk (Boucher et al., 2007), asymmetric information & political reasons (Zander 1994), and the availability of formal credit institutions (He, 2007; An & Ren, 2005) have been identified as the main obstacles to the demand for formal credit markets.
Methodology
Data
This paper relies on two data sets from the VARHS, which were conducted by the ILSSA in 2012 and 2014 covering 3530 households for which data was available for both years, including 2869 of Kinh and 661 ethnic minority families. The 12 provinces (Ha Tay, Nghe An, Khanh Hoa, and Lam Dong, Dak Lak, Dak Nong, Lao Cai, Dien Bien, Lai Chau, Phu Tho, Quang Nam, and Long An) which were all initially surveyed include the 466 communes that make up the VARHS panel. The ILSSA survey is not nationally representative, but it is representative for rural households in the 12 provinces under study. They cover a lot of the variation in geographical and socio-economic conditions present in Vietnam, including regional differences between the north, centre and south of the country.
The sample design of 2012 and 2014 VARHS follows a method of classified random group sampling in all rural provinces of Vietnam. Among each stratum, communes were selected randomly as a primary sampling unit. The number of communes per stratum is proportionate to the population. The number of selected communes in each VARHS is 466. In each commune, about seven households were selected randomly.
Data on credit rationing were collected using very detailed questionnaires. Information on household and commune categories was collected and then aggregated into panel per household. The samples of 2014 VARHS are presented in Table 1 below:
| Table 1 Number Of Provinces | ||||
| No | Province | District | Communes | Households |
| 1 | Ha Tay (Ha Noi 2) | 14 | 71 | 589 |
| 2 | Lao Cai | 9 | 28 | 295 |
| 3 | Phu Tho | 13 | 49 | 385 |
| 4 | Lai Chau | 6 | 34 | 320 |
| 5 | Dien Bien | 9 | 33 | 317 |
| 6 | Nghe An | 20 | 69 | 228 |
| 7 | Quang Nam | 13 | 44 | 338 |
| 8 | Khanh Hoa | 8 | 29 | 108 |
| 9 | Dak lak | 14 | 41 | 350 |
| 10 | Dak Nong | 8 | 35 | 307 |
| 11 | Lam Dong | 10 | 24 | 78 |
| 12 | Long An | 14 | 43 | 333 |
| Total | 138 | 500 | 3,648 | |
| (Source: VARHS 2014) | ||||
The ILSSA survey covered a large variety of topics related to land, labour and credit of households. In this research, we rely on the credit component, including a number of instructive questions on household resources in order to obtain the loan and full credit history of households during the recent past. The purpose of this part of the survey was to clarify the functioning of rural credit markets in Vietnam and to assess the extent to which credit rationing constrains rural area and ethnic minority groups. Questions covered issues such as (i) number of loans actually received, including information on amounts involved, loan terms and sources of credit, (ii) various other relevant background such as the criteria of the households, use of loans, collateral requirements etc.
Variables
Dependent variable (income of household)
The relationship between independent and dependent variables are estimated by logistic model with the following independent variables.
Independent variables
The independent variables represent impacting factors of minority groups’ income. Variables representing social factors are typically non-continuous, thus they are encoded as 0-1 while many papers applied linear function to assess factors impact to credit rationing (Nguyen, 2012; Phan, 2012) (Table 2).
| Table 2 Independent Variables | |
| Variables | Interpretation |
| Age | Age of household head |
| hh_size | Size of household |
| EthnicMinority | 1 = Kinh ethnicity |
| EthnicMinority | 0 = other ethnic groups |
| NaturalDisasters | 1 = Affected by disaster |
| NaturalDisasters | 0 = Unaffected by disaster |
| GenderID | 1 = Household head is male |
| GenderID | 0 = Household head is female |
| AreaTotal | Land size |
| MarriedID | 1 = Household with married couple (alive) |
| MarriedID | 0 = Household without married couple |
| SectorID | 1 = Household in urban areas |
| SectorID | 0 = Household in countryside |
| PoorID | 1 = Poor households |
| PoorID | 0 = Not a poor household |
| DepositID | 1 = Household with saving account |
| DepositID | 0 = Household without saving account |
| OwnLandID | 1 = Household with Registration book |
| OwnLandID | 0 = Household without Registration book |
| LoanTotal | Total value of the loan |
| LoanTotalID | 1 = Household with loans |
| LoanTotalID | 0 = Household with no loans |
| LoanVBSP | Total value of the loan at VBSP |
| LoanVBSPID | 1 = Household with loans by VBSP |
| LoanVBSPID | 0 = Household with no loans by VBSP |
| LoanVBARD | Total value of the loan at VBARD |
| LoanVBARDID | 1 = Household with loans by VBARD |
| LoanVBARDID | 0 = Household with no loans by VBARD |
| LoanFormal | 1 = Household with formal loans |
| LoanFormal | 0 = Household with no formal loans |
| LoanInFormal | 1 = Household with informal loans |
| LoanInFormal | 0 = Household with no informal loans |
| EducationID | 0 = Household with no education diploma |
| EducationID | 1 = Household with short-term education certificate |
| EducationID | 2 = Household with bachelor or higher diploma |
| NumberGroup | The number groups that the household takes part in |
| (Source: Prepared by the authors) | |
Models and Method
To find impact factors on household’s income and influence factors on credit assess of households, the regression of the model are used, as follows:
Ordinary least squares (OLS) in the linear regression model was used to access the impact on income. The model assumes that the regression E(Y |X) is linear (Trevor Hastie et al, 2009). The regression equation is as follows: Y = α + βXi + ε (1)
Where Yi is per capita income of household i, including Kinh household and ethinic minoriry household, Y represents the income of each family in 2014; Xi is vectors of impacting independent factors, β is a vector of unknown parameters, and variance of errors terms (ε).
After identifying influential factors of households’ income, every level of interaction is present. In order to analyse, one-way analysis of variance (ANOVA) of the form is considered (Trevor Hastie et al, 2009). One-way ANOVA is employed to identify the critical difference between groups of independent variables as impacting factors of households’ income (Micheal, 2012). One-way ANOVA was used to analyse credit assess of household based on the difference impact factors between Kinh group and minority ethinic group, poor households and others, the head of household was educated and others, household was over natural disasters and others.
For testing results of influential factors of household’s income, it is necessary to estimate the level of impact of each factor and household access to credit.
Single classification, regression trees and random forests: Random forest method in decision tree model is used to identify the importance of each factor for household’s access to credit, to build up a logistic model to evaluate the influences of each factor on access to credit. Random forests algorithm (Breiman, 2001) is a classification and regression tree. The Decision tree (DT) based on randomization of split in two at every node. At each node of the tree, single impact factor on credit assess of household. Each node was selected the test that the best divides into its classes. Each demonstrated and labelled by I features with a class name. The decision trees in the forest is suitable for the type of data (Milad Malekipirbazari & Vural Aksakalli, 2015). It is the best algorithm to classify for a partition instance. If the partition instances are a single class, each leaf node is created and labelled the single class. In the method, a forest of uncorrelated trees is built by using classification and regression tree analysis. Trees have some similarities, which used for regression and classification. However, trees also some differences to determine where to split. Steps of random forest procedure are as follows Figure 1:

Figure 1 Demonstration of Random Forest Methodology
Above is the decision tree for credit assessing. The split variables are shown on the branches. The classification is shown in every node. The numbers under the prior nodes indicate classification rates and terminal nodes indicate misclassification rates on the test data. Random forest is better the prediction function. The nodes are demonstrated the partition results, they are the best classification given a dataset (Breiman et al, 2001). Random forest algorithm was used to make sure that all decision trees are not the same (Nam Vu (2016)). The prediction shown credit assess of household is higher (Trevor Hastie, Robert Tibshirani, Jerome Friedman (2008)). Figure 1 show that, at node 1, Loan Total is the best variables to classify probability of credit assess. Therefore, if the household lent in 2012 and its loans were less than 5.500 million dong, its probability to borrow in 2014 was 0.31. DepositID is the second best to classify. The predicted results show that if the household had a deposit in the bank, its probability to assess credit was 0.43.
In the next step, the Gini coefficient will be used to measure the contribution of the homogeneity of the nodes and leaves in the resulting random forest.
Mean Decrease Gini (Mean Decrease Impurity importance (MDI))
To evaluate the importance of a variable Xm, by the weighted impurity decreases p(t)Δi(st, t) for all nodes for predicting Y. The importance of a variable Xm is also estimated by measuring the Mean Decrease Accuracy (MDA) of the forest (Breiman, 2001, and 2002). The values of Xm are randomly permuted all nodes of the forest tree. The averaged over all nodes Nt in the forest, as follows:
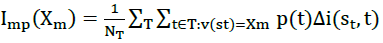 (2)
(2)
When one variable is removed, the regression model returns an accuracy factor. By applying for other variables, which a variable gives the greatest accuracy decrease, the variable is the most important. Therefore, the variable affects to access credit of the household.
Each time a particular variable is used to split a node, the Gini coefficient for the child nodes are calculated and compared to that of the original node. To measure inequality among value of levels of income, the Gini coefficient (Gini index) is used.
Use logistic model how do independent variables impact on credit assess. (Trevor Hastie et al, 2008)
For research which includes non-linear variables (0-1), the Logistic model is used to estimate probability. In the model, dependent variabe Y can be code 0 or 1, with 1 indicating credit assess of household, with 0 indicating no credit. The model P[Yi = 1|xi] shows that the probablity of given valued of factors Xi (i=1, …, n). The purpose of the logit model is ussually to understand of importance factors and to classify individuals. Binary variables are as follows:
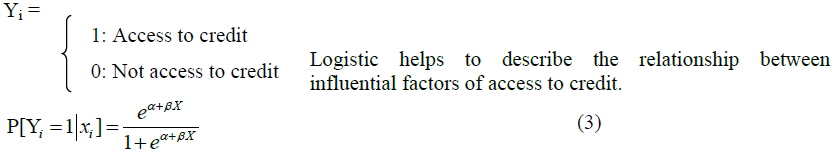
Where Y is access to credit, Xi is vectors of impacting access to credit of households. When estimating the parameters βi, for each specific household we can estimate how credit assess is based on important factors. From there, it is possible to classify credit assess of household with each important factor with a cutoff point. In this case, cut off point is used 0.5. The regression model (3) is the non-linear logistic of X. Logistic model is used to estimate the coefficients as follows:
 (4)
(4)
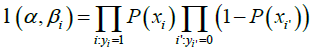
To estimate the parameters βi, the maximum likelihood method is used. The model (4) is used to find out coefficients α and βi via predicting probability of α and  and thus
  are marginal effects to estimate model (3). Therefore, finding α and βi to maximize the rational function.
An algorithm is used to classify the customers into two groups, which are those able to get loans and those unable to do so. Better algorithms should have better classification regarding credit granting decision of banks and minority groups’ access to credit. Credit rationing of the Kinh group and minority groups was compared. To get rid of endogenous variables, the logistic model was used. The model tested whether minority groups’ access to credit is affected by various factors. The marginal effect was estimated from the logistic regression model. In this case, variables can only take on two values, 0 or 1. The marginal effect model for variables shows how P(Y=1) changes variable value from 0 to 1. For each variable, Xi Marginal Effect is: P(Y = 1|X, Xi = 1) – P(Y=1|X, Xi = 0) (Richard Williams, 2017). The results of regression show that based on factors such as the age of the head of household, the member of the household the ethinic household or kinh group, the gender of the head of household, the household lived in rural area or urban area, the household has a deposit or not, the household has own land or not, the household has a member of social organization or not?
Access to credit has an important role for economic development of countryside, especially for minority groups. In Vietnam, access to credit focuses on 2 credit markets. There are formal and informal credit market.
Formal credit markets are understood as credit market constructed by formal institutions. In Vietnam, formal credit is granted mainly by Vietnam’s bank of social policy (VBSP) and Vietnam’s bank of agriculture and rural development (VBARD), which makes up for 2/3 of farmers’ credit (?inh, 2015).
Credit informal market consists of (i) private lending by unrelated individuals and friends charging interest, and (ii) lending from families, relatives and friends carrying zero interest. These two segments will be referred to as ‘private’ and ‘family’ (DERG and CAP).
Results
Over period from 2010 to 2014, the percentage of Kinh households borrowing money increased from 45% to 48% and then reduced sharply to 32% in 2014 while ethnic minority borrowing only fell to 38% in the same year. The number of ethnic minority households being rejected was almost 6 time higher than for the Kinh group. Moreover, the amount of loans per household of the Kinh group was about double that of ethnic minorities (Figure 2 (Source: VARHS (2014)).

Figure 2 The Amount of Loan per Household KINH Group
In this section we look in more detail at the gap between average income of Kinh group and ethnic minority group, VND 2,637,000 and VND 1,161,000, respectively. There are also gaps among the 53 ethnic minorities. The charts show us that Mang, Kho Mu, Lo Lo, Chut, La Hu, O Du, Mong, La Chi, Bru Van Kieu, Co Lao and Xinh Mun groups have the lowest income with less than VND 632,000. On the other hands, the highest income group have VND 1,200,000 per month, almost double compared to the lowest group (Irish Aid, 2015).
Almost 23% of ethnic minority households is poor while the national poverty rate is 7%. Specifically, La Hu, Mang and Chut have a poverty rate over 70%. Ethnic groups with poverty rates over 60% include the O Du, Co, Kho Mu and Xinh Mun followed by La Ha, Khang, Mong and Xo Dang.
Results of Gini Index
Random forests offers a very natural way to rate the importance of variables, since different variables being left out of the trees fitted in our forests are permuted (Aslett, 2013).
For cut-off point is 0.5, Figure 3 shown that owned land area is the most important factor influencing loan accessibility, followed by age, distance to the central area, loans in the past and household size. Other factor such as member of social associations, education, deposit, natural disaster, ethnic minority, poor certificate, gender or marital status do not play important role compared to the mentioned above.

Figure 3 GINI Index
As the result of Figure 1, at 0.5 cut off Loan, Deposit, Area variables are the best nodes to classify. Each node of decision tree structure demonstrated the potential access to credit of household (Figure 3 (Source: VARHS (2014)).
Table 3 confirmed that Ha Tay is ranked first among provinces in the survey for loans offered to households, followed by Phu Tho, Daklak and Dak Nong. Those four leading provinces accounted for 69% of the loan segment while only 8.6% ethnic minority households can access credit in these areas.
| Table 3 Households by Value of Loan Obtained (2014) | |||||
| By province | No of households | Weighted No of loan (%) | Value of loans (mil VND) | Kinh | Ethnic minority |
| group | |||||
| Ha Tay | 188 | 23% | 12,605.80 | 99% | 1% |
| Lao Cai | 39 | 1% | 780 | 14% | 86% |
| Phu Tho | 104 | 19% | 10,389.80 | 90% | 10% |
| Lai Chau | 60 | 3% | 1,570.20 | 14% | 86% |
| Dien Bien | 114 | 5% | 3,014.14 | 30% | 70% |
| Nghe An | 69 | 5% | 2,891.20 | 98% | 2% |
| Quang Nam | 57 | 3% | 1,892.69 | 99% | 1% |
| Khanh Hoa | 27 | 1% | 798.5 | 90% | 10% |
| Dak Lak | 184 | 16% | 9,044.80 | 68% | 32% |
| Dak Nong | 121 | 11% | 6,196.00 | 89% | 11% |
| Lam Dong | 37 | 3% | 1,852.00 | 75% | 25% |
| Long An | 84 | 8% | 4,347.00 | 100% | 0% |
| Total | 100% | 55,382.13 | |||
Figure 4 (Source: VARHS 2014) (Formal loans) shows the formal loan structure in 12 provinces in Vietnam. In northern mountain areas such as Lao Cai, Lai Chau & Dien Bien, the loan amount of ethnic minority accounts for 86%, 88% and 70% total loan respectively, mostly funded by VBSP as the ethnic population in these provinces are widely targeted segments. For the Central Highland areas (Khanh Hoa, Daklak, Dak Nong, Lam Dong) the loan amount of ethnic minority households is from 11% to 32% while the VBSP still dominates the market. The remaining Ha Tay and Long An which are located very close to economic centers has almost no loans to ethnic minority groups.

Figure 4 Formal Loan
In the section, we look in more detail at loans obtained in 2014. It is the most recent year from which data are available, and they provide the best up-to-date picture of the rural credit market in Vietnam. Figure 4 (Formal loans) illustrates some subtle differences between loans obtained from different formal sources in the loan market such as VBARD and VBSP.
In addition, loans obtained from formal and informal source are different between Kinh group and ethnic minority households. The results are as follows Table 4:
| Table 4 Formal and Informal Loan of KINH Group and Ethnic Minority | ||||
| Kinh | Ethnic minority | |||
| 2012 | 2014 | 2012 | 2014 | |
| Formal loans | 57.08% | 71.01% | 73.21% | 66.97% |
| Informal loans | 23.21% | 17.07% | 17.23% | 17.07% |
| Semi – formal | 20% | 11.92% | 9.56% | 15.96% |
| Total | 100% | 100% | 100% | 100% |
Credit is obtained for many purposes, such as consumption and investment. Non-farm activities such as investing in land used right or real estate made up of 73% of volume and is critically important for the development of a market economy and for the efficiency of the economy in general. As land is widely used as collateral in Vietnam, it is therefore of interest to explore any interactions between the credit and land markets (Table 5).
| Table 5 Characteristics of Household | ||
| Use of loan | Households (%) | Loan amount (mil VND) |
| Education expenses | 6% | 3,294 |
| Farm activity | 9% | 5,060 |
| Food | 10% | 5,580 |
| Health expenses | 2% | 1,270 |
| Non-farm activity | 73% | 40,178 |
| Total | 100% | 55,383 |
| Source: VARHS (2014) | ||
Due to unfavourable living conditions in their regions, such as more frequent natural disasters, underdeveloped transportation infrastructure, limited access to education, incomplete credit environment, many minority households have to take loans from informal credit sources instead of formal ones (VBSP, VBARD in their provinces). The informal credit is loans which borrowed from friends, relatives, commercial credit, state-related debt (for example, tax and insurance). Therefore, to assess the influential factors of minority households’ income and their access to credit, it is necessary to include the impact of formal and informal credit, with VBSP and VBARD as two main organizations following government-supported credit program. The result is as follows (Table 6):
| Table 6 Minority Households’ Access to Formal Credit and Informal Credit | ||||||
| Variables | Formal credit | Informal credit | ||||
| dF/dx | P value | dF/dx | P value | |||
| Age_2014 | -0.003605 | 0 | *** | -0.003024 | 0 | *** |
| hh_size_2014 | 0.018512 | 0.00001 | *** | 0.008105 | 0.018028 | * |
| EthnicMinority_20141 | 0.024596 | 0.162934 | 0.029811 | 0.030876 | * | |
| GenderID_20141 | 0.009615 | 0.715566 | 0.007567 | 0.714539 | ||
| AreaTotal_2014 | 0.000002 | 0.000104 | *** | 0.000001 | 0.000925 | *** |
| SectorID_20141 | 0.097395 | 0.001441 | ** | 0.070655 | 0.00119 | * |
| PoorID_20141 | 0.047873 | 0.024454 | * | -0.02162 | 0.151485 | |
| NaturalDisasters_20141 | -0.016791 | 0.291594 | -0.019562 | 0.122419 | ||
| DepositID_20141 | -0.099337 | 0.000002 | *** | -0.079483 | 0.000006 | *** |
| OwnlandID_20141 | 0.083658 | 0 | *** | -0.007307 | 0.637089 | |
| EducationID_20141 | -0.000382 | 0.984595 | 0.009135 | 0.566868 | ||
| EducationID_20142 | -0.018129 | 0.500999 | -0.050116 | 0.006423 | * | |
| MarriedID_20141 | -0.004243 | 0.886426 | -0.052577 | 0.056624 | * | |
| NumberGroup_2014 | 0.034583 | 0.000001 | *** | 0.018231 | 0.00136 | ** |
| Loantotal_2012 | 0 | 0.004492 | ** | 0 | 0.326515 | |
| Distance | -0.004482 | 0.089707 | -0.006886 | 0.003642 | ** | |
| significant at 10%, '*'significant at 5%, '**' significant at 1%, '***' significant at 0.1% | ||||||
| Notes: The regressions include lag variable (loan 2012 and 2014) | ||||||
| The logistic regression model and marginal effect was used. | ||||||
| Source: Estimation from VARHS 2012 and 2014 | ||||||
Table 6 shows that for PoorID and EducationID formal credit is different from informal credit. The coefficients of PoorID and Education in the formal credit regression are positive and significant. These results include marginal effects. But the coefficients of PoorID and Education ID in the formal credit regression are negative and significant. Therefore, non-poor households do not access to informal credit. The same results apply to EducationID. The findings supported by Phan et al. (2013) results.
Based on the results above, the coefficient of Age is negative and significant at the 0.1% level. Indicating that the Age of the household head has a negative effect access both formal credit and informal credit. The results suggest that an increase in age improves access to credit, but when the household head is over 55 years old, their access to credit becomes more and more limited. Regarding access to informal credit, the household head’s age is not an influential factor. In terms of informal credit sources, Kinh households have better access than minority ones, but this ethnicity difference does not have any influence when it comes to formal credit sources. In the research, loans are raised from commercial banks (including VBARD and VBSP). If households meet credit conditions, the bank will lend. However, informal credit is come from the private sector by charging interest or not. Loans are without collateral. Thererfore, minority households are difficult to access credits than Kinh ones. Also shows that for PoorID and EducationID formal credit is different from informal credit. The coefficients of PoorID and Education in the formal credit regression are positive and significant. These results include marginal effects. But the coefficients of PoorID and Education ID in the formal credit regression are negative and significant. Therefore, non-poor households do not access to informal credit. The same results apply to EducationID. The findings supported by Phan et al (2013) results.
Based on the results above, the coefficient of Age is negative and significant at the 0.1% level. Indicating that the Age of the household head has a negative effect access both formal credit and informal credit. The results suggest that an increase in age improves access to credit, but when the household head is over 55 years old, their access to credit becomes more and more limited. Regarding access to informal credit, the household head’s age is not an influential factor.
In terms of informal credit sources, Kinh households have better access than minority ones, but this ethnicity difference does not have any influence when it comes to formal credit sources. In the research, loans are raised from commercial banks (including VBARD and VBSP). If households meet credit conditions, the bank will lend. However, informal credit is come from the private sector by charging interest or not. Loans are without collateral. Thererfore, minority households are difficult to access credits than Kinh ones.
Additionally, although poor households have better access to formal credit, it is harder for them to approach informal sources (the coefficient is not statistically significant). Households with registration books for their land can borrow from banks easier than those without. This factor, however, does not affect their abilities to take loans from informal credit sources. It is also more difficult for households who have saving accounts to take loans from both formal and informal credit sources than those who do not. These results are consistent with Nguyen (2015) and Phan (2013).
The amount of land owned also enhances a household’s ability to access credit, both formally and informally (the coefficients are positive in both testing models). In addition, living areas only affect access to formal credit, as housesholds in urban regions have better access than those in the countryside. This factor does not affect their abilities to access informal credit.
In the model, loan in 2012 is used as lag variable to ensure that the results of logistic regression model are efficient and reliable. If the household loan was an informal one in 2012, it would affect borrowing in 2014. An opposite result is found in the case of formal credit.
Distance to central area is the most important factor influencing loan accessibility. Distance coefficient is negative and significant. The further distance to central area is, the lower credit accessibility will be. But the factor does not affect to assess credit of VBARD and VBSP.
Beside the regession results above, accessing VBSP’s and VBARD’s credit is difference. The results show that ethnic minority groups can access VPSB easier than VBARD and informal sources. Since VBSP has preferential policies for ethnic minority households, the results are consistent with their missions in providing credit to this group. This is also supported by Do and Nguyen (2015).
Table 7 presents the determinants of accessibility to VBSP and VBARD in Vietnam, including marginal effects. The coefficients of EthnicMinority, OwnlandID, EducationID are negative and significant. They show that households who are ethnic minority, owning less land and having lower education will assess VBSP’s credit. Otherwise households are not ethnic minority and more land owned will tend to VBARD’s credit. The findings are totally consistent with the Vietnamese credit policies in reducing poverty and improving mountainous and rural areas in recent years. It is also consistent with Nguyen (2012) and Giang et al (2015)´s results.
| Table 7 Households’ Access to VPSB’s and VBARD’s Credit | ||||||
| Variables | dF/dx | P value | dF/dx | P value | ||
| Age_2014 | 0.002048 | 0.17106 | 0.000016 | 0.990335 | ||
| hh_size_2014 | 0.001205 | 0.90464 | 0.017204 | 0.045008 | * | |
| EthnicMinority_20141 | -0.25696 | 0 | *** | 0.096737 | 0.003344 | ** |
| GenderID_20141 | 0.014855 | 0.81961 | -0.07381 | 0.223717 | ||
| AreaTotal_2014 | -0.000004 | 0.00304 | ** | 0.000001 | 0.190875 | |
| SectorID_20141 | 0.058732 | 0.63308 | -0.01242 | 0.891127 | ||
| PoorID_20141 | 0.28991 | 0 | *** | -0.14255 | 0.000603 | *** |
| NaturalDisasters_20141 | 0.12371 | 0.00101 | ** | 0.055651 | 0.088935 | . |
| DepositID_20141 | 0.028278 | 0.45215 | -0.00572 | 0.863798 | ||
| OwnlandID_20141 | -0.079535 | 0.07179 | 0.19649 | 0.000004 | *** | |
| EducationID_20141 | -0.006559 | 0.88365 | -0.00991 | 0.789191 | ||
| EducationID_20142 | 0.046999 | 0.49966 | -0.00791 | 0.888749 | ||
| MarriedID_20141 | 0.029596 | 0.67578 | 0.13035 | 0.019782 | * | |
| NumberGroup_2014 | 0.016207 | 0.31321 | -0.00367 | 0.787728 | ||
| LoanVBSP_2012 | 0.000009 | 0.000012 | *** | 0.000005 | 0 | *** |
| Distance | 0.012238 | 0.1135 | -0.00072 | 0.920338 | ||
| .' significant at 10%, '*'significant at 5%, '**' significant at 1%, '***' significant at 0.1% | ||||||
| Notes: The regressions include lag variable (loan 2012 and 2014) | ||||||
| The logistic regression model and marginal effect was used. | ||||||
| Source: Estimation from VARHS 2012 and 2014 | ||||||
The EducationID coefficient is negative and significant, suggesting that microcredit programs for education loans are applied in two banks. This implies that poor households and ethnic minority groups tend to receive more formal credit from VBSP and VBARD than from other institutions and from informal credit.
In terms of household characteristics, the Age, hh_size, AreaTotal, MarriedID, LoanID coefficients are all significant and consistent between VBSP and VBARD. The results reflect the characteristics of the formal credit market in the country.
Conclusion
This paper examines different factors which impact the effectiveness of credit outreach initiatives on ethnic minority households ability to access the informal and formal credit sectors in rural Vietnam. Our results show that the income gap between ethnic minority and Kinh households is VND 44 million per annum leading to lower access to rural credit (Nguyen, 2012). This supports the conclusions of Rweyemamu et al. (2003). On the contrary, other studies shows that the chance of getting a loan reduces with household income (Swain, 2007; Del-Rio & Young, 2005). In addition, our result confirms total land owned, household size and being a member of an association significantly affect accessibility to both formal and informal credit markets. Other factors such as education, amount of deposits held in banks, natural disasters, gender and poor certificates do not materially impact loan accessibility. Education factor, however, is proved by Miller & Ladman (1983) and contrary with Phan (2013) in the list of credit outreach. It is therefore necessary to improve economic and social conditions of agricultural areas in order to lower the gap of living standards and income between households of different ethnicities.
Factors with similar effects on access to both formal and informal credit include age, total land owned, membership of an association and distances to the local administrative center. The area of land owned is supported by Phan (2013), Zeller (1994); Pham & Izumida (2002). Lending through a group or association is mentioned as an appropriate improvement for accessibility to a formal loan as it is cost saving tool to solve the problem of asymmetric information which individual lending faces. Rural households residing in areas with direct road access to a town centre are likely to have better chance to access to a loan. In addition, agricultural land ownership positively increases credit demand; therefore, it is appropriate to offer loan to household having larger land. In some extents, formal loan can be replaced by informal loan with more flexibility. With 36% of market segment, ignoring informal credit market may result in a biased assessment of demand of formal credit market.
On the oposit view, our results confirm that the outreach for formal credit is also affected by the following factors: poor certificates, land with a registration book and being a household with historical credit. This can be considered a bias in the selection process, though improving accessibility to microcredit using a poor certificate is arguably a good social policy intervention. In addition, microcredit providers can effectively ration credit to borrowers based on the borrowers’ income level. Moreover, households which are ethnic minority, possess poor certificates, are facing natural disaster and have an historical VBSP loan will have better access to credit from VBSP. On the other hand, ethnic minority groups will face more difficulty in access credit from VBARD.
In addition, the demand for informal credit is also influenced by education, marital status and ethnic minority status. It is proved that the Kinh group has better access to informal loans compared to ethnic minorities. Rural households residing in urban areas have a better chance to obtain informal credit from private lenders, friends and relatives. A flexible informal loan duration can compensate for a high interest rate. Thus, informal credit is more popular for Kinh households which seek funding for trade and consumption.
The above findings highlight two important points in the microcredit literature. First, the ethnic minority groups that have lower income compared to Kinh group will face more credit rationing than Kinh groups in the VBARD. This, however, supports Amin, Rai, & Topa (2003) who concluded that microcredit successfully reached the poor, but was less successful at reaching the venerable in Bangladesh. Their findings show the issue in microfinance researched by Armendariz de Aghion & Morduch (2005) about capital does not appropriate fund to the poor. This also addresses the issue of government needs policy to intervene in their rural credit markets in order to better serve lower income households, which including ethnic minorities. Secondly, our research shows a strong connection between the informal and formal credit sectors and emphasises that both credit sectors play important roles in rural credit market.
Our results propose policy implications with regarding to banking practice which will help to improve households’ accessibility to credit (Phan, 2013) particularly for the ethnic minority groups. First, as ethnic minorities have lower income due to insufficient land and capital, banks and credit institutions should not only provide finance for farming activities but also for non-farm purposes such as job training programs, so borrowers can generate more income from non-farm activities or participate in other labour markets. Secondly, it is suggested that households should actively participate in social associations and improve their education and work skills. This is critical as education and membership of an association add up to creditworthiness for borrowers and work skills improve repayment ability. Therefore, the government should also consider providing incentive programs to attract more investment in ethnic minority area. However, the coexistence of formal and informal credit appears foreseeable. This suggests that any one credit sector can be replaced by the other in the rural credit market (Li et al., 2011). Hence, combination of these two credit sectors into a wellfunctioning rural credit market can effectively improve credit access for rural ethnic minority households.
Due to the limited size of survey, some policy implications are particularly relevant to the survey province but may not be relevant nationwide. This reflects the presumption that informal credit is popular in other regions of Vietnam as well, while formal credit is monitored and restricted by formal lending procedures.
Acknowledgement
We would like to thank MOISA, INRA, University of Montpellier, France, Training and Education Ministry, Vietnam and Central Institute for Economic Management, Vietnam for providing access to the Database. We also acknowledge this research is funded by National Economics University, Hanoi, Vietnam.
References
- Aghion, A.B., & Morduch, J. (2005). Microfinance beyond group lending. Wiley Online Library (2003).
- Amin, S., Rai, A.S., & Topa, G. (2003). Does microcredit reach the poor and vulnerable? Evidence from northern Bangladesh. Journal of Development Economics, 70(1), 59-82.
- Amjad, S., & Hasnu, S. (2007). Smallholders’ access to rural credit: Evidence from Pakistan. The Lahore Journal of Economics, 12(2), 1-25.
- Banerjee, A.V., & Duflo, E. (2007). The economic lives of the poor. Journal of Economic Perspectives, 21(1), 141-167.
- Biyase, M., & Bianca, F. (2017). Determinants of access to formal credit by the poor households. Studia Universitatis Babe?-Bolyai Oeconomica, 62(1), 50-60.
- Boucher, S, R., Carter, M., & Guirkinger, C. (2007). Risk, wealth, and sectoral Choice in rural credit markets. American Journal of Agricultural Economics, 89(4), 991 – 1004.
- Boucher, S. R., Carter, M., and Guirkinger, C. (2007), Credit Constraints and Productivity in Peruvian Agriculture, Working Paper No. 07-005. Department of Agricultural and Resource Economics, University of California - Davis.
- Breiman L. (2001). Random forests. Machine Learning, 45(1), 5-32.
- Camille, S.M., & Zeller, M. (2012). Rural credit policy in the mountains of northern Vietnam: Sustainability outreach and impact. Uplands Conference 2012 ‘Sustainable Land Use and Rural Development in Mountain Areas. Stuttgart, Germany, April (16-18)
- Cull, R., Demirgüç-Kunt, A., & Morduch, J. (2009). Microfinance meets the market. Journal of Economic Perspectives, 23(1), 167- 192.
- Del-Rio, A., & Young, G. (2005). The determinants of unsecured borrowing: evidence from the British Household Panel Survey. Working Paper, 1-37.
- Diagne, A., Zeller, M., & Sharma, M. (2000). Empirical measurements of households’ access to credit and credit constraints in developing countries, Methodological issues and evidence. Discussion paper No. 90, Food Consumption and Nutrition.
- ?inh, P.H. (2015). The impact of formal credit on farm household income in Vietnam. Journal of Economic development, 26(2), 65-82.
- Dube, L., Mariga, T., & Mrema, M. (2015). Determinants of access to formal credit by smallholder tobacco farmers in Makoni District, Zimbabwe. Greener Journal of Agricultural Sciences, 5(1), 034-042.
- Eswaran, M., & Kotwal , A. (1989). Credit as insurance in agrarian economies. Journal of Development Economics, 31(1), 37-53.
- Foltz, J.D. (2004). Credit market access and profitability in Tunisian agriculture. Agricultural Economics, 30, 229-240.
- Hastie, T, Tibshirani, R., & Friedman, J. (2008). The elements of statistical learning (2nd edition), Springer Public, 295-316.
- Kochar, A. (1997). Does lack of access to formal credit constrain agricultural production? Evidence from the Land Tenancy market in Rural India. American Journal of Agricultural Economics, 79(3), 754-763.
- Li, X., Gan, C., & Hu, B. (2011). Accessibility to microcredit by Chinese rural households. Journal of Asian Economic, 22(3), 235-246.
- Malekipirbazari, M., & Aksakalli, V. (2015). Risk assessment in social lending via random forest. Expert Systems with Applications, 42(10), 4621-4631.
- Micheal, J.C. (2012), The R book (2nd edition), John Wiley & Sons, Ltd, 498-536.
- Miller, C.J., & Ladman, J.R. (1983). Factors impeding credit use in small?farm households in Bolivia. The Journal of Development Studies, 19(4), 522-538.
- Morduch, J. (1999). The role of subsidies in microfinance: Evidence from the Grameen Bank. Journal of Development Economics, 60(1), 229-248.
- Nguyen, N.N.N., & Pham, D.C. (2012). The influential factors of An Giang’s agricultural households’s access to credit. Journal of Science and Technology development, 18, 28-39.
- Nguyen, V.C. (2012). Informal credit, usury or support? A case study for Vietnam. The Developing Economies 52(2), 154-178.
- Nguyen, V.H., Shashi Kant., & Virginia MacLaren. (2015). The contribution of social capital to household welfare in a paper-recycling craft village in Vietnam. The Journal of Environment and Development, 13(4), 371-399.
- Paxton, J. (2000). Modeling group loan repayment behaviour: New insights from Burkina Faso. Economic Developtment and Cultural Change,48(3), 639-655.
- Pham, B.D., & Izumida , Y. (2002). Rural development finance in Vietnam: A microeconometric analysis of household surveys. World Development, 30(2), 319-335.
- Pham, T.T, & Lensink, R. (2007). Lending policies of informal, formal and semiformal lenders. Economics of Transition, 15(2), 181-209.
- Yehuala, S. (2008). Determinants of smallholder farmer’s access to formal credit: the case of Metema Woreda, North Gondar, Ethiopia. School of Graduate Studies, Haramaya University.
- Zeller, M. (1994). Determinants of credit rationing: A study of informal lenders and formal credit groups in Madagascar. World Development, 22(12), 1985-1907.