Research Article: 2021 Vol: 24 Issue: 6S
A Comparative Study of Deep Learning Methods for Time-Series Forecasting Tourism Business Recovery from the Covid- 19 Pandemic Crisis
Pannee Suanpang, Suan Dusit University
Pitchaya Jamjuntr, King Mongkut’s University of Technology Thonburi
Abstract
This research aims to present a comparison of deep learning techniques when working with time-series data to predict the recovery and resilience of tourism businesses in Thailand. This type of business generates a lot of income and plays a role in the development of the country. However, Thailand's tourism industry although has its identity and strengths, but it cannot survive the impact of the COVID-19 epidemic. The biggest impacts of COVID-19 to tourism business are unemployment of the population and the slowdown in national development. Recognizing the importance of tourism as mentioned above, the researchers compared the functioning of three deep learning methods which consists of Vanilla LSTM, Bidirectional LSTM, and Stacked LSTM, when used with time-series data during the year 2020-2024 to planning the rehabilitation of Thailand's tourism business. The experimental results show that, Bidirectional LSTM is the most effective deep learning model when working with time-series data compared to Vanilla LSTM and Stacked LSTM, by considering average error of the Bidirectional LSTM when working with time-series data, which is equal to 5.85916575 which has a lower average error value less than that of the average error of Vanilla LSTM and Stacked LSTM, which are equal to 5.91683425 and 5.92949325 respectively. The results of this research can be concluded that, the deep learning with Bidirectional LSTM approach is the most efficient choice for working with time-series data, when applied to 5 years data and compare with the Vanilla LSTM and Stacked LSTM. In addition, this research also shows a good practice to implement deep learning to the tourism business.
Keywords
Deep Learning, Time-Series, Long Short-Term Memory (LSTM), Tourism forecasting, Covid-19
Introduction
The virus COVID-19 pandemic crisis impacted the travel tourism industry around the world as well as social and economic, particularly in the developing world (Jamal & Higham, 2021; Skare et al., 2020). The tourism practitioners will have an exceptional impact on the tourism industry, which lack literature studies about the impact of the pandemic on the tourism industry (Skare et al., 2020; Suanpang et al., 2021a, b). The tourism industries were most negatively affected by the COVID-19 pandemic, leading to a lockdown in many countries, widespread restrictions on travel, airport closures, national broader closures and in the case of Thailand, the number of international tourist arrivals was cut by 67 million during the first quarter of 2020 (2020, Q1). The lockdown in many of these countries has put millions of tourists, hospitality, and workers out of work, facing a financial crisis, debt, and poverty (Rastegar et al., 2021). This decrease indicates a loss of roughly US$80 billion in tourism revenue, associated with the same period in 2019 (UNWTO, 2020). This associated with the most recent research studies by the World Travel and Tourism Council (WTTC) lists up to 75 million workers at current job risk and a job lost unexpectedly. Because of the COVID-19 pandemic and travel tourism GDP loss in 2020 of up to US$ 2.1 trillion.
With the emerging and high contribution of tourism driving the country’s economy especially in Thailand (Jermsittiparsert & Chankoson, 2019; Suanpang & Jamjuntr, 2021). Thailand is one of the most popular destinations which has beautiful natural resources, historical and high value of hospitality of the people (Suanpang & Jamjuntr, 2021). From the statistics of Thailand, the first quarter of 2020 was estimated to directly contribute 5.65 per cent to the Gross Domestic Product (GDP) in Thailand. The COVID-19 pandemic in Thailand leads to international tourist arrivals being currently prohibited (Suanpang & Jamjuntr, 2021). With this circumstance, the tourism industry must adapt to build confidence among tourists about the healthcare safety from the COVID-19 thus creating a new normal. Tourism in Thailand is emerging into a new normal focusing on domestic travel which will be the first choice, short trips, driving to unseen places, less crowded more personal travel and increase quality and value of spending per person. There are three important tourism models that the Thai Government is supporting in the new normal (1) health & wellness tourism (2) gastronomy tourism (3) community based creative tourism (Suanpang, 2021a, 2021b). This is becoming the tourism business in Thailand and should be reset and forecast future scenarios to plan for the re-shaping and re-branding of tourism again after COVID-19. Both tourism business and government organizations rely on recovery forecasting when preparing a resilience and recovery plan (Skare et. al., 2020). From a literature search, it was found that many studies on tourism demand forecasting (Suanpang & Jamjuntr, 2021) by using statistical approaches, such as time series, econometric, and artificial intelligence (Song et al., 2019). With the advances in artificial intelligence (AI), especially ‘deep learning’ techniques for providing accurate tourism demand forecasting (Pouyanfar et al., 2018; Law et al., 2019). The deep network architecture extends the artificial network models to include two nonlinear processing layers which have proven effective for various applications. The success is attributed to their built-in feature of engineering capability, which motivates them to break those two barriers simultaneously within the machine learning process (Law et al., 2019). The contextual information for time series analysis, deep network architectures also have certain advantages in flexible yet has discriminative non-linear relationships. Recurrent Neural Network (RNN), Long-Short-Term-Memory (LSTM) and Attention Mechanism are capable of handling and learning long-term dependencies, these properties make deep learning an alternative solution to tourism demand forecasting (Law et al., 2019).
In this paper, we aim to comparative study three deep learning methods to forecast the trends of tourism business recovery from the COVID-19 pandemic crisis in Thailand. Generally, a trend is a time-series data that machine learning is Long short-term memory (LSTM) which are Vanilla LSTM, Stacked LSTM, and Bidirectional LSTM applied to forecast trends of tourism business recovery and resilience. The rest of this paper is organized as follows: Section 2 presents a review of the literature and related research. In section 3, presents three deep learning models chosen to work with time-series data in this research. The next, section 4 shows experimental results. Finally, conclusion and discussion are presented in Section 5.
Literature Review
Tourism Demand Forecasting
Several studies about tourism demand forecasting categorize qualitative and quantitative approaches. The qualitative approach used Delphi and consensus to study experience and insight on a specific tourism market. The qualitative research approach is based on past data and tourism capacity, the model was constructed and used for predicting tourist arrival volumes in the future and two strategies have been adopted for (1) incorporating more relevant factors that affect tourist travel motivation and (2) sophisticated models with better generalization capability on future trends (Law et al., 2019). Tourism model prediction relies on input factors that should not miss or incorrectly input data. Moreover, tourism demands forecasting factors categorized to (1) determine the main factors for forecasting and (2) indicators which are indirect factors). Moreover, the determinant factors are divided into (1) the push factor is the attribute related to the source market, leisure time, per capita income, and relative prices (Poprawe, 2015; Saha & Yap, 2015) (2) the pull factor is the attribute related to the destination tourism market, quality of resource and direct investment for social draw (Meleddu & Pulina, 2016).
An AI model is related to machine learning which has been adopted to tourism demand and forecasting such as multivariate regression analysis. Machine learning techniques for example Support the Vector Regression (SVR) model which has also been found effective in modelling nonlinear data series and some study methods which integrate results from different models generate better results (Chan et al., 2010; Coshall & Charlesworth, 2011; Shen, et al., 2011).
A Model for Tourism Forecasting
There are a range of tourism forecasting models that have been proposed especially the time series analysis approaches (Bi et al., 2020) econometric approaches (Assaf et al.,2018; Bi et al., 2020) and Artificial Intelligence (AI) approaches (Song & Li, 2008; Bi et al., 2020), etc. Consequently, the main purpose of this study is to propose an AI approach for forecasting tourism volume based on the deep learning approach. The AI approaches have been used for tourism forecasting by using algorithms using tourism volume and its influencing factors. The advantage of using an AI approach which does not require the assumption of the data with types of adaptability and nonlinearity that are particularly suitable for nonlinear forecasting (Song & Li, 2008; Bi et al., 2020).
Deep Learning
Deep Learning (DL) is one type of artificial intelligence model for application in tourism demand forecasting, deep network architectures via greedy layer-wise pretraining, which enables a wide range especially deep learning techniques provide a mechanism of feature engineering that extracts discriminatory features with minimal domain knowledge (Pouyanfar et al., 2018). Two popular deep network architectures of time series forecasting are RNN and LSTM methods. RNN uses a deep network architecture that uses sequential information on tourism demand forecasting. Both input x and output y of an RNN are time-series data. The output of a neuron is generated based on input and the previous hidden layer neuron state through a feedback loop in the network. LSTM is an extension of RNN which has been broadly used to solve time series forecasting problems (Law et al., 2019).
LSTM Network
A Long Short-Term Memory (LSTM) network is a kind of recurrent neural network (RNN) that has been widely used (Bi, Lui & Li, 2020). RNN is an improved version of the traditional neural network, which is used to analyze time sequence data, which the traditional neural network receives as information from the input layer map with output through the hidden layer (Bi et al., 2020). The traditional neural network cannot capture dynamic behavior therefore, it not effective in dealing with time sequence data. However, tourism forecasting is related to a time sequence, to obtain a better prediction result, RNN introduced a directional loop, which makes their underlying topology of inter-neuronal connections contain at least one cycle. RNN is suited for processing sequence data that has inherent problems in learning long-term dependency, to overcome this LST network is designed to learn long-term dependencies and to be able to remember information for long periods and perform a large variety of problem solutions (Bi et al., 2020).
Methods
The Rationale of this Study
This research study is on the business of tourism demand forecasting; however, tourism demand forecasting model is driven mainly by the dominance of features in the training data. The LSTM model was implemented for comparison of the performance of each model.
Vanilla LSTM
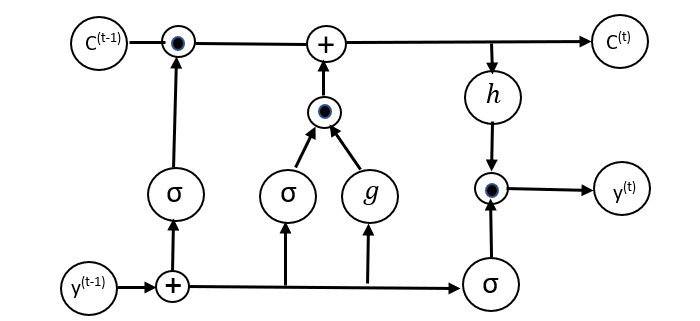
Today, neural network is widely used for various problems that a type of neural network is designed for time-series data processing called Vanilla RNN. This contains state information in the Hidden State. The previous hidden state is used to calculate the current Hidden State and use the current hidden state to determine the calculation of the data in the next period. Importantly, Vanilla LSTMs can solve the Vanishing/Exploding Gradient problem in the optimization process (Figure 1).
σ is a gate activation function, g is an input activation function, h is an output activation function
Stacked LSTM
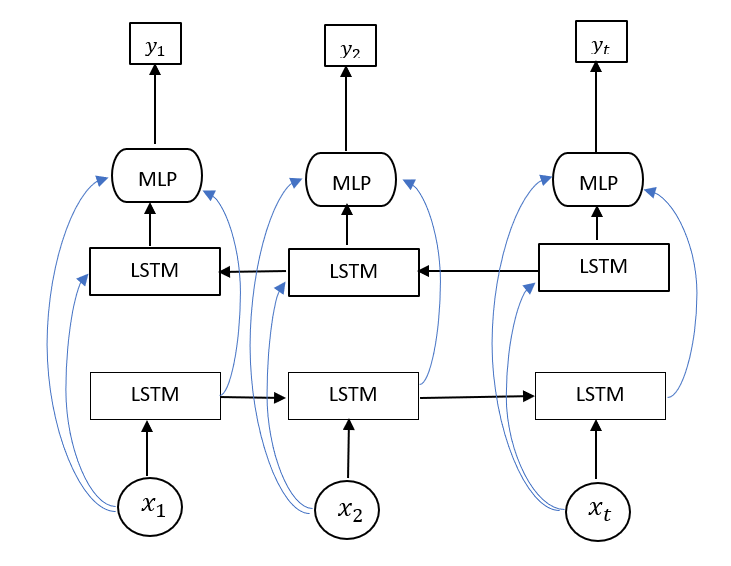
A stacked LSTM is a more complex LSTM than a simple LSTM by having more multiple hidden levels. A stacked LSTM has vertical several layers that is called the stacked LSTM model.
The stack layers are used to create a hierarchical feature representation of the input data for some machine learning task. The input is the result from previous LSTM layer or a feedforward layer. Output from current LSTM layer is input for next LSTM layer (Figure 2).
Bidirectional LSTM
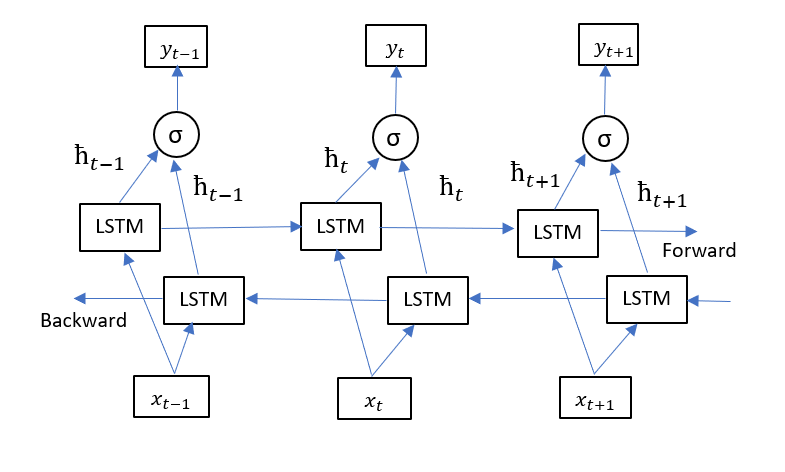
A bi-directional LSTM (BiLSTM) or Bidirectional recurrent neural networks is another type of the LSTM model. BiLSTM provides output from two hidden layers which one hidden is forward direction and other hidden layer is backward direction or the output layer can get information from past (backwards) and future (forward) states simultaneously. BiLSTM has two sets of the neurons that one set is used for forward states and other is used for backward states. During training process, there is no interaction between two directional neurons and when the back-propagation is applied, the processes continue to update the weights until the loss function is minimized (Figure 3).
This study proposed a deep-learning framework for time-series forecasting; the three LSTM models are Vanilla LSTM, Stacked LSTM, and Bidirectional LSTM that have been evaluated for forecasting tourism recovery. The general framework of the forecasting has two main process which are training and prediction. The training process is to create the deep learning model from existing data which is called training data that all parameters of the deep learning models are updated continually for minimizing the loss function. The prediction process provides the output and is tested to find for the accuracy of the model will be evaluated by comparing the actual data with expected data that is the different values is an error.
Results
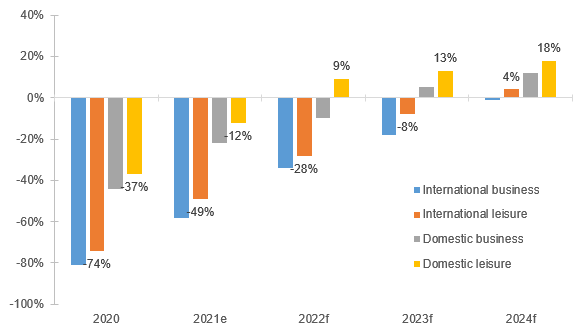
Based on the study of Livinec & Adjiman (2021) who found that the trend of tourism globally will recovery only when domestic leisure is back on track by 2022, international and business travel could suffer until 2023. Figure 5 show international business is the most spending compare to other activities and the expectation of international travel segment is as low as -8% frighteningly compare before this crisis and The trend of unemployment is increasing whereas the trend of spending on tourism activities is decreasing significantly.
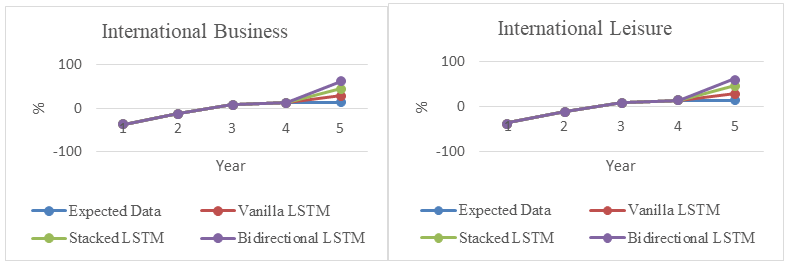
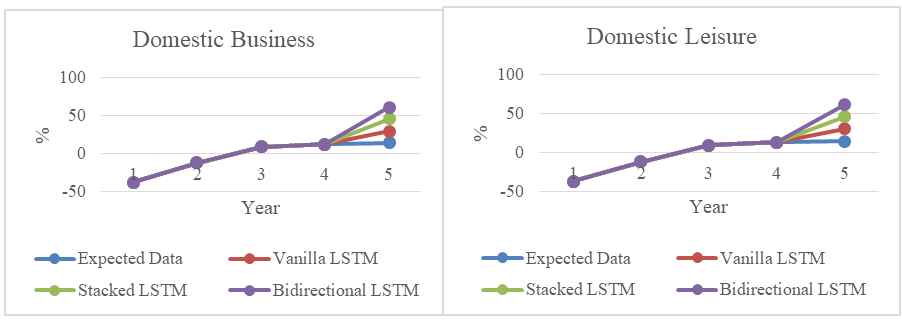
The results of a comparative study of three deep learning methods to forecast the trend of tourism business recovery from the COVID-19 pandemic crisis in Thailand during the years 2020-2024. Figure 6 shows the estimated timeline of international tourism business will cover in Thailand by comparing each LSTM method. The results found that we have five sets of data which are the year 2020e, 2021e, 2022f, 2023f, 2024f. Each year has four kinds of data which are international business (-80, -49, -28, -8, -1), international leisure (-74, -50, -30, -10, 4), domestic business (-45, -22, -10, 7, 12), domestic leisure (-37, -12, 9, 13, 14). We use four data series for training which are the years 2020e, 2021e, 2022f, 2023f and the year 2024f is the expected data. For Vanilla LSTM, we use four data series for the training process that are international business (-80, -49, -28, -8), international leisure (-74, -50, -30, -10), domestics business (45, -22, -10, 7), domestics leisure (-37, -12, 9, 13), We use four data series for the prediction process that are international business (-80, -49, -28, -8), international leisure (-74, -50, -30, -10), domestics business (45, -22, -10, 7), domestics leisure (-37, -12, 9, 13), the prediction values from Vanilla LSTM are international business, international leisure, domestics business, domestics business (-1.0864, -6.8827, 1.189023, 15.88722). We find a per cent error from the prediction data with the expected data using the equation (Figure 4).
Figure 4: Estimated Timeline of the Recovery in Global Travel Spending, By Segment of Travel (Livinec & Adjiman, 2021)


After that, we find an error average value from 4per cent errors (international business, international leisure, domestics business, domestics business) that the Error Average of Vanilla LSTM is 5.91683425 (Table 1 & Figure 5).
| Table 1 Comparison of Lstm Method for International Recovery Tourism Business and Leisure |
||||||||
|---|---|---|---|---|---|---|---|---|
| Year | International Business | International Leisure | ||||||
| Expected Data | Vanilla LSTM | Stacked LSTM | Bidirectional LSTM | Expected Data | Vanilla LSTM | Stacked LSTM | Bidirectional LSTM | |
| 2020 | -80 | -74 | ||||||
| 2021e | -49 | -50 | ||||||
| 2022f | -28 | -30 | ||||||
| 2023f | -8 | -10 | ||||||
| 2024f | -1 | -1.0864 | -3.5612 | -5.04113 | 4 | -6.8827 | -5.0336 | -4.28718 |
For Stacked LSTM, we use four data series for the training process which are international business (-80, -49, -28, -8), international leisure (-74, -50, -30, -10), domestics business (45, -22, -10, 7), domestics leisure (-37, -12, 9, 13). We use four data series for the prediction process that are international business (-80, -49, -28, -8), international leisure (-74, -50, -30, -10), domestics business (45, -22, -10, 7), domestics leisure (-37, -12, 9, 13), the prediction values from Stacked LSTM are international business, international leisure, domestics business, domestics business (-3.5612, -5.0336, 2.013757, 16.13678). We find percent error from prediction data with the expected data using the equation. After that we find an error average value of 4 percent errors (international business, international leisure, domestics business, domestics business) that the Error Average of Stacked LSTM is 5.92949325.
For Bidirectional LSTM, we use four data series for the training process which are international business (-80, -49, -28, -8), international leisure (-74, -50, -30, -10), domestics business (45, -22, -10, 7), domestics leisure (-37, -12, 9, 13). We use four data series for the prediction process that are international business (-80, -49, -28, -8), international leisure ( -74, -50, -30, -10), domestics business (45, -22, -10, 7), domestics leisure (-37, -12, 9, 13), the prediction values from Bidirectional LSTM are international business, international leisure, domestics business, domestics business (-5.04113, -4.28718, 2.139827, 15.24818). We find a percent error from the prediction data with the expected data using the equation. After that we find an error average value of 4 percent errors (international business, international leisure, domestics business, domestics business) that the Error Average of Bidirectional LSTM is 5.8591657 (Table 2 & Figure 6).
| Table 2 Comparison of Lstm Method For Domestic Recovery Tourism Business in Thailand |
||||||||
|---|---|---|---|---|---|---|---|---|
| Year | Domestic Business | Domestic Leisure | ||||||
| Expected Data | Vanilla LSTM | Stacked LSTM | Bidirectional LSTM | Expected Data | Vanilla LSTM | Stacked LSTM | Bidirectional LSTM | |
| 2020 | -45 | -37 | ||||||
| 2021e | -22 | -12 | ||||||
| 2022f | -10 | 9 | ||||||
| 2023f | 7 | 13 | ||||||
| 2024f | 12 | 1.189023 | 2.013757 | 2.139827 | 14 | 15.88722 | 16.13678 | 15.24818 |
Conclusion and Discussion
A comparative study of LSTM's deep learning approach for analyzing trends in tourism business recovery from the COVID-19 pandemic in Thailand supports a study of Zhang, et al., (2021), which describes how the COVID-19 pandemic has affected global tourism activities and expressed forecasts of econometric and judgmental methods to predict a possible path to recovery in tourism in Hong Kong, In this research, the researchers using trends of tourism business recovery from the pandemic crisis during 2020-2024.
The experimental results showed that, the Bidirectional LSTM learning method showed an average error of 5.85916575, which was better than that of the Vanilla LSTM learning method and the Stacked LSTM learning method, with an average error of 5.91683425 and 5.92949325, respectively. In this regard, the Bidirectional LSTM output layer can learn sequential inputs in both directions and bridge the two interpretations, while the Vanilla LSTM learning method has a single hidden layer and a single output layer for prediction, while the Stacked LSTM learning method has multiple hidden LSTM layers stacked in LSTM units for prediction. The experimental results showed that, bidirectional LSTM was more accurate than that of Vanilla LSTM and stacked LSTM, with better performance when applied to time series problems, and can be applied to other case, such as stock price predictions. In future studies, the researcher will apply it to other interesting real problems and applied to large or streams data. The forecast results from this research are consistent with research by Zhang et al (2021), which predicts that the tourism industry in the three countries - Thailand, Malaysia, and Singapore - may also recover relatively quickly, due to the low number of daily confirmed cases of COVID-19 and the number of business travel campaigns and government policies such as the “tour bubble” that could reshape tourism by 2024.
Acknowledgement
This work was supported by Suan Dusit University, Thailand. This study is part of the research program “Innovation for human capital development in the tourism and hospitality industry (Frist S- Curve) on the Eastern Economic Corridor (EEC) (Chon Buri - Rayong - Chanthaburi - Trat) to enrich International standards and prominence to High-Value Services to stimulate Thailand to be Word Class Destination and support New Normal paradigm” which is funded by Suan Dusit University under the Ministry of Higher Education, Science, Research and Innovation, Thailand.
References
- Assaf, A.G., Li, G., Song, H., & Tsionas, M.G. (2019). Modelling and forecasting regional tourism demand using the Bayesian Global Vector Autoregressive (BGVAR) Model. Journal of Travel Research, 58(3), 383-397. doi:10.1177/0047287518759226
- Bi, J.W., Lui, Y., & Li, H. (2020). Daily tourism volume forecasting for tourist attractions. Annals of Tourism Research, 83, 102923.
- Chan, C.K., Witt, S.F., Lee, Y.C.E., & Song, H. (2020). Tourism forecast combination using the CUSUM technique. Tourism Management, 31(6), 891–897.
- Coshall, J.T., & Charlesworth, R. (2011). A management orientated approach to combination forecasting of tourism demand. Tourism Management, 32(4), 759–769.
- Frechtling, D.C., & Frechtling, D.C. (2001). Forecasting tourism demand: methods and strategies. Oxford, Boston: Butterworth-Heinemann (OCLC: ocm48401821).
- Jamal, T., & Higham, J. (2021). Justice and ethics: Towards a new platform for tourism and sustainability. Journal of Sustainable Tourism, 29(2–3), 143–157.
- Jermsittiparsert, K., & Chankoson, T. (2019). Behavior of tourism industry under the situation of environmental threats and carbon emission: Time series analysis from Thailand. International Journal of Energy Economics and Policy, 9(6), 366-372.
- Law, R., Li, G., Fong, D.K.C., & Han, X. (2019). Tourism demand forecasting: A deep learning approach. Annals of Tourism Research, 75(2019), 410–423.
- Livinec, S., & Adjiman, R. (2021). Tourism: Europe will be at the frontline of the recovery, but only in 2024, https://www.eulerhermes.com/en_global/news-insights/economic-insights/Tourism-Europe-will-be-at-the-frontline-of-the-recovery-but-only-in-2024.html
- Meleddu, M., & Pulina, M. (2016). Evaluation of individuals' intention to pay a premium price for ecotourism: An exploratory study. Journal of Behavioral and Experimental Economics, 65, 67–78.
- Pouyanfar, S., Sadiq, S., Yan, Y., Tian, H., Tao, Y., Reyes, M.P., & Iyengar, S.S. (2018). A survey on deep learning: Algorithms, techniques, and applications. ACM Computing Surveys, 51(5), 92 (1-92:36).
- Poprawe, M. (2015). A panel data analysis of the effect of corruption on tourism. Applied Economics, 47(23), 2399–2412.
- Rastegar, R., Higgins-Desbiolles, F., & Ruhanen, L. (2021). COVID-19 and a justice framework to guide tourism recovery, Annals of Tourism Research. https://doi.org/10.1016/j.annals.2021.103161
- Sanders, N., & Ritzman, L. (2001). Judgmental adjustment of statistical forecasts. Principles of forecasting, 405–416. New York, USA: Springer Science and Media.
- Saha, S., & Yap, G. (2015). Corruption and tourism: An empirical investigation in a non-linear framework. International Journal of Tourism Research, 17(3), 272–281.
- Skare, M., Soriano, D.R., & Porada-Rochon, M. (2021). Impact of COVID-19 on the travel and tourism industry, Technological Forecasting and Social Change, 163, 120469.
- Song, H., & Li, G. (2008). Tourism demand modelling and forecasting. A review of recent research. Tourism Management, 29(2), 203–220.
- Suanpang, P., & Jamjuntr, P. (2021). A Chatbot Prototype by Deep Learning Supporting Tourism, Psychology and Education, 58(4), 1902-1911.
- Suanpang, P., Sopha, C., Jakjarus. C., Leethong-in, P., Tahanklae, P., Panyavacharawongse, C., Phopun, N., & Prasertsut, N. (2021a). Innovation for human capital development in the tourism and hospitality industry (Frist S- Curve) on the Eastern Economic Corridor (EEC) (Chon Buri - Rayong - Chanthaburi - Trat) to enrich international standards and prominence to High Value Services for stimulate Thailand to be Word Class Destination and support New Normal paradigm. Bangkok: Suan Dusit University, Thailand.
- Suanpang, P., Songma, S., Chunhaparagul, T., Niamsorn, C., Netwong, T., & Panyavachara-wongse, C. (2021b). Innovation for human capital big data on digital platform to enhance the competitiveness of tourism and high value services to promotion Thailand to be a word class destination and support new normal paradigm. Bangkok: Suan Dusit University, Thailand.
- UNTWO. (2020). Impact assessment of the COVID-19 outbreak on international tourism. Retrieved May 20, 2020 from the World Tourism Organization website: https://www.unwto.org/impact-assessment-of-the-covid-19-outbreak-on-international-tourism.
- Zhang, H., Song, H., Wen, L., & Lui, C. (2021). Forecasting tourism recovery amid COVID19. Annals of Tourism Research, 87, 1-16.
