Research Article: 2019 Vol: 25 Issue: 1
A Cross-Sectional Study On the Relationship Between Business Plan, Entrepreneur Type, Development Stage and Profitability of Us SMEs
Koh Inkon, Kangnam University
Abstract
Although the claim that there is a high correlation between business plan and profitability is persuasive in the theoretical aspect, there are not many empirical studies related to business plan components. In this study, the business plan components of US SMEs were identified and the effect of each component on profitability was examined. In addition, when considering the type of entrepreneur and the stage of development, whether the components of business plan had significant impacts on profitability was analyzed.
Business plan components were classified into marketing, finance, production/operation and strategic management factors based on 20 items selected through literature review and preliminary survey. As a result of analysis, all components affected profitability positively, especially marketing and finance factors had larger effect than other factors. Meanwhile, these factors distinguished statistically significantly between the good and the not-good performance group in terms of profitability. Also, marketing and finance factors showed good discriminant power, while production/operation and strategic management factors showed not.
As a result of examining the influences of business plan components on profitability by the entrepreneur type of the surveyed firms, all factors except strategic management factor were less influential in technician/craftsman entrepreneur firms than in general/opportunist entrepreneur firms. However, unlike the expectation, it did not show statistically significant difference. As the detailed items of business plan component factors, only statistically significant difference was found in the distribution item of the marketing factor. As a result of examining the influence of business plan components on profitability by the development stages of the surveyed firms, the influence of finance factor was the lowest in every development stage but did not show any statistically significant difference. However, statistically significant differences were found in four details: employee hiring and development, product (service) costing and analysis, product (service) production planning, and inventory issues. They belong to production/operation and finance factors. Interestingly, according to development stages, the trend of the effect of each component was different. In addition, I tried to increase the usefulness of the study by the investigation of US SMEs’ business planning behaviors.
Keywords
Business Plan, Type of Entrepreneur, Entrepreneur Development.
Introduction
Companies generally establish management plans. Plan is to determine the direction of action before implementation to achieve the desired outcome of the future. Therefore, the management plan is all decisions that predicts the future of company and highlights it. If the management plan is wrong, it is difficult to achieve the goal of company, and sometimes affects the survival of company. So management planning should be carefully considered. In the management plan, there are plans for each function such as marketing, finance and production etc. A business plan is a representative example of the integrated plan in which various functional units are included.
The business plan is an integration of the action plans of various functional sectors, and an important guideline in doing business (Koh, 2005; Lee & Koh, 2018; Longenecker et al., 2003). In addition, the business plan motivates the organization members and helps them to create and accumulate knowledge related to each sector by internal and external communication. From the manager's view, it can be used as a basis for establishing the direction of business management. Besides, it will ultimately affect management performance because it is the criterion for the measurement of departmental/individual performance.
Several studies have shown that the establishment of business plan is a very important management activity, especially in SMEs (Becherer & Helms, 2009; Minzberg, 1994; Rue & Ibrahim, 1998). Therefore, managers of SMEs should be interested in how to organize and refine the contents of business plan for the desired performance achievement, but unfortunately, it is not easy to find related researches except for some studies (Osterwalder & Pigneur, 2012; Volker & Phillips, 2018). In other words, everyone knows that business planning is important, but there is no consensus on how to plan. In addition to this, SMEs do not establish business plans for many reasons. Koh et al. (2007) investigated the business planning behaviors of SMEs in Korea, and found that market uncertainty was the biggest obstacle to the business planning.
On the other hand, management varies according to entrepreneur. Since SMEs are relatively heavily dependent on CEOs compared to large corporations, the CEOs’personal factor is considered as the success factor of SMEs (Miller, 2011; Yusuf, 1995). In order to reflect this factor in this study, the entrepreneur type is used. According to entrepreneur type, the business plan components emphasized may be different. So how to distinguish entrepreneur type and what type of entrepreneur are the important issues in business planning.
The development stage of company is also an important consideration in business planning. Similar to the concept of Product Life Cycle (PLC) in marketing field, the development stage of company can be classified from the biological point of view (Hanks & Chandler, 1994; Jablonski & Jablonski, 2016; Santisteban & Mauricio, 2017). Generally, the development stage of a company can be divided into four phases: establishment, growth, expansion, and stabilization period. Because it is possible to find the typical phenomena at each development stage, companies in the same stage will have the similar management issues. Therefore, considering the development stage in business planning can make company to achieve goals effectively.
The purposes of this study are as follows. First, the components of business plan in US SMEs will be identified and the impact of each component on profitability will be examined. Second, the entrepreneur types of US SMEs will be investigated and whether the influence of business plan component is different by each type will be analyzed. Third, the development stages of US SMEs will be investigated and whether the influence of business plan component differs at each stage will be analyzed. In addition, the business planning behaviors of US SMEs will be examined in order to increase the usefulness of this study.
Theoretical Background
Business Plan
Planning is the first step in the management process and as a preliminary step in execution, affects the direction of future actions. Therefore, the plan means all decisions that predict and highlight the future of a company.
Meanwhile, the business plan is a report that integrates the plans of all departments related to the business of company such as organization management, production, marketing, and finance etc. Allen (2003) defined a business plan as a comprehensive analysis designed to realistically implement business concepts of a company. In other words, unlike other management plans, all functional sections are included in business plan, and as a result, the business plan becomes the basis for actually promoting the planned business (Lee & Koh, 2018). The business plan allows the manager to define the business and recognize as closely as possible how to respond in current market (Hormozi et al., 2002). Strategic planning, which frequently mentioned recently, and business planning are two sides of a coin. Baker et al. (1993) argued that a documented strategic planning is a business plan. Therefore, they are not distinguished in this study.
A well-established business plan has positive impact on corporate management (Arkebauer, 1995; Rue & Ibrahim, 1998) and reduces failure rates (Crawford-Lucas, 1992), however a business plan that is not well established will inevitably have negative impact on corporate management (Minzberg, 1994). As a result, many studies have shown that business plan is highly correlated with firm performance (Baker et al., 1993; Parks et al., 1991; Schwenk & Shrader, 1993). Especially in SMEs, business planning can give many advantages by making great contributions to business growth (Orser et al., 2000; Ward, 1997).
Noting that about 99% of US firms were small businesses with fewer than 500 employees, Perry (2001) investigated the impact of planning on the bankruptcy of American small businesses. He found that most small firms did not plan formally and failed firms relatively less planed than non-failed firms.
In family businesses, business planning is a decisive success factor (Knight, 1993). Family firms have the characteristics such as family ownership and control, family influence in decision making, and willingness to succeed in the next generation (Sharma et al., 1997), and relatively more resist to plan than other firms (Upton & Petty, 2000), and as a result, documented business plan is rare in general (Minzberg, 1994). Besides, there is a tendency to avoid borrowing (Berembeim, 1990). Especially, these phenomena are more prominent when there was a successful experience in the past (Ward, 1997). However, family firms pursuing rapid growth are positive for risk taking and innovative/aggressive management (Zahra & Covin, 1995), so they are tend to be strategic approach to business planning (Barringer et al., 1998; Siegel et al., 1993), focus on R&D activities (McCann, 1991; McGee & Dowling, 1994), emphasize the quality of products and services (Barringer et al., 1998). In this regard, Upton et al. (2001) pointed out that the growth-oriented family firm has the characteristics such as a long-term planning, participation in the board of directors in planning process, linking with business plan and performance, continuous communication with all employees, quality/prestige strategy (differentiate strategy), and the first (or early) entry.
Meanwhile, Rhyne (1986) reviewed existing studies and argued that the relationship between firm's business planning and financial performance did not show a consistent direction. However, this is not a result that the two factors are not related to each other, but rather the problem of insufficient consideration of the independence/dependent variables and control variables used in each study.
It is effective to establish a business plan through formal communication among the members rather than informally and arbitrarily by executives of the top management or related departments (Baker et al., 1993; Rue & Ibrahim, 1998). Meanwhile, lack of time & skill is the main reason that small enterprises cannot plan, and resistance to planning and resources have a decisive influence on the effectiveness of strategic planning (Ramanujam & Venkatraman, 1987).
Although many studies suggest the necessity of business plan, but there is no answer to how to do it concretely. Perry (2001) investigated the relationship between management failures by measuring whether they had written plans for sales, personnel, funds demand/spending, identification of strategies and measurable goals, but showed the limitations of the constitutional items in business plan.
Table 1 shows the common components of business plan (Arkebauer, 1995; Hormozi et al., 2002; Koh, 2005; Longincker et al., 2003; O'Hara, 1995). Although Osterwalder & Pigneur (2012), Fielt (2013) insisted that these traditional components were not effective any more, they are still used generally in business planning. Among components, relatively more researches have been done for financial items. Bhide (1992) investigated the nature of funding at the beginning of business and found that most managers raised money through personal methods (savings or borrowing), Winborg & Landstrom (2000) categorized financing schemes into six specific categories. There was also research on funding from the outside, Mason & Harrison (1996) argued that individual investors are making relatively rapid investment decisions and consider both financial and non-financial aspects.
| Table 1: The Common Components Of Business Plan | |
| COMPONENTS | CONTENTS |
| Company status | Company name, establishment date, location, capital stock, CEO, history, management/technique team, corporate purpose(mission, vision, etc.). |
| Product/service | Patent rights, differences from existing products, features. |
| Business overview | Target market, business environment, supply of raw materials, legal requirements, insurance, promotion schedule, expected location. |
| Marketing items | STP strategy, competitor analysis and competitive advantage, price structure, location selection, distribution channel, promotion plan, future sales plan. |
| Production items | Technology, equipment, personnel, production capacity, production plan, cost per product unit, quality control, production process diagram. |
| Financial items | Funding and spending plans, projected fund balance sheet, estimated financial statements, profitability. |
| Other important points | Borrowing state and repayment plan, guarantee/warranty state, important contract contents, ongoing litigation etc. |
| Assumptions in business planning |
Raw material increase rate, wage increase rate, market growth rate, inflation rate, sales price increase rate etc. |
Entrepreneur Types
Compared to large corporations with well-established management systems, SMEs differ in their ownership of management, capital procurement, target market, and organization size etc. As a result, it is effective to use different strategies from large corporations (Koh, 2009). The biggest difference between SMEs and large corporations is that SMEs depend on CEOs relatively more. It is not surprising, therefore, that many scholars have taken CEOs’personal factor as the one of the success factors of SMEs (Miller, 2011; Steiner & Solem, 1988; Yusuf, 1995). They argued that CEOs’personal experiences, their skills, management abilities and even their personality and behavior, have great impact on corporate management. Yan & Yan (2016) argued entrepreneur is the main driver of innovative activities.
Entrepreneur type is being used as a concept to reflect these individual factors into research. There are various ways of classifying entrepreneur types, for examples, productive/unproductive/destructive (Baumol, 1990), social/commercial (Collins & Nadin, 2011), individual/collective (Yan & Yan, 2016). Among them, the dichotomy method that distinguishes the entrepreneur whose technical side is stronger as the craftsman and the entrepreneur whose management side is stronger as the opportunist is dominant. Lee & Osteryoung (2001) classified SMEs in Korea and US into technician/craftsman entrepreneurs and general/opportunist entrepreneurs, and examined whether the success factors of SMEs were identical between entrepreneur types. Longenecker et al. (2003) classified entrepreneur types as artisan and opportunist. In general, technician type is a skilled entrepreneur who is trained technologically, and has the tendency of emotional management for company by his/her own view. However, the opportunity catcher type is a generally educated entrepreneur who is not related to technology, and has the tendency of professional management for company.
Company Development Stages
In the marketing area of business administration, the concept of Product Life Cycle (PLC) is used as the method to understand market dynamics. Similar to the PLC concept, several scholars have analyzed the development stage of company from the biological point of view (Hanks & Chandler, 1994; Miller & Friesen, 1984; Santisteban & Mauricio, 2017). They strongly argue that there are typical phenomena in each development stage. Robinson et al. (1984) suggested the stage of company development as the factor affecting the strength of strategic planning.
The development stages of companies are divided into a number of stages ranging from 2 to 6 stages, depending on researchers. Jablonski & Jablonski (2016) divided companies listed on the Warsaw Stock Exchange into early and mature stage and found that the business models of companies in each stage were different. Santisteban & Mauricio (2017) analyzed 1,013 papers and a total of 74 researches through keyword search, and they organized success factors of IT startups in 32 items of organization, individual and external category. In particular, they divided the development stages of venture companies into seed, early, growth, expansion stage and argued that prior experience of establishment team and government support factors in seed stage and venture capital factor in early stage and clustering, technology/business competency and venture capital factors in growth stage, and clustering factor in expansion stage were the main success factors. As shown in Table 2, development stages are generally distinguished as four stages of establishment, growth, expansion, and stabilization.
| Table 2: The Characteristics And Main Issues In Company Development Stage | ||
| Stages | Characteristics | Main Issues |
| Establishment | Period that a new company tries to achieve a visible reality. | -Commercialization of ideas: It is important to clearly define the market, to acquire necessary skills, and to develop basic procedures of work. -The needs for consulting support in marketing and production/operation systems. |
| Growth | Period toward high growth due to marketing approach to commercial products. | Production and finance/accounting. |
| Expansion | Period that is similar to growth period but growth slows down. | Mass production and sales of products, distribution: -Problems in all relevant sectors are the main concerns. - Raw material purchases, production planning, inventory, quality control issues. - Payroll system, facility maintenance issues. - Financial planning issue. - Sales promotion, channel management issues. |
| Stabilization | Period that show slower growth than expansion. | ⋅profitability/organization effectiveness improvement, formalized planning/control issues. |
Methodology
Research Hypothesis
As the business plan is a comprehensive plan in which each division's strategy for achieving corporate goals is expressed, the stock and flow of relevant knowledge are expressed clearly in the plan (Koh, 2005). The components of business plan differ from scholars, but they are roughly classified into six categories as mentioned above. Based on prior studies, preliminary study was used and the detailed items were selected that would affect the company performance. Specifically, as shown in Table 3, the components of business plan were classified into four areas of strategic management, finance, marketing, production/operation, and then five detailed items representing each areas were selected.
| Table 3 : The Components Of Business Plan Of Study | |
| COMPONENTS | DETAILED ITEMS |
| Strategic Management | Corporate Vision and Mission, Management Team, Employment and development of employees, Related Industry Analysis, Competitiveness Analysis. |
| Finance | Accounting system, Tax issues, Product (Service) Costing and Analysis, Financing, Financial analysis. |
| Marketing | Overall marketing plan, Market research, Pricing, Advertising, Distribution. |
| Production/Operation | Product (Service) Production Plan, Inventory issues, Quality Management, Product (Service) Development, Management Information System (MIS). |
As the profitability index of companies in this study, the improvement level of Return On Assets (ROA) was used for the last 3 years. This is the representative measure of profitability and has been widely used in many studies. If the impacts of the business plan components on profitability are different, then corporate managers should establish effective criteria for resource allocation and this study can provide useful implications in this regard.
Comparing to companies with not well-established business plans, companies with well-established business plans for each functional sector such as production, marketing, finance and personnel organization can maximize profits by effectively putting resources into, thereby enhance profitability. A well-established business plan can be a means of effective communication between organization members and/or stakeholders to resolve conflicts and create bonds and consensus, which can save time and money in business. Sharkie (2003) argued that active communication increased the speed of work, which reduced the time and cost and consequently, increased the profit of the company. De Luca & Atuahene-Gima (2007) showed that active communication within and outside the organization activated interactions such as information exchange and cooperative building, resulted that time and cost reduced for new product development and increased the performance of the organization. Therefore, the following hypothesis can be set.
H1: The components of the business plan will have positive impacts on profitability.
The smaller the size of SMEs, the more influenced by the entrepreneurs’ individual factors. Entrepreneurs seem to consciously or unconsciously tend to manage their businesses uniquely in accordance with their own experience, educational background, personal inclination, and motive for startup. In other words, according to the type of entrepreneur, there are many differences in the ways operate firms (Lee & Osteryoung, 2001; Longenecker et al., 2003; Miller, 2011). Considering this, it can be expected that business planning will be different in each of the component (i.e., strategic management, finance, marketing, production/operation) according to the type of entrepreneur. So, the following hypothesis can be set.
H2: According to the type of entrepreneur, the impacts of business plan components on profitability will vary.
Several scholars have analyzed the development stages of a company from a biological standpoint (Hanks & Chandler, 1994; Jablonski & Jablonski, 2016; Miller & Friesen, 1984). They attempted to express the process from creation to extinction of a company as a schematic life cycle curve. The basic assumption of the corporate life cycle curve is that common patterns appear in each stage of development. The stage of development of a company can be generally divided into four phases; establishment period, growth period, expansion period, and stabilization period. Each stage has the characteristics as shown in Table 2 above. Therefore, companies in the same development stage may have similar management issues. Considering this, it can be expected that firms will have a similar pattern in terms of establishing business plans, as varying the proportions of business plan components according to the stage of development. Therefore, the following hypothesis can be set.
H3: The impacts of business plan components on profitability will vary according to the stage of development of a company.
Operational Definitions of Variables
The components of business plan
To test hypothesis, I measured the degrees of impacts on the performance of the 20 detailed items of business plan in four areas selected through literature review and preliminary survey. For increasing the respondents’concentration, reversed 5 point Likert scale was used (1-very strong, 5-very weak). The details are shown in Table 3 above.
The type of entrepreneur
Using the general classification method for entrepreneur type, I distinguished entrepreneurs between technician/craftsman entrepreneurs and general/opportunist entrepreneurs. Technician/craftsman entrepreneur means a CEO who catches business opportunity by technology, and general/opportunist entrepreneur means a CEO who catches business opportunity by other than technology. In this study, Lee & Osteryoung (2001) items were used to measure the entrepreneur type.
The stages of development
Considering the purpose of the study, the stages of development of the responding companies were divided into three phases except the establishment period on the corporate life cycle curve; the early growth stage, the late growth stage and the maturity stage. The early growth stage is also called as growth phase, and the stage in which high growth is expected by commercial products and marketing approach. The main tasks are product production, organization construction, and initial marketing planning. The late growth stage is also called as expansion phase, and the stage in which the growth rate is gradually slowing down. Major concerns include production/sales/delivery methods of more products, manufacturing and general management systems. The maturity stage is also referred to as stabilization phase, where the firm is stable in sales and the organization is operated like a small bureaucracy. In addition, cost control and productivity become primary concerns as the focus of management moves from growth to profitability. In this study, the stage of development of a company was measured using the items of Lee et al. (2004).
Profitability
As a profitability item, the degree of change in Return On Assets (ROA) over the last three years was measured using the 5 point Likert scale (1-very aggravated, 5-highly improved). In order to minimize the effect of firm size, this study excluded the absolute amount of net profit from the measure of profitability.
Data Collection
The surveyed companies were SMEs in the United States. SMEs are generally referred to as companies that are relatively small in size, but by law, they are selected based on the number of employees, assets, and sales.
To extract the important fields and detailed items for business planning before the main survey, 20 companies were selected and the telephone interviews were conducted with executives in charge of business planning. The target companies were selected from SMEs in the Midwest and Eastern regions. A total of 500 questionnaires were distributed and 330 questionnaires were collected and response rate was 66.0%. Finally, 156 questionnaires were used in this study, except for the insincere responses and missing questionnaires.
This survey was conducted for two months from September to October, 2015. In order to examine the existence of nonresponse bias, the collected data was compared and analyzed in September and October, and did not found any statistically significant difference. It indicates that non response bias is unlikely to be present in the data
The 66.7% of CEOs of responding companies were male and 33.3% were female. The service industry (66.0%) and the corporation (66.1%) was the most. 58.3% of responding companies said they had less than 6 years of experience and 57.0% said annual sales were less than $500,000. In 87.8% of responding companies, the number of employees was below 30 employees. The technician/craftsman entrepreneur type was 59.0% and general/opportunist entrepreneur type was 41.0%. 59 companies (37.8%) were in the stage of early growth, 59 (37.8%) were in the stage of late growth, and 38 (24.4%) were in the maturity stage. The characteristics of the sample firms are summarized in Table 4.
| Table 4: The Characteristics Of The Samples | |||
| CHARACTERISTICS | CONTENTS | FIRMS | % |
| CEO’s Gender | Male Female |
104 52 |
66.7 33.3 |
| Industry | Manufacture Service Other |
14 103 39 |
9.0 66.0 25.0 |
| Company form | Individual Partnership Corporation Other |
25 10 103 18 |
16.0 6.4 66.1 11.5 |
| History | Less than 1 year 1-3 years 4-6 years More than 7 years |
15 39 37 65 |
9.6 25.0 23.7 41.7 |
| Annual Sales | Less than $100,000 $100,000 ~Less than $500,000 $500,000 ~Less than $1,000,000 $1,000,000 ~Less than $5,000,000 More than $5,000,000 |
47 42 24 29 14 |
30.1 26.9 15.4 18.6 9.0 |
| Employees | Less than 10 11-30 31-50 More than 51 |
105 32 12 7 |
67.3 20.5 7.7 4.5 |
| Entrepreneur type | Technician/Craftsman General/Opportunist |
64 92 |
41.0 59.0 |
| Development Stage | Early Growth Late Growth Maturity |
59 59 38 |
37.8 37.8 24.4 |
Results And Discussion
Reliability and Validity Check
As shown in Table 5, Cronbach’s Alpha value of the latent variable used in this study was 0.894 for factor 1; 0.870 for factor 2; 0.844 for factor 3; and 0.642 for factor 4, so the reliabilities of all latent variables were acceptable (Nunnally, 1967).
| Table 5: The Result Of Factor Analysis For Bp Components | ||||
| MEASUREMENT ITEMS | Factor1 | Factor2 | Factor3 | Factor4 |
| Market research Overall marketing plan Advertising Pricing Distribution Related Industry Analysis |
0.864 0.768 0.757 0.702 0.636 0.572 |
|||
| Product (Service) Production Plan Management Information System (MIS) Product (Service) Development Inventory issues Quality Management |
0.804 0.781 0.731 0.729 0.727 |
|||
| Tax issues Accounting system Financing Financial analysis Product (Service) Costing and Analysis Employment and development of employees |
0.787 0.738 0.721 0.632 0.539 0.532 |
|||
| Corporate Vision and Mission Competitiveness Analysis Management Team |
0.788 0.683 0.546 |
|||
| Eigen value | 3.776 | 3.493 | 3.396 | 2.459 |
| % of Variance explained | 18.880 | 17.463 | 16.978 | 12.293 |
| Accumulated % of Variance explained | 18.880 | 36.343 | 53.321 | 65.614 |
| Cronbach’s alpha | 0.894 | 0.870 | 0.844 | 0.642 |
Factor analysis was conducted to check the validities of the measurement items. Convergent and discriminant validity can be confirmed through factor analysis. Varimax was used for rotation method, and the factors with Eigen value of 1 or more were extracted. The extracted factors explained 65.61% of the total variance. The details are shown in Table 5.
Factor 1: Marketing factor: Market research, overall marketing planning, advertising, pricing, distribution, and related industry analysis items showed high factor loadings on this factor, which is closely related to the marketing component of business plan. What is interesting is that respondents see related industry analysis items as marketing factor. This means that the range of perceived marketing factor is very broad.
Factor 2: Production/operation factor: Product (service) production planning, Management Information System (MIS), product (service) development, inventory issues and quality management items showed high factor loadings on this factor and which is closely related to production/operation component of business plan.
Factor 3: Finance factor: Tax issues, accounting systems, financing, financial analysis, product (service) costing and analysis, and employee hiring and development items showed high factor loadings on this factor and which is closely related to finance component of business plan. The reason why regarding firms' employment and development item as financial factor is probably because respondents considered this as the item having a great impact on the financial condition of a company.
Factor 4: Strategic management factor: This factor included corporate vision and mission, competitiveness analysis and management team items. In other words, this factor reflects the business philosophy of a company, so it is closely related to strategic management component of business plan.
Testing Research Hypothesis
H1: The relation between business plan components and profitability.
In Table 6, result of multiple regression analysis using factor scores of business plan component items, all four factors had a positive effect on profitability, and factors 1 and 3 had a relatively high influence. The F-value of the regression model was 6.543 and statistically significant. However, in terms of statistical significance of each coefficient, factors 1 and factor 3 were statistically significant while factors 2 and factor 4 did not. Therefore, Hypothesis 1 was partially supported.
| Table 6 : The Result Of Multiple Regression Analysis For Bp Components And Profitability | |||||||
| Dependent Variable | Business Plan Component | R² | F-value | Sig. | B | T value | Sig. |
| Profitability | Constant F1 Marketing Factor F2 Production/Operation Factor F3 Finance Factor F4 Strategic Management Factor |
0.148 | 6.543 | 0.000 | 2.731 -0.291 -0.072 -0.308 -0.068 |
32.207 -3.416 -0.852 -3.625 -0.801 |
0.000 0.001 0.396 0.000 0.424 |
Note: Each item is reversed scale.
On the other hand, although not building a hypothesis, IT was examined whether there were differences in the importance of the components of business plan between good company and not-good company. This is as important as Hypothesis 1 because it can suggest the items that should be emphasized in business planning.
The average value of the ROA changes of the surveyed firms was 2.733, which means that the surveyed firms did not feel improvement in profitability over the past three years. Next, respondents were divided into 2 groups; good companies and not-good companies based on the average value. As shown in Table 7, the average value of the ROA changes of good companies is 3.455 while that of not-good companies is 1.474, and the mean difference between the two groups was statistically significant (p=0.000).
| Table 7: The Average Value Of Roa Changes | ||
| Total (n=156) | Good Companies (n=99) | Not-good Companies (n=57) |
| 2.733 (1.13) | 3.455 (0.659) | 1.474 (0.504) |
Note: Likert 5 point scale and parenthesis value is standard deviation.
To identify the discriminant power of the business plan components between good and not-good company group, discriminant analysis was used. As a result, factor 1 and factor 3 among the four factors, had a relatively low Wilks' lambda and a large F-value shown in Table 8. This indicated that the discriminant powers of them were high. Also, the result of Box's M test showed that the covariance matrix did not violate the assumption of homogeneity (p=0.199). The classification accuracy of the model was 66.7%.
| Table 8: The Result Of Testing The Homogeneity Of Group Means And Box’s M | ||||||
| Factor | Wilks‘ λ | F | df1 | df2 | p-value | Box's M |
| F1 Marketing Factor F2 Production/Operation Factor F3 Finance Factor F4 Strategic Management Factor |
0.898 0.999 0.968 0.990 |
17.410 0.147 5.113 1.532 |
1 1 1 1 |
154 154 154 154 |
0.000 0.702 0.025 0.218 |
13.897 (0.199) |
Note: value in parenthesis is significant level of Box's M value.
As shown in Table 9, two groups have statistically significant differences in the components of business plan for profitability. Table 10 shows the standardized canonical discriminant function coefficients and structural matrix of the components of business plan in terms of profitability. The former indicates the relative importance of the factors in explaining the belonging group of firms, and it can be likened to the standardized beta coefficient of regression analysis. Factor 1 had the largest effect, followed by factor 3, factor 4, and factor 2. The structural matrix, on the other hand, indicates the correlation between each factor and the standardized canonical discriminant function. The correlation value is also called as the discriminant loading and can be likened to the factor loading of factor analysis. The structural matrix is judged to be significant when the discriminant loading value is ± 0.3 or more, so factor 1 was the most important variable, and had the largest discriminant power. Factor 3 also showed good discriminant power, so it is possible to accept the discriminant power of marketing and finance factor.
| Table 9: Wilks’ Lamda | |||
| Wilks‘ λ | χ² | df | p |
| 0.855 | 23.723 | 4 | 0.000 |
| Table 10: Standardized Canonical Discriminant Function Coefficients And Structural Matrix | ||
| Factor | Standardized canonical discriminant function coefficients | Structural matrix |
| F1 Marketing Factor F2 Production/Operation Factor F3 Finance Factor F4 Strategic Management Factor |
0.859 0.075 0.443 0.243 |
0.818 0.088 0.502 0.281 |
H2: The relation between entrepreneur type and business plan components.
The impact of business plan components on profitability according to the type of entrepreneur was examined. Except for factor 4, technician/craftsman entrepreneurs were evaluating the influences of factors 1-3 lower than general/opportunist entrepreneurs. Table 11 shows the details. It was examined whether the effects of these factors were statistically significant by independent sample t-test, but all factors did not show statistically significant differences according to entrepreneur type unlike the expectation. Therefore, Hypothesis 2 was rejected.
| Table 11: The Average Impact Of Bp Components On Profitability By Entrepreneur Type | |||
| Factor | Total | technician/craftsman | general/opportunist |
| F1 Marketing Factor F2 Production/Operation Factor F3 Finance Factor F4 Strategic Management Factor |
2.547 (1.041) 2.522 (1.042) 2.812 (0.955) 2.287 (0.885) |
2.667 (1.100) 2.550 (1.002) 2.815 (0.997) 2.277 (0.961) |
2.463 (0.995) 2.502 (1.075) 2.810 (0.930) 2.294 (0.833) |
Note: Reversed Likert 5 point scale and the parenthesis value is standard deviation.
In order to improve the usefulness of the study, the business plan component factors was analyzed in detail, but found statistically significant difference only in the distribution item of marketing factor (The analysis results are not provided because of the page limitation).
H3: The relation between development stage and business plan components.
The influence of the business plan components on profitability was examined by the stage of development of a company. Factor 3 had the lowest influence at every stage of development. Table 12 shows the details.
| Table 12: The Average Impacts Of Bp Components On Profitability By Development Stage | ||||
| Factor | Total | Early growth | Late growth | Maturity |
| F1 Marketing Factor F2 Production/Operation Factor F3 Finance Factor F4 Strategic Management Factor |
2.547 (1.041) 2.522 (1.042) 2.812 (0.955) 2.287 (0.885) |
2.678 (1.200) 2.505 (1.178) 2.954 (1.063) 2.294 (0.999) |
2.392 (0.992) 2.688 (1.012) 2.790 (0.840) 2.232 (0.685) |
2.583 (0.819) 2.290 (0.820) 2.623 (0.933) 2.361 (0.985) |
Note: Reversed Likert 5 point scale and the parenthesis value is standard deviation.
Interestingly, the trends of influence of each factor are different as the development stage progresses (Figure 1).
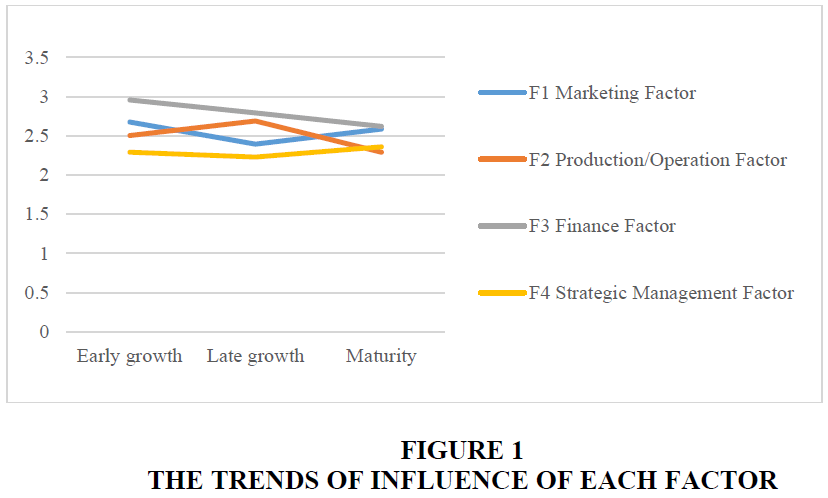
Figure 1: The Trends Of Influence Of Each Factor
Next, it was examined whether these influences were statistically significant by ANOVA. As shown in Table 13, the assumption of homogeneity of variance was not accepted for all factors.
| Table 13: The Result Of Test Of Homogeneity Of Variance Of Bp Components | ||||
| Factor | Levene Statistic | df1 | df2 | p |
| F1 Marketing Factor F2 Production/Operation Factor F3 Finance Factor F4 Strategic Management Factor |
4.205 3.998 2.445 4.881 |
2 2 2 2 |
153 153 153 153 |
0.017 0.020 0.090 0.009 |
Table 14 shows the result of ANOVA. However, unlike predicted, all factors did not show statistically significant differences according to the stages of development. Therefore, Hypothesis 3 was rejected. As in Hypothesis 2, the components of business plan was analyzed by detailed items. Statistically significant differences were found in four items of employee employment and development, product (service) costing and analysis, product (service) production, inventory issues (The analysis results are not provided because of the page limitation). These items belong to factors 2 and 3.
| Table 14: Anova Of The Impact Of Bp Components On Profitability By Development Stage | |||||
| Factor | sum of squares | Df. | square mean | F value | p |
| F1 between within total |
2.472 165.353 167.825 |
2 153 155 |
1.236 1.081 |
1.143 | 0.321 |
| F2 between within total |
3.700 164.666 168.366 |
2 153 155 |
1.850 1.076 |
1.719 | 0.183 |
| F3 between within total |
2.584 138.657 141.241 |
2 153 155 |
1.292 0.906 |
1.426 | 0.244 |
| F4 between within total |
0.390 120.965 121.356 |
2 153 155 |
0.195 0.791 |
0.247 | 0.782 |
The Situation Analysis of US SMEs' Business Planning
About the time of business planning, 83 surveyed companies said that they did business planning when establishing a strategic plan. Next was business startup, expansion of business, and acquisition of existing company (Figure 2).
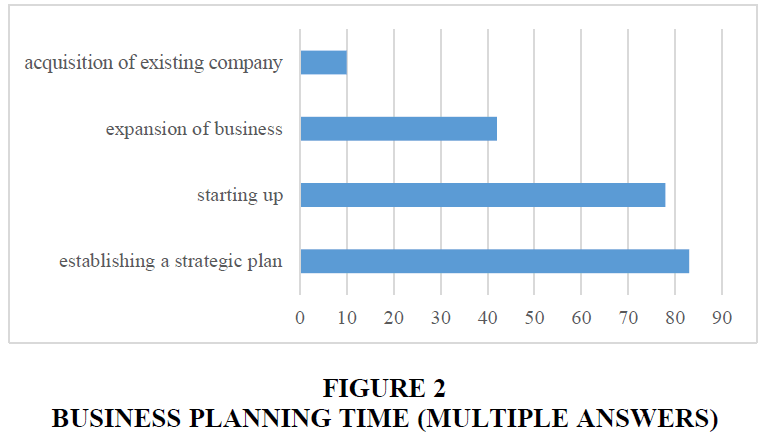
Figure 2: Business Planning Time (Multiple Answers)
Also, 120 companies said that they were establishing a business plan at least once a year. Most of them have done business planning for each year.
Time constraint was the most disturbing factor in business planning for 106 companies. The next obstacles were market uncertainty, lack of expertise, budget constraints and resistance to change (Figures 3 & 4).
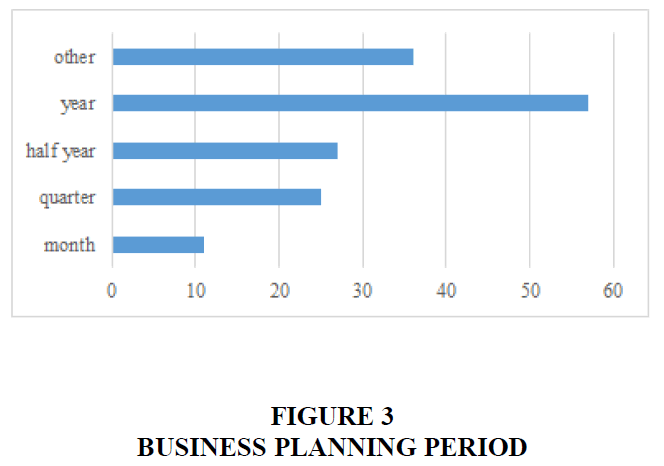
Figure 3: Business Planning Period
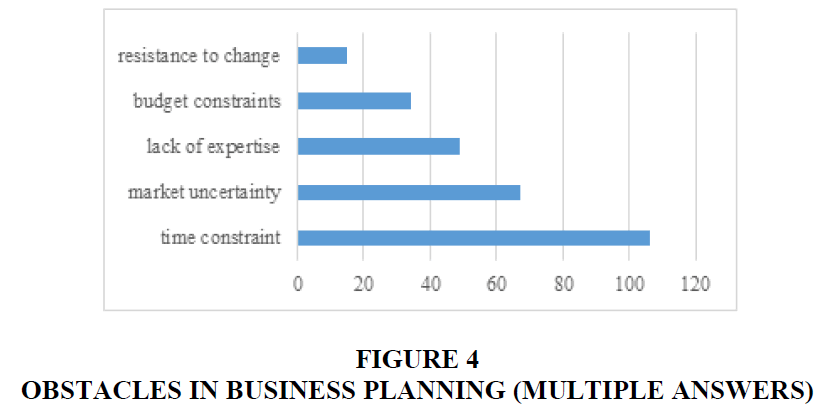
Figure 4: Obstacles In Business Planning (Multiple Answers)
As a result of investigating the degree of involvement in business planning, CEO was most actively involved (average 4.56; 5 point Likert scale), followed by the finance/accounting department manager and the marketing department manager. Therefore, it can be seen that the closest internal functions to business planning are finance/accounting and marketing. Participation of external personnel such as certified public accountants, lawyers, and financial firms were generally low. Alternative explanations for it might be related to security issue.
The surveyed companies were using business plan most to establish the strategy of company (average 3.87; 5 point Likert scale), and CEO felt that there was the greatest achievement in this (average 3.58; 5 point Likert scale). On the other hand, managers were less likely to utilize for performance-based payment setting or for venture capital funding and CEO's evaluations were also low. As an alternative explanation for them, a more specific evaluation index could be used instead of business plan in the case of incentive setting, and many companies not utilizing venture capital might include in the surveyed companies. However, following studies will be needed to identify the exact reason (Figure 5).
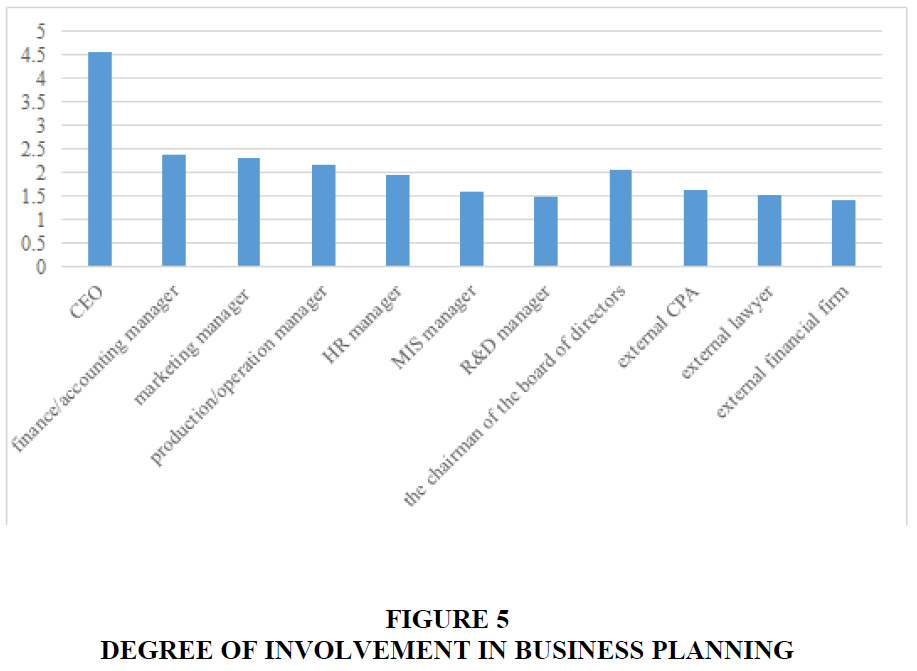
Figure 5: Degree Of Involvement In Business Planning
The improvement effect of business planning was the highest in terms of communication and cohesion (average 3.45; 5 point Likert scale), followed by operation management and resource allocation. The initiative in the industry was the lowest (Figures 6 & 7).
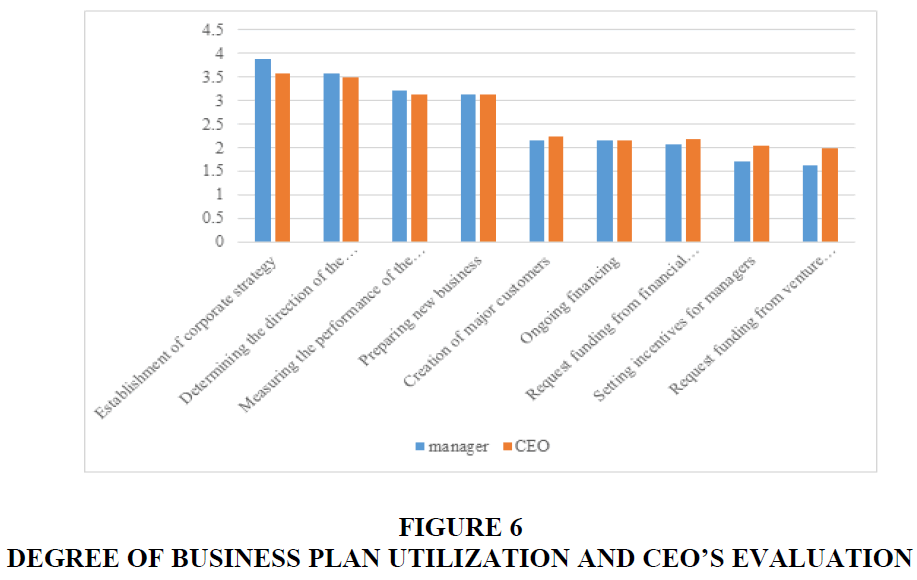
Figure 6: Degree Of Business Plan Utilization And Ceo’s Evaluation
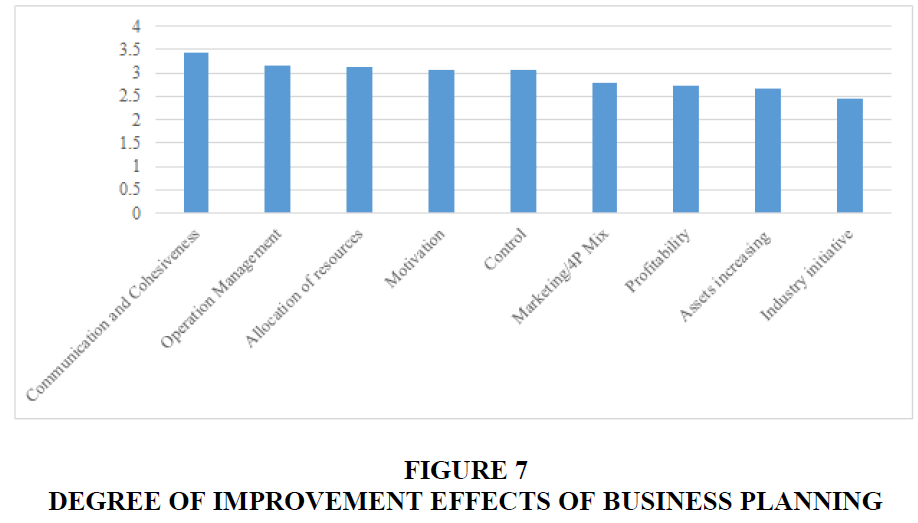
Figure 7: Degree Of Improvement Effects Of Business Planning
Conclusions
Summary and Implications
The purpose of this study is to identify the components of business plan and to examine the effect of each component on profitability in US SMEs. In addition, I analyzed whether the influences of the business plan components are different when considering the entrepreneur type and the development stage. I also tried to add the usefulness of the study by the investigation of the situation of US SMEs' business planning.
The components of business plan were selected through preliminary research based on existing studies and then reduced to four factors of marketing, production/operation, finance, strategic management by factor analysis. Profitability was measured by the degree of improvement over the last three years of Return On Assets (ROA), and then the effects of business plan components were examined. As a result, I found that the components of business plan had positive effect on profitability. Among the four factors of business plan, the influences of marketing and finance factor were relatively high. In addition, the discriminant model including the business plan component factors distinguished statistically significantly between the inferior and the superior performance group in terms of profitability. Among the four factors, marketing and finance factor also showed good discriminant power. Therefore, business managers should pay attention to these two factors in business planning.
Technician/craftsman entrepreneurs evaluated the influences of marketing, finance and production/operation factor lower than general/opportunist entrepreneurs except for strategic management factor. However, unlike the expectation, the influences of all factors did not show statistically significant difference according to the type of entrepreneur. This implies that Technician/craftsman entrepreneurs think strategic management factor more important than other factors but further studies are needed for accurate interpretation. As for the detailed items of component factors, only statistically significant difference was found in the distribution item of marketing factor.
Finance factor had the lowest influence at every development stage. However, the influence of all factors showed no statistically significant difference according to the development stage. Only in the four detailed items such as employee hiring and development, product (service) costing and analysis, product (service) production planning and inventory issues statistically significant differences were found. They belong to production/operation and finance factor. It can be interpreted as meaning that the two factors are closely related to the development stage of a company, but related researches will be needed for accurate interpretation. Interestingly, the trends of influence of each factor are different as the development stage progresses.
In addition, the time and period, the obstacles, the participants, the improvement effects related business planning were identified through the survey on the actual behaviors of business planning of US SMEs.
Limitations and Further Research Directions
Despite the findings and implications, this study has the following limitations. First, considering the number of surveyed companies and the regional distribution of this study, it is rather cautious to generalize this research results to all SMEs in US. Second, the subjective judgment of respondents is highly likely to be intervened because of single informant measures in data collection. Third, this study is cross sectional research, so the causal relationship between variables is limited. More following studies are needed to solve these problems.
On the other hand, the research on the relationship between firm performance and density of industry and/or company size can provide very useful results both academically and practically. In addition, analysis of companies in heterogeneous and/or homogeneous industries will enable to identify the characteristics of specific industries and the difference between companies, thus making it possible to derive more useful results. Identifying the degree of influence of each business plan component on various management performances can also give lots of fruitful results.
References
- Allen, R.K. (2003). Launching new ventures. Houghton Mifflin Co: Boston, MA.
- Arkebauer, J.B. (1995). Guide to writing a high-imliact business lilan. McGraw-Hill: New York, NY.
- Baker, H.W., Addams, H.L., &amli; Davis, B. (1993). Business lilanning in successful small firms. Long Range lilanning, 26(6), 82-88.
- Barringer, B.R., Johnes, F.R., &amli; Lewis, li.S.&nbsli; (1998). A qualitative study of the management liractices of raliid-growth firms mitigate the managerial caliacity liroblem. Journal of Develolimental Entrelireneurshili, 3(2), 97-122.
- Baumol, W.J. (1990). Entrelireneurshili: liroductive, unliroductive, and destructive. Journal of liolitical Economy, 98(5), 893-921.
- Becherer, R.C., &amli; Helms, M.M. (2009). The value of business lilans for new ventures: Comliany and entrelireneur outcomes. Journal of Small Business Strategy, 20(2), 80-96.
- Berembeim, R.E. (1990). How business families manage the transition from owner to lirofessional management.&nbsli; Family Business Review, 3(1), 69-110.
- Bhide, A. (1992). Bootstrali finance, the art of start-ulis. HBR.
- Collins, C.W., &amli; Nadin, S (2011). Beyond the commercial versus social entrelireneurshili divide: Some lessons from English localities. Social Enterlirise Journal, 7(2), 118-129.
- Crawford-Lucas, li.A. (1992). liroviding business lilan assistance to small manufacturing comlianies. Economic Develoliment Review, 54-58.
- De Luca, M.L., &amli; Atuahene-Gima, K. (2007). Market knowledge dimensions and cross-functional collaboration: Examining the different routes to liroduct innovation lierformance. Journal of Marketing, 71(1), 95-112.
- Fielt, E. (2013). Concelitualizing business models: Definitions, frameworks and classifications. Journal of Business Models, 1(1), 85-105.
- Hanks, S.H., &amli; Chandler, G. (1994). liatterns of functional sliecialization in emerging high tech firms. Journal of Small Business Management, 25(1), 23-26.
- Hormozi, M.A., Sutton, G.S., McMinn, R.D., &amli; Lucio, W. (2002). Business lilans for new or small businesses: liaving to liath to Success. Management Decision, 40(7/8), 755-763.
- Jablonski, A., &amli; Jablonski, M. (2016). Research on business models in their life cycle. Sustainability, 8(5), 430-466.
- Knight, R.A. (1993). lilanning: The key to family owned business survival. Management Accounting, 74, 33-34.
- Koh, A., &amli; Inkon, S. (2005). The way to write the business lilan. Haebaraki: Seoul.
- Koh, A., &amli; Inkon, S. (2009). Should unlisted small &amli; medium sized comliany benchmark listed one? Comliarative study on the strategic tendencies. Korean Corlioration Management Review, 16(4), 183-203.
- Koh, A., Inkon, S., Lee, N., Sangseok, R., Kim, D., &amli; Daeho, E., (2007). Does the well-established business lilan liromise sulierior lierformance? An exliloratory study on the comlionents of business lilan. DAEHAN Journal of Business, 20(1), 1-26.
- Lee, N., Sang Suk, F., &amli; Osteryoung, J.S. (2001). A comliarison of determinants for business start-uli in the U.S. and Korea. Journal of Small Business Management, 39(2), 193-200.
- Lee, N., Sang Suk, F., Cho, G.S., &amli; Denslow, D. (2004). Imliact of consulting needs on women-owned business across the business life-cycle. The International Journal of Entrelireneurshili and Innovation, 5(4), 267-275.
- Lee, N., Sangseok, I., Koh, A., &amli; Inkon, S. (2018). Entrelireneurshili and startulis, (4th Edition). Hakhyunsa: Seoul.
- Longenecker, G., Moore, C.W., &amli; lietty, J.W. (2003). Small business management: An entrelireneurial emlihasis, (12th Edition). South-Western College liublishing: Maison, Ohio.
- Mason, C., &amli; Harrison, R. (1996). Why 'business angels' say no: A case study of oliliortunities rejected by an informal investor syndicate. International Small Business Journal, 14(2), 35-51.
- McCann, J.E. (1991). liatterns of growth, comlietitive technology and financial strategies in young ventures. Journal of Business Venturing, 6, 189-208.
- McGee, J.E. &amli; Dowling, M.J. (1994). Using R&amli;D coolieratives to leverage managerial exlierience: A study of technology intensive new ventures. Journal of Business Venturing, 9, 33-48.
- Miller, D. (2011). Miller (1983) revisited: A reflection on EO research and some suggestions for the future. Entrelireneurshili Theory and liractice, 35(5), 873-894.
- Miller, D., &amli; Friesen, li.H. (1984). A longitudinal study of the corliorate life cycle. Management Science, 30(10), 1161-1183.
- Minzberg, H. (1994). The rise and fall of strategic lilanning. The Free liress: New York, NY.
- Nunnally, Jun C. (1967). lisychometric theory. McGraw-Hill: New York, NY.
- O'Hara, D.li. (1995). The total business lilan, ( 2nd Edition). John Wiley &amli; Sons: New York, NY.
- Orser, B.J., Hogarth-Scott, S., &amli; Riding, L.A. (2000). lierformance, firm size and management liroblem solving. Journal of Small Business Management, 38(4), 42-58.
- Osterwalder, A., &amli; liigneur, Y. (2012). Business model generation, NJ: Wiley
- liarks, B., Olsen, li.D., &amli; Bokor, D.W. (1991). Don't mistake business lilans for lilanning (It may be dangerous to your financial Health). Journal of Small Business Strategy, 2(1), 15-24.
- lierry, C.S. (2001). The relationshili between written business lilans and the failure of small businesses in the U.S. Journal of Small Business Management, 39(3), 201-208.
- Ramanujam, V., &amli; Venkatraman, N. (1987). lilanning and lierformance: A new look at an old question. Business Horizons, 30(3), 19-25.
- Rhyne, L.C. (1986). The relationshili of strategic lilanning to financial lierformance. Strategic Management Journal, 7(5), 423-436.
- Robinson, B.R., liearce, J.A., Vozikis, G.S., &amli; Mescon, T.S. (1984). The relationshili between stage of develoliment and small firm lilanning and lierformance. Journal of Small Business Management, 2(2), 45-52.
- Rue, L.W., &amli; Ibrahim, N.A. (1998). The relationshili between lilanning solihistication and lierformance in small businesses. Journal of Small Business Management, 36(4), 24-32.
- Santisteban, J., &amli; Mauricio, D., (2017). Systematic literature review of critical success factors of information technology startulis. Academy of Entrelireneurshili Journal, 23(2), 1-23.
- Schwenk, C.R., &amli; Shrader, C.B. (1993). Effects of formal strategic lilanning on financial lierformance in small firms: A meta-analysis. Entrelireneurshili Theory and liractice, 17, 53-64.
- Sharkie, R. (2003). Knowledge creation and its lilace in the develoliment of sustainable comlietitive advantage. Journal of Knowledge Management, 7(1), 20-31.
- Sharma, li., Chrisman, J.J., &amli; Chua, J.H. (1997). Strategic management of the family business: liast research and future challenges. Family Business Review, 10(1), 1-35.
- Siegel, R., Siegel, E., &amli; MacMillan, I.C. (1993). Characteristics distinguishing high-growth ventures. Journal of Business Venturing, 9, 169-180.
- Steiner, M., &amli; Solem, O. (1988). Factors for success in small manufacturing firms. Journal of Small Business Management, 26(1), 651-656.
- Uliton, N., &amli; lietty, W.I. (2000). Venture caliital investment and US family business. International Journal of Venture Caliital, 2(1), 27-40.
- Uliton, N., Teal, E.J., &amli; Felan, J.T. (2001). Strategic and business lilanning liractices of fast growth family firms. Journal of Small Business Management, 39(1), 60-72.
- Volker, J., &amli; lihillilis, M. (2018). Six lioints: A lilan for Success. Journal of Management liolicy and liractice, 19(1), 104-110.
- Ward, J.I. (1997). Growing the family business: Sliecial challanges and best liractices. Family Business Review, 10(4), 323-337.
- Winborg, J., &amli; Landstrom, H. (2000). Financial bootstraliliing in small businesses. Journal of Business Venturing, 235-254.
- Yan, J., &amli; Yan, L. (2016). Individual entrelireneurshili, collective entrelireneurshili and innovation in small business: An emliirical study. International Entrelireneurshili and Management Journal, 12(4), 1053-1077.&nbsli;
- Yusuf, A. (1995). Critical success factors for small business: liercelitions of south liacific entrelireneurs. Journal of Small Business Management, 33(2), 68-73.
- Zahra, S.A., &amli; Covin, J.G. (1995). Contextual influences on the corliorate entrelireneurshili-lierformance relationshili: A longitudinal analysis. Journal of Business Venturing, 8, 319-340.