Research Article: 2022 Vol: 26 Issue: 6S
A Modeling for Unreasonableness Audit Expectation Gap, Assessing Fraud Impact and Audit Accuracy
Abbas Lari Dashtbayaz, Qaenat Branch, Islamic Azad University, Qaenat, Iran
Mahdi Salehi, Ferdowsi University of Mashhad, Mashhad, Iran
Mahmoud Mousavi Shiri, Payamenoor University, Tehran, Iran
Keywords
Audit Expectation Gap, Unreasonableness Expectation Gap, Auditor's Accuracy, Fraud In Financial Statements
Abstract
This paper proposes a model for the unreasonableness audit expectation gap and assesses the relationship between fraud in financial statements, audit precision, and total and unreasonableness audit expectation gap. This paper utilizes a descriptive-correlation procedure based on published information from listed firms on the Tehran Stock Exchange during 2013-2018 using a sample of 128 firms (699 observations). The method used for hypothesis testing is panel data linear regression. The results show a negative and significant relationship between auditors' accuracy and the total and unreasonableness audit expectation gap. A positive and significant association between fraudulent financial statements and the total and unreasonableness audit expectation gap is found. Some additional tests are also used to ensure the results of the main methods and confirmatory tests are totally in line with that of the main method.
The present study presents a new model for measuring the unreasonableness audit expectation gap, the most difficult of the kind among users and auditors. This factor is assessed in the emergent financial markets, like Iran, with an extremely competitive audit market to specify the relationship between fraud in financial statements and audit precision and the total and unreasonableness audit expectation gap. It can provide useful information in this field.
Introduction
There are several false imaginations about the auditing profession, one of which believes that auditors provide absolute assurance about financial statements' accuracy (Hassink et al., 2009). Moreover, numerous studies, like that of Mock, et al., (2012), indicate that financial statement users search for further information in auditors' reports. The external imaginations of society from the role and services of auditing is vital for creating a balance between the gap and auditors' performance. The first place the audit expectation gap hurts is the credit of auditing. The auditing profession decreases the resultant stresses from the risk of firm fraud (Hassink et al., 2009). According to the study of Porter, et al., (2012), the created expectation gap between auditors and other financial users is 43% because of standards failure, 50% of rationality distance, and only 7% due to weak performance of auditors. Here, we discuss some factors that show the role of auditors in firm fraud. Auditors are likely not to shoulder their duties properly as society expects.
In most cases, the failures of a business are due to dominant managers or shareholders' roles. Under such circumstances, the structures may not exist that lead to the identification of illegal and unethical actions without any serious control. External auditing is an important part of supervising firms. In this case, the corporate governance structure may help understand auditors' role. This may place auditors under pressure and causes them to lose their dominance on activities, do not perform as expected, and experience failure in their duties. Even the worst thing occurs when the auditor loses or faces a decrease in his independence in long-term audits due to some connections between the employer and auditor or audit fees, which causes his duty not to be implemented society expects. In other words, these factors may make a deficient auditor (Hassink et al., 2009). Corporate fraud is an operational risk the business setting faces today (Kamil Omoteso & Musa Obalola, 2014). The reason that can bring about a kind of expectation gap between auditors and society may originate from a weakness in standards, not deficient auditors. Some standards can limit auditing activities and hinder the auditors from doing what they want to, and/or the standards may suffer a kind of weakness to be misused (Hassink et al., 2009).
Different groups have different knowledge levels. Non-auditors can be divided into two groups internal and external. The former includes the employer's management and the governance system, and the latter comprises those external users that use financial statement information, like investors and creditors. These groups are highly likely to be less informed than internal groups of audit standards, which causes them to expect more from financial statement audits (Ruhnke & Schmidt, 2014). To minimize the audit expectation gap, most studies indicate those audit standards should be in line with total expectations and more effective awareness of people from the amount and type of audit (Enroe & Martens, 2001; Salehi, 2007). Most conducted studies take into account the topic of advancing audit advantages. A bunch of evidence presented recently by Vanstraelen, et al., (2012) shows auditors are interested in presenting further information about their findings, including accounting estimations. Financial information users are also willing to acquire such information. Since financial managers play a significant role in internal controls, they can impact the fraudulent actions, and board members can play special roles in such actions. Typically, auditing reports to the board of supervisors or the audit committee. On the other hand, the supervisory board has a particular responsibility when it finds fraud management or distrust. Deciding fraud-less conditions in the firm are up to the supervisory board. The finance manager, finance supervisor, and supervisory board are management members. Finally, bankers and other financial users utilize financial statements, where the expectation gap forms (Hassink et al., 2009).
Broadly, this paper aims to show, first, whether the applied methods, so far, for calculating the audit expectation gap are correct or not, specify the dis/advantages of the definitions presented during the audit expectation gap's history and express how we should deal with the proposed weaknesses.
Moreover, in the upcoming sections, the paper aims to assess the defined audit expectation gap by Salehi, et al., (2016; 2018; 2019), divide that into its contributing factors, and present a strategy to exclude the expectations from the auditor performance from the total expectation gap. In the first step, according to Salehi, et al., (2019) study, we first compute the total expectations gap. In the following step, we design the following model that shows the total expectation gap originates from weakness in the auditor's performance, standards, and other Unreasonableness expectations of society from auditors:
Audit expectation gap = weakness in the performance of standards and auditor + other Unreasonableness expectations.
The left side of the equation above, the total expectation gap, is calculated by Salehi, et al., (2019). This paper attempts to assess the audit expectation gap's unreasonableness section using the complementary model of Salehi, et al., (2019) and adding the auditors' and standards' operational weaknesses. Hence, the present study aims to compute the section of "other unreasonableness expectations from the auditing profession right after calculating the total gap and the gap generated from weakness in auditors' performance and standards. On the other hand, since this is the first time this paper attempts to carry out the quantitative calculation and present a conceptual model about the unreasonableness expectation gap from auditing, it can present updated facts and complete the topical literature field. Moreover, this paper provides useful information for law-makers, stock exchange agents, shareholders, and all financial statement users who benefit from audit services and help the auditing profession have a more comprehensive view of society, leading to the decline of society's unreasonableness gap.
Theoretical issues and hypothesis development
For several years, the expectation gap between auditors and other financial users has been discussed. Such a gap causes the distrust of financial information users to auditors, leading to distrusting others to audit reports (Akinbuli, 2010). Thus, the auditing profession will lose its significance and credit. To assess the expectation gap, this paper attempts to quantitative factors instead of qualitative ones used by other studies to assess the total and unreasonableness expectation gap of some of the variables created among financial users' users quantitatively.
The term "expectation gap" was introduced by Liggio (1974). He defined the term as the difference between auditors and financial statement users' expected performance levels and considered it a major and fundamental issue. The American Association of Official Accountants assigned the Auditors' Responsibility Committee to investigate and confirm such a gap.
Audit firms were established as supervisors to the financial performance of firms to give credit to a firm's financial statements and lower the chance of fraud on the one hand. On the other hand, the representatives ensure that financial statement information is honest and not altered. Wallace (1987) states that auditing determines the quality of reported financial information and provides quality and special economic profits for the organization and external members. Thus, along with the formation of audit firms, a sense of confidence is shaped in financial statement users expressing that audit reports with no secrecy indicate the financial status to make the best financial decision based on such a report. Auditing is a systematic and independent process to determine whether existing activities and their performance are officially compatible with issues and requirements related to planning or not (Mostafavi, 2012). Therefore, the presence of the auditing profession is useful for both the firms and financial information users. Currently, auditing has become an inseparable part of firms and almost found its place in each country's legal status (Gobadgoy, 2015). Auditing can be considered as a social performance (Flint, 1998). Auditors' roles will change along with society's people and groups (Porter et al., 2005). From the mid-1800s to the beginning of the 1900s, audit performance has been considered "a traditional organizational audit role" (Porter et al., 2005). During the 1840s-1920s, auditors' role was mainly concentrated on tracking frauds (Masoud, 2017). Between the 1920s-1960s, however, the initial goal of auditing has changed from diagnosing fraud and mistakes in adding credit to financial statements (Li & Ali, 2008). The empirical studies of the 1970s-1980s by Li (1970), Bik (1973), Anderson & Ko (1974); Austin (1990); Porter (1991); Porter & Gothrope (2004) show that public people still consider fraud detection as a major concern of the auditor. There is still an in-depth understanding of the auditor's required inspection to identify fraudulent actions and illegal measures (Masoud, 2017). Major failures within recent decades have caused the auditing profession to be at the center of attention. Despite audit firms' presence, society did not expect such massive failures, so financial information users' expectations have changed from auditors. Such failures showed that what people have expected from auditors is different from what auditors did, which led to a gap between users and auditors. So the expectations of financial information users have changed, and a part of such a gap originates from public expectation from the role of auditing, the goals that are expected from the auditing profession to reach, and the manner of evaluating the quality of audit services (Behzadian & Izadnia, 2017). The initial analyses, however, by the Canadian Association of Official Accountants (1988); Porter (1993), illustrate that weak performance, insufficient standards, and unreasonableness expectations are among the factors that lead to the creation of an audit expectation gap (Masoud, 2017). Moreover, Price & Kliminnos (1996); Boyd, et al., (2001); Mac Enron & Martins (2001) argue that such a gap derives from misinterpretation and misunderstanding of the performance of auditors and the role of auditors by users. However, there is a bunch of evidence showing that financial statement users and public people, at a broader level, are not informed of auditors' duties, which leads to the audit expectation gap (Gobadgoy, 2015). As of the 1970s, the expectation gap has been common in studies. Since the evidence has increasingly substantiated the presence of such a phenomenon (Gobadgoy, 2015). The Cohen Commission (1978) declares that the gap is the difference between public beliefs and needs and what the auditor performs logically. In this regard, Guy & Salivan (1988) describe the audit expectation gap as the difference between public opinions about auditors' responsibilities and beliefs about their responsibilities. In other words, such a gap in expectations is related to complications and misunderstanding of nature, objective, and the ability of auditors, which is observed by society (Porter, 1993). Deniz (2010) defines the audit expectation gap as the difference between users' and auditors' beliefs and needs. Dibia (2015) believes that an expected gap exists between auditors and users of audit services that explain opinions about auditors' duties and responsibilities and send messages in audit reports. Lazaross Eld (2017) states that the expectation gap is the difference in the auditor's and public's beliefs and interests concerning auditors' duties and responsibilities. In other words, the expectation gap is the difference between what people and users of financial statements perceive as the role of auditing and what is expected from the auditing profession during the auditing process. Regardless of financial statement users and public people, auditors may understand some of the different or even worse interpretations that are not in line with the auditing profession's standards (Ojo et al., 2016). It can be said that the reason for such a gap is both the auditors and the financial statement users. Considering the entire domain of the audit expectation gap is a matter of significance and can be limited by lowering society's expectations and/or improving the perceived performance (Porter, 1993). Audit quality that determines the audit performance relies on various factors, including auditors' ability (e.g., knowledge, experience, compatibility) and technical efficiency and professional implementation (e.g., independence, impartiality, professional caring, conflict of interest, and professional judgment). So the identification and consideration factors related to auditors in this gap and alleviating can lower this gap (Behzadian & Izadnia, 2017). Different factors contribute to the expectation gap from the users' and auditors' sides, as mentioned previously in the literature. One factor that can increase/decrease the auditors' expectation gap is the auditor's psychological characteristics. During a lifetime, people deal with situations several times that they should decide. People's decisions are influenced by needs, interests, tastes, and moral and psychological characteristics throughout life and in different situations. We can say that such factors contribute directly to the decisions of people. A firm manager or the auditor of an organization has to decide during his/her term of service, which is on firm performance, investors, etc. Auditing is a judgmental process, and the auditor should arrive at decisions and judgments (Rahimian, 2005). Audit quality originates from judgment quality and auditors' decisions, so auditors should be responsible for their audit reports' performance and results. Auditors' ability to overcome different situations and make high-quality judgment relies on their attempts to improve efficiency (Salehi & Dastanpour, 2018). To decide more efficiently, auditors are influenced by various motivational factors (Alexander et al., 2012). These motivational factors divide into two groups internal and external (Salehi & Dastanpour, 2018).
Boner & Sprinkle (2002) claim three personal, duty-dependent, and environmental variables that impact performance. Moreover, according to Zhang (2018), the partner's narcissism will improve audit quality by elevating the auditor's independence instead of the auditor's qualification. Hence, getting familiar with the auditor's psychological characteristics and their effect can enhance the auditor's performance and lower the expectation gap from the auditor's side. Among the psychological characteristics, we can refer to narcissism. Numerous studies carried out so far (Hamfberi et al., 1992; Beti et al., 1998; Best et al., 2001; Gobadgoy, 2015; Salehi, 2011, 2016, 2019; Behzadian & Izadnia, 2017; Mansour & Tangol, 2018) during 1970-2019 on audit expectation gap. But none of them focused on the effect of the auditor's psychological characteristics on such an expectation gap, so this paper aims to analyze the effect of narcissism as a psychological factor on the expectation gap. By examining the effect of psychological characteristics on expectations, the auditor aims to figure out whether the auditor's expectations are under the influence of narcissism or not, and if yes, is the impact positive or negative. Based on such results, the auditor would decide to either strengthen or debilitate the narcissism. Since this is the first paper to study the effect of psychological characteristics on expectations, the results can lend a helping hand to the auditing profession and the users of audit reports.
Anderson, et al., (1993) show that judges have relatively less valuable evaluations from auditors' performance than auditors themselves, indicating an expectation gap. Martinz (2000) shows that the audit expectation gap forms since respondents are less acquainted with accounting performance and auditing. More specifically, due to users' misuse of their total duties and their role in detecting frauds. Olanjo & Linera (2012) indicate that the expectation of users of audited financial statements and their reliance on the duties, authorities, and responsibility of auditors become uncontrollable and contrast with what is stipulated in charts and regulations. Tayebi Noghandi & Fong (2013) perceive that experience and knowledge factors can remarkably lower the audit expectation gap. Moreover, they notice that the audit expectation gap negatively contributes to the quality of loan decisions and supports its mediatory role. Opera (2015) declares that there is, in fact, an expectation gap in the role of auditors in audit firms, and such an analysis reveals a positive correlation exists between the audit expectation gap and investor's perception.
Gobadgoy (2015) confirms the audit expectation gap even among senior accounting students. Pourheidari & Abosaeidi (2011) show some predicted auditing gaps in the areas of auditor's responsibility, fraud detection, internal control accuracy, and providing financial statements. Ons, et al., (2016) figure out that training auditing cannot lower such a gap but can change students' views concerning auditors' responsibility to prevent and detect errors, fraudulent actions, and illegal actions. Salehi (2016) observes an expected gap between auditors and investors. Behzadian & Izadnia (2017) notice that specialists in the auditing process, as an independent auditor and/or financial statement presenter, and people's professional expertise in the expectation gap are not contributing factors to the audit quality. While auditing regulations, the size and quality of audit firms are under the influence of people's expectation gap. Comarry, et al., (2017) perceive that the audit expectation gap exists and that audit training contributes to declining such a gap. Lazaroos Eld (2017) shows that auditing education affects the decline of the audit expectation gap, especially in auditors' responsibility for holding accounting records, management responsibility for delivering annual financial statements, and auditors' judgment for selecting auditing methods. Masoud (2017) provides much basic evidence about the audit expectation gap among undergraduate students of state-owned and private universities about issues related to the auditor's roles and responsibilities. Mansour & Tangol (2018) figure out that the audit expectation gap can be neutralized through the experiences, training, and endeavour for auditors and more training sessions of the financial statement users about the auditing profession's role and nature. The gap can also be filled among external auditors and shareholders, but it cannot be eliminated, and better communication between auditors and society can lower the gap.
Salehi (2011) classified the expectation gap as follows:
1) Weakness of Standards
- Lack of sufficient and suitable standards (the absence of sufficient and suitable standards),
- The presence of insufficient compiled standards,
- The responsibility of the auditor for exploring fraud and any error
2) Weakness of performance
- Non-audit services performed by the auditors,
- Disqualified auditors,
- Dependent auditors,
- No relationship among auditors (weak relationship among auditors), and;
- Personal economic interests of auditors.
3) Unreasonableness expectations
- Lack of understanding of users,
- Absence of correct interpretation of users,
- Users' expectations from standards,
- Great expectations of users from auditors' performance, and;
- Unawareness of users of auditing responsibilities and restrictions.
Salehi,et al., (2019) use a quantitative model to measure the audit expectation gap and express that model residuals' absolute value equals auditors' total expectation gap.
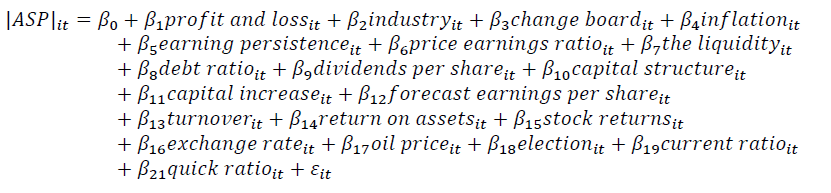
To assess the expectation gap, Salehi, et al., (2019) first compute the absolute value of stock price changes by using the contributing factors, then express that the absolute value of the following model errors shows the audit expectation gap:
Model (1)
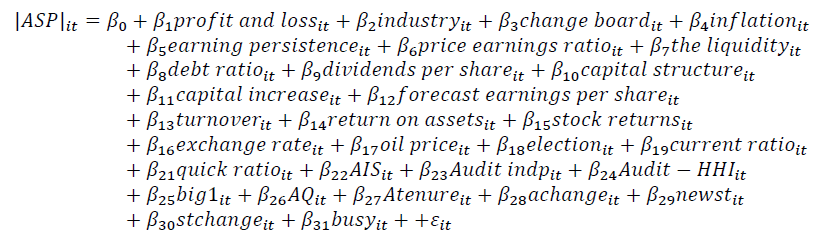
In this paper, we compute the unreasonableness audit expectation gap using the Salehi, et al., (2019) model, as stated above and change that model to the following model. We insert logical expectation values to the above model that measures the total expectation gap. These values include variables related to auditors' performance (e.g., auditor's industry specialization, auditor's independence, auditor's accuracy, audit firm magnitude, audit quality, auditor's tenure, auditor change, and audit market share) and value related to weakness in standards (e.g., changing standards and setting new standards). These variables are values related to performance weakness and the mentioned standard in Salehi's conceptual expectation gap framework (2011) that have changed to the following model after adding to the above model. According to the conducted studies (De Muylder, Hardies, & Breesch, 2012; Fulop et al., 2019; Kumari, Ajward, & Dissabandara, 2017; Rehana, 2010; Siddiqui, Nasreen, & Choudhury-Lema, 2009؛ Christopher Humphrey et al., 1993; Salehi, 2011؛ Porter et al., 2012; Teck Lee et al., 2009), these variables decline logical expectation gap from the auditing profession.
Model (2)
In model (2), the absolute value of residuals (regarding the model of Salehi, et al., (2019)) is equal to other factors affecting the audit expectation gap (unreasonableness expectations) that we were not able to measure in the model. After calculating the audit expectation gap's unreasonableness, we attempt to examine the relationship between fraud and auditor's accuracy and total/unreasonableness expectation gap using the above models. By increasing the information asymmetry between the owner and the agent, fraud in business firms from the managers' side will go up. Auditors' attempt to prevent the audit expectation gap, which is exploring and detecting different types of fraud from the clients and financial statement users' perspective is a reason for the present study to assess the effect of non/exploration of fraud and auditors' accuracy in the audit process on society expectation gap from auditors. Fraud includes incorrect evaluation of resources or a misleading and distorted report about available resources, such that it is far from the elements of conservative management (Salehi, 2008). Recent financial scandals, including Enron in the U.S., have caused different countries to restate auditing, corporate governance, and financial reporting rules.
Carlo, et al., (2006) state that the SOX Act outlined in the U.S. in 2002 to improve the financial credit combat fraudulent financial reports and accounting corruption in firms helps audit firms' failure to join larger audit firms set punishment for frauds. Given the audit objectives, Lin & Chen (2004) show that financial statement users believe that auditors should assess financial statements' accuracy explore major frauds and errors in financial statements and report them to the audit reports. Further, Best et al., (2001) also state that financial statement users consider fraud detection as the main duty of auditors and argue that the none-exploration of fraud in financial statements from the auditors' side will increase the audit expectation gap. Harold, et al., (2009) state that the users' expectations from auditors for fraud detection and fraudulent financial reporting can greatly help them set regulations and principles related to the audit expectation gap. Obaka (2016) found that the fraud in financial statements and failure in detecting them from the auditors' side will increase auditors' unreasonableness expectation gap, leading to the growth of the total audit expectation gap. Auditor's accuracy in performing the audit process will lower the audit expectation gap to a great extent. According to Folp, et al., (2019), the unreasonableness expectation gap is the most difficult part of the audit expectation gap. It is related to the beliefs and understandings of different beneficiary groups. In other words, the gap related to standards can be improved by enhancing standards and setting new standards to satisfy financial statement users' needs. Besides, the gap related to auditors' performance can be decreased from many aspects, like evaluating peers, supervising auditors' performance by authorities and professional institutions, forming classes, and requiring training to increase auditors' qualification, knowledge, and expertise. However, controlling the understandings and views of different financial statement users and other social groups is not an easy task. Almero & Bardi (2002) point out that auditors may perform their duties following the auditing standards due to negligence and failure to detect frauds from the beneficiaries' side. Sika, et al., (1998) assessed the audit expectation gap from different social, political, and historical aspects and concluded that the audit expectation gap is inevitable.
The conducted studies show that fraud detection, increasing the accuracy of auditors and training auditors (De Muylder, Hardies, & Breesch, 2012; Fulop et al., 2019; Kumari, Ajward, & Dissabandara, 2017; Rehana, 2010; Siddiqui, Nasreen, & Choudhury-Lema, 2009), setting new auditing standards (Christopher Humphrey et al., 1993; Salehi, 2011), supervising the performance of auditors, (Porter et al., 2012), and developing auditors' responsibility (Teck Lee et al., 2009) lower the audit expectation gap.
According to Fulop, et al., (2019), it is not likely that different groups of financial statement users and beneficiaries understand auditors' duties, decrease their unreasonableness expectations, and be directed toward logical expectations. Al-Dhubaibi (2020) also claims that there is a significant and positive relationship between fraud in financial statements and the audit expectation gap, so the hypotheses of the study are as follows:
H1: There is a positive and significant relationship between fraud in financial statements and the audit expectation gap.
H2: There is a negative and significant relationship between auditors' accuracy and audit expectation gap.
H3: There is a positive and significant relationship between fraud in financial statements and the unreasonableness audit expectation gap.
H4: There is a negative and significant relationship between auditors' accuracy and the unreasonableness audit expectation gap.
Methodology
The present study's statistical population is all listed companies on the Tehran Stock Exchange during 2013-2018. The systematic elimination method is used for sampling, and after applying the following conditions, the sample of the study will be selected:
1- Being listed in Tehran Stock Exchange up to the end of 2012,
2- Companies should have a continuous activity and their stock being traded during the study (their transaction halt should be more than 6 months),
3- Presented the required financial information during the study, and;
4- Not affiliated with investment companies, banks, insurance, and financial intermediaries.
The final sample is obtained, given the collected information at the end of 2018, based on Table 1.
| Table 1 The Number of Firms in The Statistical Population |
||
|---|---|---|
| Description | Eliminated firms in total periods | Total No. of firms |
| Total listed firms on the Tehran Stock Exchange | 395 | |
| Eliminating financial intermediaries, financial supply, insurance, and investment firms | 88 | |
| Eliminating firms entered the Stock Exchange during the study period | 24 | |
| Eliminating due to lack of access to information | 96 | |
| Statistical population | 128 | |
The required raw and primary information and data for hypothesis testing are collected using the Tehran Stock Exchange's databank, including Tadbir Pardaz and Rah Avaran-e Novin and the published reports of Stock and Securities of Tehran via direct access (by analyzing the disclosed reports on Codal Website, the data are gathered manually) and CDs of Tehran Stock Exchange and the rdis.ir website and other related websites.
Data analysis method
The data analysis method is cross-sectional and year-by-year (panel data). The multivariable linear regression method is used to test the hypotheses in this study. The descriptive and inferential statistical methods are used for analyzing the obtained data. The frequency distribution tables are used for describing data. At the inferential level, the F-Limer Test, Hausman Test, Test of normality, and Multivariable Linear Regression Test are used for hypothesis testing.
Research Model
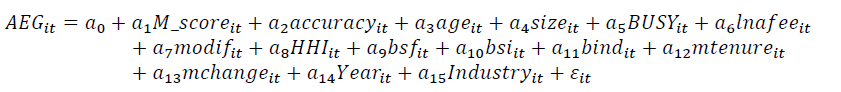
Model (3) is used as follows to examine hypotheses 1 and 2:
Model (3)
Model (4) is used as follows to examine hypotheses 3 and 4:
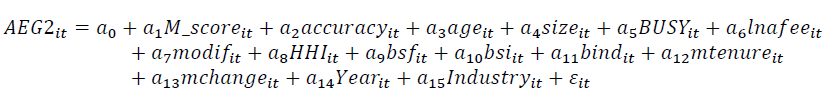
Where
Dependent variables:
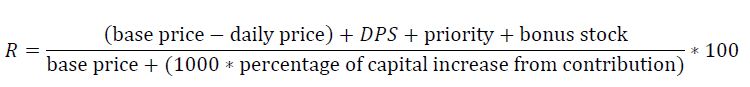
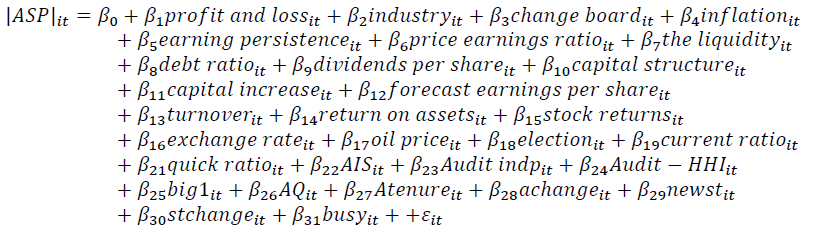
AEG: following the study of Salehi, et al., (2019), model (5) is used to assess the audit expectation gap. First, the absolute value of stock price changes is computed using the determining factors, then the absolute values of model errors will show the audit expectation gap.
Model (5)
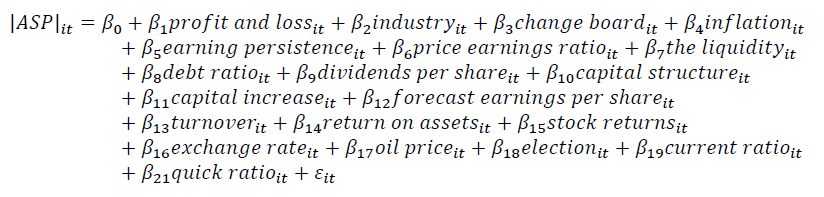
Where
|ASP| is the absolute value of stock price changes three days before publishing an audit report and three days after.
Profit and loss: We assess the profit and loss using 0 and 1. If profitable, it would be 1; otherwise, it is 0.
Industry: by the industry, we mean what class the firm will be placed in, given the type of activity and its major production. In this field, the classification of the Tehran Stock Exchange is used.
Chang board: using the 0 and 1 method, we analyze the changes of the board of directors, such that if at least one of the members has changed, it is 1; otherwise, it would be 0.
Inflation: the rate of inflation, which the Central Bank explores.
Earnings persistence is achieved from model (6) errors.
Model (6)
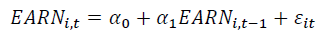
EARNit: the profit in the current period,
α1: the (independent variable coefficient) degree of earnings persistence during the study,
EARN, t-1: profit of the previous period,
ɛit: regression model residual,
Price-earnings ratio: stock price divided by the profit per share (P/E),
The liquidity: stock liquidity is calculated as follows:
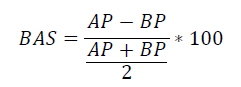
BAS: The range of the proposed price difference for selling and buying the firm stock,
AP: average proposed price for selling the firm stock,
BP: average proposed price for buying the firm stock,
Debt ratio: total debts divided by total assets,
Dividend per share: dividing total profit payable into total firm stocks,
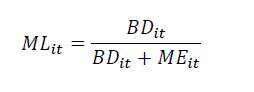
Capital structure: the capital structure is calculated as follows:
MLit: financial leverage based on the market value for the company i in the th time,
BDit: book value of debts for the company i in the th time,
MEit: the market value of dividends for the company i in the th time, (market value of the dividend is computed by multiplying the stock market value by its number),
Capital increase: using the 0 and 1 method, we analyze the capital increase, such that if the capital increase occurs, the value is 1; otherwise, it would be 0,
Forecast earnings per share: if the real profit of the company i in the year t is more than the predicted profit 1, otherwise, it would be 0.
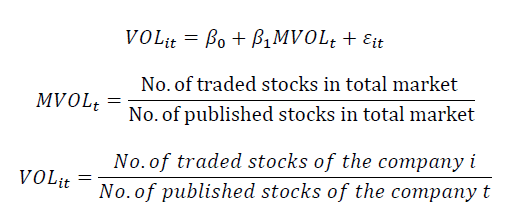
Turnover: the number of traded stocks of the company i in the year t is considered the turnover volume. The model's errors (7) are used to the extent possible to control the price impacts.
Model (7):
Return on assets: net income divided by the total average of assets,
Stock returns:
Exchange rate: rate of currency change which is extracted from the Central Bank,
Oil prices: oil price,
Election: election can be assessed using the 0 and 1 method, such that if there is an election during the year under study 1, otherwise, it would be 0,
Current ratio: current assets divided by the current debt,
Quick ratio: current assets minus inventories divided by the current debts.
AEG2: to calculate the unreasonableness expectation gap, model (5), which the adjusted model (2) of Salehi, et al., (2019) is used:
Model (8)
Where
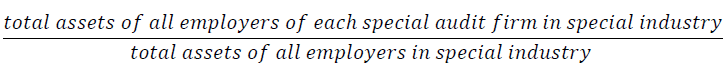
AIS: auditor specialization in the industry i in the year t that in this paper, the market share is used as an index for auditor industry specialization because it shows the priority for industry to other auditors. The more the auditor's market share, the more industry specialization and auditor experience than other rivals. Auditor market share is computed as follows:
Equation. (1)
In this paper, those firms are considered industry specialized that their market share, namely the so-called ratio, is more than [(total existing firms/1)*1.2]. After calculating an audit firm's market share, if the obtained value is more than the above equation's value, the audit firm is specialized in that industry. Hence, an audit firm is industry specialized 1; otherwise, 0 will be assigned (Habib & Yahoodian, 2011).
Audit indp: auditor's financial independence equal to each firm's total receivable fees during a year from the employer divided by auditors' total receivable fees per industry. If the ratio is more than 0.5, it means no independence and 0 will be assigned, and 1 refers to the auditor's financial independence.
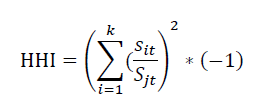
Audit-HHi: concentration in auditor's market, Similar to the previous studies (Eshleman & Lawson, 2016; Huang et al., 2015; Newton et al., Newton et al., 2013; Kallapur et al., 2010; Kallapur et al., 2008; Peno & Walter, 1996; Walman, 1996), this paper has used the index of auditor concentration. The lower the value of this index, the higher the concentration and competition in the market. Bon et al. (2012) and Kallapur et al. (2008) state that this index's results can be considered inversely for audit market competition. Choi and Zaqal (1999) conclude a negative and significant relationship between concentration and competition in the audit market. In this paper, similar to the study of (Marquez & Steven, 1997), this index is used in the industry section. Moreover, similar to the study of Kallapur et al. (2008), this index is multiplied by (-1) to be used as an index for audit market competition, not concentration. This index is computed as follows:
K: the number of auditors in the related industry
s: total audit fee received by the auditor in the related industry
S: total audit fee received by auditors in related industry
BIG1: audit firm largeness, if the audit firm is Audit Organization or Mofid Rahbar Institution 1, otherwise, 0.
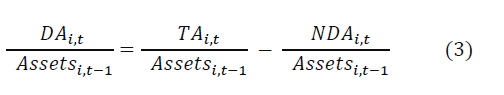
AQ: audit quality equals discretionary accruals for the adjusted Jone's model's calculation. The coefficients are estimated through equation (2):
After estimating the coefficients, non-discretionary accruals will be calculated after coefficient estimation:
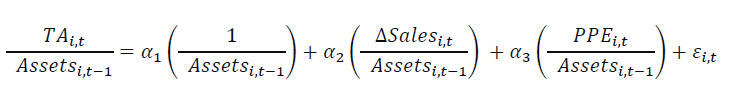
Finally, for the calculation of the discretionary accruals, we have:

Equation A is accruals, assets total assets, sales are income, AR is accounts receivable, PPE is gross properties, machinery, and instrument, and NDA is non-discretionary accruals.
In this paper, the following formula is used for calculating accruals, which is referred to as profit and loss:
Accruals = Operational cash flow – profit before unpredicted items
Most previous studies have used Discretionary Accruals (DA) to measure earnings and audit quality (Shiue, 2012). This paper uses DA as a proxy for audit quality because it presents a degree of negotiations related to audit setting decisions. Abnormal accruals of performance setting estimate the size of DA.
Atenure: auditor tenure, the duration the auditor has been in charge of firm auditing, consistently;
Achange: auditor change, if the auditor has changed in the year under study 1, otherwise, 0;
Newst: dummy variable for setting a standard or new rules. If new rules or standards are set during the year under study 1, otherwise, 0.
Stchange: changing standards and rules. Suppose new rules or standards changed during the year under study 1; otherwise, 0.
Busy: dummy variable for the end of the fiscal year. If the financial yearend is set on March 20, 1, otherwise, 0.
Independent variables
According to Z Altman, the auditor's accuracy is if the firm has been active during the year understudy, but the auditor does not report this. He did not mention the firm's financial distress 1; otherwise, 0.
M_score: by using the Beneish model, fraud in financial statements is as follows:
Fraud in financial statements is the study's independent variable, which the Beneish model measures. Most of the conducted studies on fraud in financial reporting have shown that financial ratios are the most beneficial and simplest tools for predicting fraud (Kaminski, Vetzel, & Goan, 2004; Kanapicken & Grandin, 2015). The coefficients of the model are designed in America's economic setting. Applying the same model in Iran, due to the difference in sample firms' selection criteria and the U.S. regulations, can lead to misleading predictions. Hence, this paper's adjusted Beneish model is used to be proportionate with Iran's setting. Fraudulent financial reporting is measured following the study of Rosalee & Rashed (2014) and according to equation (1). Omar, et al., (2014) used the Beneish model for measuring fraud in financial statements and introduced that as the best criteria.
Equation. (1)
In equation (1), the operational definition of each variable is as follows:
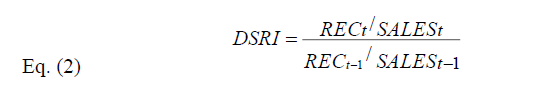
DSRI: an index for sales in accounts receivable and measured by equation (2). In this equation, REC is accounts receivable, and SALES is sales.

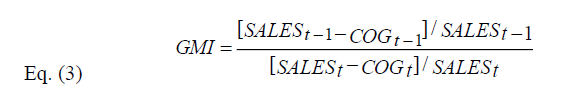
GMI is an index for gross profit margin, measured by equation (3). This equation refers to annual sales, and COG is the final price for goods sold.
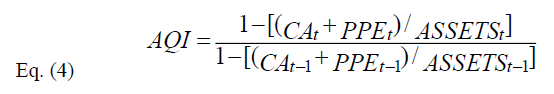
AQI is an index for asset quality, measured by equation (4). In this equation, CA is total current assets, PPE: property, machinery, and instrument, and ASSETS: total assets.
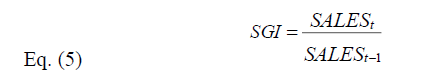
SGI is an index for sales growth, measured via equation (5).
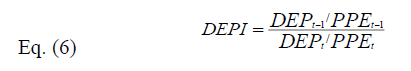
DEPI: an index for depreciation cost, measured by equation (6). DEP is depreciation cost for tangible fixed assets in this equation, and PPE is gross properties, machinery, and instrument.
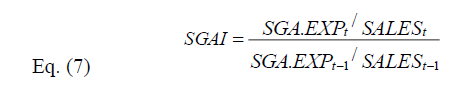
SGAI: an index for genera, office, and sales costs, measured by equation (7). In this equation, SGA and EXP are total, office, and sales costs and SALES is annual sales.
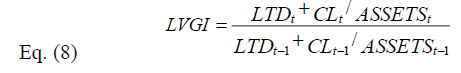
LVGI is an index for financial leverage, measured by equation (8). LTD is total long-term debts, CL total current liabilities, and ASSETS are total assets (Beneish, 1999).
TATA: an index for total accruals to total assets measured by equation (8). In this equation, ACC is accruals (the difference between operational profit and operational cash flow), and ASSETS is total assets.
Control variables:
Mtenure: CEO tenure. The duration of the CEO has been in position consistently until the year under study.
Mchange: CEO change, if the CEO has changed during year 1; otherwise, 0.
Age is equal to the time interval between firm establishment date until the year under study;
Size is the natural logarithm of firm assets;
Loss should the firm be losing in the year under study 1, otherwise, 0;
Lnafee is equal to the natural logarithm of the audit fee.
Modif equals 1 if the auditor's opinion is not adjusted; otherwise, 0.
Bsf should at least one of the board members has a certificate related to one of the majors in finance 1; otherwise, 0.
Bsi should at least one board member has a certificate related to industry 1; otherwise, 0.
Bind is equal to unbounded members to total members of the board.
Data Analysis
This paper uses two models to assess the relationship between auditors' accuracy and fraud in financial statements and the total and the unreasonableness expectation gap. The present study has inserted the panel data method in its database, including 128 Iranian firms from 2013 to 2018. The variables of auditor's accuracy, fraud in financial statements, audit expectation gap, and control variables have been used to estimate the models.
| Table 2 Descriptive Statistics of The Variables |
||||
|---|---|---|---|---|
| Variable | Mean | Std.dev | Min | Max |
| aeg | 19.062 | 22.466 | 00.006 | 1.036 |
| Aeg2 | -01.667 | 3.044 | -35.255 | 14.149 |
| M - score | 18.290 | 38.688 | 0.000 | 1.000 |
| accuracy | 04.360 | 20.436 | 0.000 | 1.000 |
| age | 39.141 | 13.378 | 11.000 | 67.000 |
| loss | 08.139 | 27.364 | 0.000 | 1.000 |
| size | 14.303 | 1.497 | 10.533 | 19.374 |
| busy | 80.378 | 39.742 | 0.000 | 1.000 |
| inafee | 7.376 | 1.599 | 2.302 | 14.390 |
| modif | 47.819 | 49.989 | 0.000 | 1.000 |
| hhi | 23.649 | 22.954 | 0.196 | 1.000 |
| bsf | 93.768 | 24.190 | 0.000 | 1.000 |
| bsi | 89.012 | 31.299 | 0.000 | 1.000 |
| blnd | 70.436 | 17.447 | 1.666 | 1.000 |
| mchang | 28.343 | 45.099 | 0.000 | 1.000 |
| mtenure | 3,683 | 3.167 | 1.000 | 15.000 |
Unit Root
By assessing all variables' unit root, all are at the unit root (stationary) level. The obtained LM statistic for each variable is reported in Table 3.
| Table 3 The Results of The Hadri Test |
|||
|---|---|---|---|
| Variable | Sig. | Variable | Sig. |
| AEG | 0.6503 | AEG2 | 0.1298 |
| M-Score | 0.1308 | Accuracy | 0.5198 |
| Age | 0.4512 | Loss | 1 |
| Size | 0.9874 | Busy | 1 |
| LnAfee | 0.3548 | Modif | 0.2158 |
| HHI | 0.91546 | BSF | 0.2981 |
| BSI | 0.2348 | Blnd | 1 |
| Mchange | 0.862 | Mtenure | 0.7621 |
Collinearity Test
According to Table 4, there is no collinearity among variables by assessing collinearity among variables, and they are independent.
| Table 4 The Results of The Linearity Test |
||
|---|---|---|
| Variable | VIF | 1/VIF |
| Mchang | 1.37 | 0.731 |
| Mtenure | 1.36 | 0.737 |
| Size | 1.14 | 0.879 |
| Busy | 1.11 | 0.898 |
| Age | 1.09 | 0.913 |
| M – score | 1.08 | 0.924 |
| Loss | 1.08 | 0.925 |
| Hhi | 1.08 | 0.926 |
| Blnd | 1.08 | 0.928 |
| Inafee | 1.06 | 0.944 |
| Accuracy | 1.04 | 0.959 |
| Modif | 1.04 | 0.962 |
| Bsf | 1.04 | 0.963 |
| Bsi | 1.04 | 0.965 |
| Mean VIF | 1.11 | |
As presented in Table 4, given the obtained VIF statistic, which is less than 10 for all variables, there is no collinearity among model variables, so there is no collinearity problem in regression.
Sensitivity Analysis Test
| Table 5 The Results of The Sensitivity Analysis |
||||||||||||||||
|---|---|---|---|---|---|---|---|---|---|---|---|---|---|---|---|---|
| aeg | Aeg2 | M - score | accuracy | age | loss | size | busy | inafee | modif | hhi | bsf | bsi | blnd | mchang | mtenure | |
| aeg | 1.000 | |||||||||||||||
| Aeg2 | 0.019 | 1.000 | ||||||||||||||
| M - score | 0.066 | -0.029 | 1.000 | |||||||||||||
| accuracy | -0.034 | 0.024 | 0.032 | 1.000 | ||||||||||||
| age | -0.085 | -0.071 | 0.021 | -0.106 | 1.000 | |||||||||||
| loss | -0.088 | -0.018 | -0.078 | 0.019 | 0.052 | 1.000 | ||||||||||
| size | 0.054 | 0.040 | 0.127 | -0.010 | -0.083 | -0.157 | 1.000 | |||||||||
| busy | 0.059 | 0.045 | -0.044 | 0.100 | -0.013 | 0.014 | 0.192 | 1.000 | ||||||||
| inafee | -0.009 | 0.052 | 0.025 | 0.125 | 0.035 | -0.059 | 0.051 | 0.158 | 1.000 | |||||||
| modif | 0.084 | -0.001 | -0.001 | 0.029 | -0.009 | 0.069 | 0.101 | 0.016 | -0.006 | 1.000 | ||||||
| hhi | -0.012 | 0.045 | -0.026 | -0.004 | 0.193 | 0.013 | 0.020 | -0.070 | 0.084 | 0.107 | 1.000 | |||||
| bsf | -0.031 | -0.038 | -0.040 | -0.031 | 0.107 | -0.017 | -0.063 | -0.120 | 0.006 | 0.039 | -0.027 | 1.000 | ||||
| bsi | -0.017 | -0.058 | 0.066 | 0.001 | -0.005 | 0.001 | 0.021 | -0.034 | -0.043 | -0.003 | -0.066 | -0.007 | 1.000 | |||
| blnd | 0.070 | -0.038 | 0.087 | 0.004 | -0.101 | -0.096 | -0.102 | -0.047 | 0.024 | -0.029 | -0.065 | -0.016 | -0.120 | 1.000 | ||
| mchang | -0.001 | -0.004 | 0.114 | 0.041 | 0.015 | 0.159 | -0.028 | 0.040 | -0.022 | 0.057 | -0.031 | -0.056 | -0.039 | -0.061 | 1.000 | |
| mtenure | -0.039 | -0.003 | 0.061 | -0.012 | -0.074 | -0.121 | 0.070 | -0.061 | 0.015 | -0.069 | -0.010 | 0.052 | 0.072 | 0.084 | -0.480 | 1.000 |
This test, referred to as sensitivity analysis, assesses the relationship between used variables in the model two-by-two, the above matrix's output. The correlation interval is between -1 and +1, where negative figures show inverse correlation, and positive figures indicate a direct correlation.
Research Model Estimation
| Table 6 The Results of The Model (1) |
||||
|---|---|---|---|---|
| Variable (aeg) |
Coefficient | Std/ Error | t-Statistic | Prob/ |
| M - score | 0.029 | 0.008 | 3.42 | 0.001 |
| accuracy | -0.034 | 0.010 | -3.32 | 0.001 |
| age | -0.004 | 0.002 | -2.05 | 0.041 |
| loss | -0.042 | 0.022 | -1.93 | 0.054 |
| size | 0.057 | 0.026 | 2.20 | 0.028 |
| busy | 0.058 | 0.023 | 2.49 | 0.013 |
| lnafee | -0.003 | 0.012 | -1.92 | 0.054 |
| modif | 0.042 | 0.025 | 1.66 | 0.097 |
| hhi | -0.004 | 0.002 | -2.05 | 0.041 |
| bsf | -0.034 | 0.015 | -2.31 | 0.021 |
| bsi | -0.013 | 0.004 | -2.81 | 0.005 |
| blnd | 0.067 | 0.057 | 1.18 | 0.238 |
| mchang | 0.093 | 0.029 | 3.20 | 0.002 |
| mtenure | 0.036 | 0.018 | 1.95 | 0.052 |
| _cons | 0.220 | 0.180 | 1.22 | 0.222 |
| Weighted Statistics | ||||
| R-SQ | 0.0747 | |||
| R-SQ2 | 0.0173 | |||
| P-value model | Wald chi2(14)=19.07 | |||
| Prob>chi2=0.1622 | ||||
| F-Limer | F(123,459)=2.47 | |||
| Prob>F=0000 | ||||
| Hausman | Chi2(14)=17.95 | |||
| Prob>Chi2=0.2091 | ||||
To estimate the model, first, we should determine whether the data are pooled or panel by the F test. This test's null hypothesis is that the data are pooled, and hypothesis 1 claims that data are panel. Regarding the pooled test results reported in Table 6, the null hypothesis concerning the pooled data is not ejected for the first model at 99%. Hence, the model with panel data should be used to estimate the models' coefficients. According to Table 6, the Hausman test statistic, based on estimation for the models, is equal to 17.95, with a probability level of 0.2091, which is larger than the table's value, so the null hypothesis is not rejected. Hence, the model with random effects is more appropriate for model (1). Table 6 shows a negative and significant relationship between the auditor's accuracy and total audit expectation gap and a positive and significant relationship between fraud in financial statements and the total audit expectation gap. The p-values of them are 0.001 0.001, respectively. A lower than 5% significance level with negative coefficients of 0.034 and 0.029 for fraud in financial statements shows that the relationship between auditor's accuracy and total audit expectation gap is negative and a positive relationship between fraud in financial statements and total audit expectation gap. This means that the total audit expectation gap decreases by increasing the auditor's accuracy, and the former increases by increasing fraud in financial statements.
| Table 7 The Results of The Model (2) |
||||
|---|---|---|---|---|
| Variable (aeg2) | Coefficient | Std/ Error | t-Statistic | Prob/ |
| M - score | 0.106 | 0.018 | 5.77 | 0.000 |
| accuracy | -0.226 | 0.088 | -2.56 | 0.012 |
| age | -0.058 | 0.020 | -2.80 | 0.005 |
| loss | -0.124 | 0.029 | -4.26 | 0.000 |
| size | 0.045 | 0.026 | 1.73 | 0.085 |
| busy | 0.293 | 0.046 | 6.31 | 0.000 |
| lnafee | -0.052 | 0.018 | -2.87 | 0.004 |
| modif | 0.001 | 0.000 | 6.00 | 0.000 |
| hhi | 0.587 | 0.512 | 1.15 | 0.252 |
| bsf | -0.137 | 0.063 | -2.17 | 0.031 |
| bsi | -0.143 | 0.078 | -1.83 | 0.068 |
| blnd | 0.342 | 0.051 | 6.59 | 0.000 |
| mchang | 0.128 | 0.052 | 2.45 | 0.015 |
| mtenure | 0.172 | 0.066 | 2.59 | 0.011 |
| - cons | 0.158 | 1.455 | 0.11 | 0.913 |
| Weighted Statistics | ||||
| R-SQ | 0.0343 | |||
| R-SQ2 | 0.0053 | |||
| P-value model | Wald chi2(14)=26.20 | |||
| P-value model F-Limer |
Prob>chi2=0.0160 | |||
| F(123,460)=2.34 | ||||
| F-Limer Hausman |
Prob>F=0000 | |||
| Chi2(12)=13.63 | ||||
| Hausman | Prob>Chi2=0.4775 | |||
Regarding the pooled test results reported in Table 7, the null hypothesis concerning the pooled data is rejected for the second model at 99%. Hence, the model with panel data should be used to estimate the models' coefficients. According to Table 7, the Hausman test statistic, based on estimation for the models, is equal to 13.63, with a probability level of 0.4775, larger than the table's value, so the null hypothesis is not rejected. Hence, the model with random effects is more appropriate for model (2).
Regarding Table 7, there is a negative and significant relationship between auditor's accuracy and the unreasonableness audit expectation gap. And a positive and significant relationship between fraud in financial statements and the unreasonableness audit expectation gap because their p-values are 0.012, 0.000, respectively, which is lower than the 5% significance level with negative coefficients of 0.226 0.106 for fraud in financial statements. It shows that the relationship between auditor's accuracy and the unreasonableness audit expectation gap is negative. And a positive relationship between fraud in financial statements and the unreasonableness audit expectation gap. This means that the unreasonableness audit expectation gap decreases by increasing the auditor's accuracy, and the former increases by increasing fraud in financial statements.
Robustness Testing
In this paper, to yield better results and confirm the results of the study, research hypotheses were examined using the random-effects model and Liner methods, the results of which are as follows:
| Table 8 Robustness Testing Result of The Model (1) |
||||||
|---|---|---|---|---|---|---|
| VARIABLE | FE | OLS | T+1 | |||
| Model (1) | Model (1) | Model (1) | ||||
| AEG | AEG | S.AEG | ||||
| Coef. | p-value | Coef. | p-value | Coef. | p-value | |
| M - score | 0.078 | 0.000 | 0.105 | 0.000 | 0.058 | 0.080 |
| accuracy | -0.016 | 0.000 | -0.086 | 0.049 | -0.041 | 0.001 |
| age | -0.018 | 0.007 | -0.001 | 0.074 | -0.001 | 0.084 |
| loss | -0.046 | 0.024 | -0.067 | 0.061 | 0.042 | 0.064 |
| size | 0.095 | 0.056 | 0.046 | 0.024 | 0.043 | 0.054 |
| busy | 0.038 | 0.036 | 0.043 | 0.108 | -0.032 | 0.111 |
| lnafee | -0.003 | 0.004 | -0.0075 | 0.004 | -0.018 | 0.000 |
| modif | 0.040 | 0.085 | 0.042 | 0.029 | 0.036 | 0.076 |
| hhi | -0.003 | 0.054 | -0.003 | 0.000 | -0.053 | 0.097 |
| bsf | -0.053 | 0.321 | -0.010 | 0.000 | -0.038 | 0.272 |
| bsi | -0.063 | 0.169 | -0.012 | 0.098 | -0.060 | 0.022 |
| blnd | 0.021 | 0.000 | 0.076 | 0.201 | -0.116 | 0.058 |
| mchang | 0.042 | 0.004 | 0.042 | 0.000 | 0.022 | 0.006 |
| mtenure | 0.038 | 0.029 | 0.036 | 0.042 | 0.069 | 0.008 |
| - cons | 1.005 | 0.058 | 0.153 | 0.244 | 0.399 | 0.055 |
| Weighted Statistics | ||||||
| R-SQ | 0.0446 | 0.4955 | 0.1442 | |||
| R-SQ2 | 0.0112 | 0.4156 | 0.0204 | |||
| P-value model | F(14,459)=1.53 | F(14,582)=1.61 | Wald chi2(14)=20.62 | |||
| P-value model | Prob>F=0.0957 | Prob>F=0.0720 | Prob>chi2=0.1118 | |||
To confirm the model's results (1), the relationship between auditor's accuracy and fraud in financial statements and the total audit expectation gap is assessed using three methods of fixed assets, the ordinary least squares (OLS) and T+1. According to the above table results, there is a negative and significant relationship between auditor's accuracy and total audit expectation gap in all three methods. Their p-values in all methods are 0.000, 0.049, and 0.001, less than the 5% significance level with negative coefficients of 0.016, 0.086, and 0.042 indicating a negative relationship between auditors' accuracy and total audit expectation gap. Moreover, there is a positive and significant relationship between fraud in financial statements and the total audit expectation gap in all three methods. The p-values of variables are 0.000, 0.000, and 0.080, less than 5% significance level for fixed effects and ordinary least squares and less than 10% for T+1 with positive coefficients of 0.078, 0.106, and 0.056. It shows that a negative and significant relationship exists between the auditor's accuracy and the total audit expectation gap. Since additional tests are totally in line with the main results, we can confidently express that there is a significant relationship between auditor's accuracy and fraud in financial statements and the total audit expectation gap.
| Table 9 Robustness Testing Result of The Model (2) |
||||||
|---|---|---|---|---|---|---|
| Variable | FE | OLS | t+1 | |||
| Model (1) | Model (1) | Model (1) | ||||
| AEG2 | AEG2 | S.AEG2 | ||||
| Coef. | p-value | Coef. | p-value | Coef. | p-value | |
| M - score | 0.146 | 0.045 | 0.218 | 0.000 | 0.104 | 0.007 |
| accuracy | -0.535 | 0.000 | -0.115 | 0.038 | -0.115 | 0.038 |
| age | -0.033 | 0.002 | -0.018 | 0.062 | -0.096 | 0.000 |
| loss | -0.025 | 0.047 | -0.184 | 0.000 | -0.099 | 0.022 |
| size | 0.281 | 0.000 | 0.069 | 0.008 | 0.001 | 0.025 |
| busy | 0.297 | 0.000 | 0.228 | 0.020 | 0.301 | 0.032 |
| lnafee | -0.000 | 0.044 | -0.096 | 0.000 | 0.085 | 0.342 |
| modif | 0.041 | 0.006 | 0.018 | 0.028 | 0.254 | 0.080 |
| hhi | 0.393 | 0.000 | 0.750 | 0.188 | -0.061 | 0.072 |
| bsf | -0.014 | 0.007 | -0.232 | 0.015 | 0.660 | 0.014 |
| bsi | -0.003 | 0.000 | -0.553 | 0.176 | 0.298 | 0.179 |
| blnd | 0.421 | 0.000 | 0.054 | 0.031 | 0.342 | 0.000 |
| mchang | 0.080 | 0.022 | 0.053 | 0.021 | 0.178 | 0.019 |
| mtenure | 0.024 | 0.045 | 0.172 | 0.011 | 0.097 | 0.046 |
| - cons | -4.111 | 0.555 | 0.608 | 0.724 | -2.174 | 0.165 |
| Weighted Statistics | ||||||
| R-SQ | 0.0227 | 0.3494 | 0.0367 | |||
| R-SQ2 | 0.0161 | 0.33326 | 0.0254 | |||
| P-value model | F(14,460)=4.02 | F(14,583)=0.87 | Wald chi2(14)=20.18 | |||
| Prob>F=0.000 | Prob>F=0.5916 | Prob>chi2=0.1244 | ||||
To confirm the model's results (2), the relationship between auditor's accuracy and fraud in financial statements and the total audit expectation gap is assessed using three methods of fixed assets, ordinary least squares (OLS), and T+1. According to the results of the above table, there is a negative and significant relationship between auditor's accuracy and the unreasonableness audit expectation gap in all three methods because the p-value of them in all methods is 0.000, 0.038, and 0.038, less than 5% significance level with negative coefficients of 0.535, 0.115 and 0.115. That indicates a negative relationship between the auditor's accuracy and the unreasonableness audit expectation gap. Moreover, there is a positive and significant relationship between fraud in financial statements and the unreasonableness audit expectation gap in all three methods because the p-values of variables are 0.045, 0.000, and 0.007, less than 5% significance level for all three methods with positive coefficients of 0.146, 0.218, and 0.104. It shows a negative and significant gap between the auditor's accuracy and the unreasonableness audit expectation gap. Since additional tests are totally in line with the main results, we can confidently express that there is a significant relationship between auditor's accuracy and fraud in financial statements and the unreasonableness audit expectation gap.
Discussion and Conclusion
The hypothesis testing results show a negative and significant relationship between auditor's accuracy and audit expectation gap in total and the unreasonableness modes. This means that by increasing the auditor's accuracy, the audit expectation gap will decrease both in total and the unreasonableness modes. Moreover, the hypothesis testing results show a positive and significant relationship between fraud in financial statements, the audit expectation gap in total, and the unreasonableness modes. The audit expectation gap increases both in total and the unreasonableness expectation gap by increasing financial statement fraud.
These findings confirm previous studies (Obaka 2016; De Muylder, Hardies, & Breesch, 2012; Fulop et al., 2019; Kumari, Ajward, & Dissabandara, 2017; Rehana, 2010; Siddiqui, Nasreen, & Choudhury-Lema, 2009) who declare that fraud detection, auditor's accuracy, and training auditors would decline the audit expectation gap.
Furthermore, the results of the present study are also in line with that of Best, et al., (2011); Lin & Chu (2004); Harold, et al., (2009). They claim that financial statement users consider auditors' main duty to detect fraudulent financial statements and argue that the auditors' failure in this process will increase the unreasonableness expectation gap. According to the hypothesis testing results, the intensity of the relationship between auditor's accuracy and fraud in financial statements and the unreasonableness expectation gap is by far more than the total expectation gap.
Acknowledgement
Corresponding author: Mahdi Salehi, Ferdowsi University of Mashhad, Mashhad, Iran; Email: mehdi.salehi@um.ac.ir
References
Akinbuli, S.F (2010). "The effect of audit expectation gap on the work of auditors, the profession and users of financial information". The Nigerian Accountant, 37-47.
Al-Dhubaibi, A.A.S. (2020). "Auditors’ responsibility for fraud detection: Views of auditors, preparers, and users of financial statements in Saudi Arabia”. Accounting, 6, 279–290.
Almer, E., & Brody, R.G. (2002). “An empirical investigation of context-dependent communications between auditors and bankers”, Managerial Auditing Journal, 17(8), 478-486.
Crossref, Google Scholar, Indexed at
Anderson, J.C., Lowe, J.D., & Reekers, P. (1993). " Evaluation of auditor decisions: Hindsight bias effects and the expectation gap". Journal of Economic Psychology, 14, 711-737.
Crossref, Google Scholar, Indexed at
Azham, Ali, M., Teck Heang, L., Mohamad, R., & Ojo, M. (2008). “Internship and audit expectation gap among undergraduate students in Universiti Utara Malaysia”, Journal of Financial Reporting and Accounting, 6(1), 55-74.
Crossref, Google Scholar , Indexed at
Beattie, V., Brandt, R., & Fearnley, S. (1998), "Auditor independence and the expectations gap: Some evidence of changing user perceptions". Journal of Financial Regulation and Compliance, 6(2), 159-170.
Crossref, Google Scholar, Indexed at
Beck, G.W. (1973). “The role of the auditor in modern society: an empirical appraisal”. Account. Bus. Res, 3(10), 117-122.
Crossref, Google Scholar , Indexed at
Behzadian, F., & Nia, N.I. (2017). "An Investigation of Expectation Gap between Independent Auditors and Users from Auditing Services Related to the Quality of Auditing Services Based on Their Role and Professional Features". Asian Journal of Accounting Research, 2(2), 36-47.
Crossref, Google Scholar , Indexed at
Best, P.J., Buckby, S., & Tan, C. (2001). Evidence of the audit expectation gap in Singapore. Managerial Auditing Journal, 16(3), 134–144.
Crossref, Google Scholar, Indexed at
Bonner, S.E., & Sprinkle, G.B. (2002). "The effect of monetary incentive on effort & task performance: Theories, evidence and framework of research". Accounting, Organizations and Society, 27(4-5), 303–345.
Boone, J.P., Khurana, I.K., & Raman, K. (2012). “Audit market concentration and auditor tolerance for earnings management”, Contemporary Accounting Research, 29(4), 1171– 1203.
Crossref, Google Scholar, Indexed at
Boterenbrood, R. (2017). " The audit expectation gap between companies and their auditors: An exploratory study". Global Business Review, 18(5), 1124-1133.
Crossref, Google Scholar, Indexed at
Boyd, D.T., Boyd, S.C., & Boyd, W.L. (2001). “The Audit Report: A Misunderstanding Gap between Users and Preparers”. National Public Accountant, 45(10), 56-60.
Canadian Institute of Chartered Accountant CICA. (1978), “Report of the special committee to examine the role of the auditors”, Toronto.
Carcello, J.V., Hollingsworth, C.W., Klein, A., & Neal, T.L. (2006). “Audit committee financial expertise, competing corporate governance mechanisms, and earnings management”.
Crossref, Google Scholar, Indexed at
Choi, M.S., & Zéghal, D. (1999). “The effect of accounting firm mergers on international markets for accounting services”. Journal of International Accounting, Auditing and Taxation, 8(1), 1-22.
Crossref, Google Scholar, Indexed at
Chye Koh, H., & Woo, E.S. (1998).“The expectation gap in auditing”, Managerial Auditing Journal, Vol. 13 No. 3, pp. 147-154.
Crossref, Google Scholar, Indexed at
Cohen Commission. (1978). "Report of the Commission on Auditors’ Responsibilities; Conclusions and Recommendations", American Institute of Certified Public Accountants, New York, State of New York .
De Muylder, J., Hardies, K., & Breesch, D. (2012). “The expectations gap: Two remedies investigated”.Available at SSRN 2190404.
Dennis, I. (2010), "What do you expect? A reconfiguration of the audit expectations gap". International Journal of Auditing, 14(2), 130?146.
Crossref, Google Scholar, Indexed at
Dibia, N., (Ndukwe O. Dibia PhD1, FCA1, CFA ACTI1) (2015). "Audit Expectations Gap and Perception of Financial Reporting". International Journal of Managerial Studies and Research, 3(3), 23-31.
Enes, E.F., Almeida, B.J.M.de da Silva, A.M.F.G., Carvalho, F.P., & Simões, J.M.M. (2016). " Education as a contribution to reduce the audit expectation gap: The Portuguese case". Review of Applied Management Studies, 14(1), 10-19.
Crossref, Google Scholar, Indexed at
Eshleman, J.D. and Lawson, B.P. (2016). “Audit market structure and audit pricing”. Accounting Horizons, 31(1), 57-81.
Crossref, Google Scholar, Indexed at
Flint, D. (1998). "Philosophy and Principles of Auditing: An Introduction", London, UK: Macmillan.
Fulop, M.T., Tiron-Tudor, A., & Cordos, G.S. (2019). “Audit education role in decreasing the expectation gap”. Journal of Education for Business, 94(5), 306-313.
Crossref, Google Scholar , Indexed at
Gbadago, F.Y. (2015), " Audit expectation gap and MBA accounting students’ knowledge on auditor(s)’ responsibilities: Evidence from a public university in Kumasi Ashanti Region of Ghana". Journal of Accounting and Taxation, 7(4), 53-61.
Crossref, Google Scholar , Indexed at
Guy, D.M., & Sullivan, J.D. (1988), "The expectation gap auditing standards". Journal of Accountancy, 165(4), 36-46.
Habib, A., & Bhuiyan, M.B. (2011). “Audit Firm Industry Specialization and The Audit Report Lag”, Journal of International Accounting, Auditing and Taxation, 20(1), 32–44.
Crossref, Google Scholar, Indexed at
Hassink, H.F.D., Bollen, L.H., Meuwissen, R.H.G., de Vries, M.J., (2009). “Corporate fraud and the audit expectations gap: A study among business managers”. J. Int. Account. Aud. Tax, 18, 85-100.
Hassink, Harold F.D., Bollen, Laury H., Meuwissen, Roger H.G., & de Vries, Meinderd J., (2009). "Corporate fraud and the audit expectations gap: A study among business managers." Journal of International Accounting, Auditing and Taxation, 18(2), 85-100.
Crossref, Google Scholar, Indexed at
Huang, T.C. Chang, H. and Chiou, J.R. (2015), “Audit market concentration, audit fees, and audit quality: Evidence from China”. Auditing: A Journal of Practice & Theory, 35(2), 121-145.
Crossref, Google Scholar, Indexed at
Humphrey, C., Moizer, P., & Turley, S. (1993). “The audit expectations gap in Britain: An empirical investigation”, Accounting and Business Research, 23(1), 395-411.
Crossref, Google Scholar, Indexed at
Humphrey, C.G. Turley, W.S. and Moizer, P. (1993). “The audit expectations gap in Britain: An empirical investigation”. Accounting and Business Research, 23, 395–411.
Crossref, Google Scholar , Indexed at
Iskandar, T., Zuraidah, M.S., Ria Nelly, S., & Rita, A. (2012). "Enhancing auditors' performance: The importance of motivational factors and the mediation effect of effort". Managerial Auditing Journal, 27(5), 462–476.
Kallapur, S., Sankaraguruswamy, S., & Zang, Y. (2010). “Audit market competition and audit quality”. Indian School of Business.
Kamil, O., & , Musa, O. (2014). “The Role of Auditing in the Management of Corporate Fraud”. Governance and Corporate Crime: Challenges and Consequences, 6, 129–151.
Crossref, Google Scholar, Indexed at.
Kaminsky, K.A., Wetzel, T.S., & Guan, L. (2004). “Can Financial Ratios Detect Fraudulent Financial Reporting?”. Managerial Auditing Journal, 19(1), 15-28.
Crossref, Google Scholar, Indexed at
Kanapickiene, R., & Grundiene, Z. (2015).“The Model of Fraud Detection in Financial Statements by Means of Financial Ratios”, International Scientific Conference Economics and Management.
Crossref, Google Scholar, Indexed at
Klaus, R., & Martin S. (2014). “Misstatements in Financial Statements: The Relationship between Inherent and Control Risk Factors and Audit Adjustments”. Auditing: A Journal of Practice & Theory, 33(4), 247-269.
Kumari, J.S., Ajward, A.R., & Dissabandara, D.B. (2017). " The Audit Expectations Gap and the Role of Audit Education: Evidence from Sri Lanka". 3(1), 01-26.
Crossref, Google Scholar, Indexed at
Lazarus Elad, F. (2017). " The Impact of Audit Education on the Audit Expectation Gap: Evidence from Civilekonom Students in Sweden", Master’s Thesis, Karlstad University, Faculty of Arts and Social Sciences, Gothenburg, Sweden. Karlstad Business School. (Accounting and Control).
Lee, T.A. (1970). “The nature of auditing and its objectives”, account. 292-296.
Lee, T.H., & Ali, A.M. (2008). “The Knowledge Gap and Deficient Performance Gap between Auditors and Corporate Managers an Empirical Study in Malaysia.” Gadjah Mada International Journal of Business,. 10(1), 113-133.
Crossref, Google Scholar, Indexed at
Liggio, C.D. (1974). “The expectation gap: The accountant’s Waterloo”. Journal of Contemporary Business, 3(3), 27–44.
Lin, A., & Chen, F. (2004). “An Empirical Study of Audit Expectation Gap in the People’s Republic of China”. International Journal of Auditing, 8, 93–115.
Crossref, Google Scholar, Indexed at
Mansur, H., & Tangl, A. (2018), “How to Bridge the Audit Expectation Gap?”. Journal of Social Sciences (COES&RJ-JSS), 7(2), 61-73.
Crossref, Google Scholar, Indexed at
Markus, S., & Steven, M. (1997). “The structure of the Belgian audit market: The effects of clients' concentration and capital market activity”. International Journal of Auditing, 1(2), 151-162.
Crossref, Google Scholar, Indexed at
Masoud, N. (2017). "Audit expectation gap among undergraduate accounting students at Jordanian Universities". Journal of Private Equity, 20(2), 73-89.
Crossref, Google Scholar, Indexed at
McEnroe, J.E., & Martens, S.C. (2001). “Auditors’ and Investors’ Perceptions of the “Expectation Gap”. Accounting Horizons, 15, 345–58.
Crossref, Google Scholar, Indexed at
Mock, T.J., Bédard, J., Coram, P.J., Davis, S., Espahbodi, R., & Warne, R.C. (2012). “The Audit Reporting Model: Current Research Synthesis and Implications”. AUDITING: A Journal of Practice & Theory, 32, 323–51.
Crossref, Google Scholar, Indexed at
Mostafayi, S. (2012). "Auditing the Human Resource Training and Development in Iranian GAZ Cooperation with ISO 10015 Standards". M.S. thesis, Shaheed Beheshti University, Tehran, Iran.
Newton, N., Persellin, J.S., Wang, D., & Wilkins, M.S. (2016).“Internal control opinion shopping and audit market competition”, The Accounting Review, 91(2), 603-623.
Crossref, Google Scholar , Indexed at
Newton, N.J., Wang, D., & Wilkins, M.S. (2013). “Does a lack of choice lead to lower quality? Evidence from auditor competition and client restatements”. Auditing: A Journal of Practice & Theory, 32(3), 31– 67.
Crossref, Google Scholar, Indexed at
Ojo, M., Lee, T.H., Ali, A., Mohamad, R., & Mohamad Yusof, N.Z. (2016). The Audit Expectations Gap: Mitigating Information Asymmetries and Corporate Social Responsibility as a Signaling Device.
Crossref, Google Scholar, Indexed at
Olagunju, A., & Leyira, M.C. (2012). " Audit Expectation Gap: Perspectives of Auditors and Audited Account Users". International Journal of Development and Management Review, 7(1).
Omar, N., Kunji K.R., Mohd S.Z., & Shafie, N.A. (2014).“Financial Statement Fraud: A Case Examination Using Beneish Model and Ratio Analysis”. International Journal of Trade, Economics and Finance, 5(2), 184-186.
Crossref, Google Scholar, Indexed at
Operu, W.Z. (2016). "Investor perception of audit expectation gap a study of the Nairobi securities exchange", School of Business, University of Nairobi, Nairobi, Republic of Kenya, College of Humanities and Social Sciences.
Pierce, B., & Kilcommins, M. (1996). “The Audit Expectation Gap: The Role of Auditing Education”. Working Paper (No. 13), School Research Papers Series, Dublin City University Business, 1-33.
Porter, B. (1991). “Narrowing the Audit Expectation-Performance Gap: A Contemporary Approach”. Pacific Accounting Review, 3, 1–36.
Porter, B. (1993). “An empirical study of the audit expectation-performance gap”. Account. Bus. Res, 24(93), 49-68.
Crossref, Google Scholar , Indexed at
Porter, B., & Gowthorpe, C. (2004). “Audit expectations gap in the UK in 1999 and comparison with the gap in New Zealand in 1989 and 1999”. Institute of Chartered Accountants of Scotland, Edinburgh.
Crossref, Google Scholar , Indexed at
Porter, B., Ógartaigh, O., Hogartaigh, C., & Baskerville, R. (2012). “Audit Expectation-Performance Gap Revisited: Evidence from New Zealand and the United Kingdom. Part 1: The Gap in New Zealand and the United Kingdom in 2008”, International Journal of Auditing, 16, 101–29.
Crossref,Google Scholar, Indexed at
Porter, B., Simon, J., & Hatherly, D. (2005). "Principles of External Auditing", John Wiley and Sons, New York.
Pourheydari, O., & Abousaiedi, M. (2011). “An empirical investigation of the audit expectations gap in Iran”. Journal of Islamic Accounting and Business Research, 2(1), 63-76.
Crossref, Google Scholar, Indexed at
Rahimian, N. (2005)." Judgment and decision making in auditing". Journal of Official Auditor, Special edition, Tehran, 11(2), 65–84.
Rauthmann, J. F. (2012).“The Dark Triad and interpersonal perception: Similarities and differences in the social consequences of narcissism, Machiavellianism, and psychopathy”. Social Psychological and Personality Science, 3(4), 487–496.
Crossref, Google Scholar, Indexed at
Rehana, F. (2010). “An Empirical Study on Audit Expectation Gap: Role of Auditing Education in Bangladesh”,
Salehi, M. (2011). “Audit expectation gap: Concept, nature and trace”, African Journal of Business Management, 5 (21), 8376-8392.
Crossref, Google Scholar , Indexed at
Salehi, M. (2016). “Quantifying Audit Expectation Gap: A New approach to Measuring Expectation Gap”. Zagreb International Review of Economics & Business, 19(1), 25-44.
Crossref, Google Scholar , Indexed at
Salehi, M., & Dastanpoor, Z. (2018). "The effects of psychological factors on the performance of independent auditors in Iran", Current psychology (New Brunswick, N.J.).
Crossref, Google Scholar, Indexed at
Salehi, M., Jahanbin, F., & Adibian, M.S. (2019). "The relationship between audit components and audit expectation gap in listed companies on the Tehran stock exchange". Journal of Financial Reporting and Accounting, 18(1), 199-222.
Crossref, Google Scholar, Indexed at
Sidani, Y. M. (2007). “The audit expectation gap: Evidence from Lebanon”. Managerial Auditing Journal, 22(3), 288–302.
Crossref, Google Scholar, Indexed at
Siddiqui, J., Nasreen, T., & Choudhury-Lema, A. (2009). “The audit expectations gap and the role of audit education: the case of an emerging economy”. Managerial Auditing Journal, 24(6), 564-583.
Crossref, Google Scholar, Indexed at
Steen, M. (1990). “Audits and auditors-what the public thinks”, London: KPMG peat Marwick McLintock.
Taebi Noghondari, A., & Foong, S. (2013). "Antecedents and consequences of audit expectation gap: Evidence from the banking sector in Malaysia". Managerial Auditing Journal, 28(5), 384-406.
Crossref, Google Scholar, Indexed at
Vanstraelen, A., Schelleman, C., Meuwissen, R., & Hofmann, I. (2012). “The Audit Reporting Debate: Seemingly Intractable Problems and Feasible Solutions”. European Accounting Review, 21(2), 193-215.
Crossref, Google Scholar, Indexed at
Wallace, W.A. (1987). "International accounting and likely approaches to future inquiry: An overview of research". Management International Review, 27(2), 4-25.
Received: 04-Apr-2022, Manuscript No. aafsj-22-11170; Editor assigned: 06- Apr -2022, PreQC No. aafsj-22-11170 (PQ); Reviewed: 20-Apr-2022, QC No. aafsj-22-11170; Revised: 26-Apr-2022, Manuscript No. aafsj-22-11170 (R); Published: 03-May-2022.