Research Article: 2018 Vol: 22 Issue: 4
A Partial Least Square Modeling Involving Interest Rates and Other Macroeconomic Variables in India
Subrata Kumar Mitra, Indian Institute of Management Raipur
Abstract
Analysis of interest rate determinants involving Taylor rule framework in India suggests that monetary policy appeared more reactive to the inflation gap than to the output gap. Some studies that analyzed interest rate movements in India also advocated the inclusion of other macroeconomic variables in modeling interest rate. In this study, the relationship of interest rate with other macroeconomic latent variables/constructs were examined using partial least squares, where Inflation, Interest rate, Output gap, Foreign trade and Exchange rate were assumed to be independent variables. The use of the partial least square model enabled the inclusion of several indicators to capture latent variable measures and to analyze the influence of these variables on the interest rate.
Keywords
Taylor Rule, Interest Rate Targeting, Inflation, Partial Least Square.
Introduction
The monetary and credit policy in India is a multi-directed; it attempts to provide adequate liquidity for meeting reasonable credit requirements and support investment demand in the economy while keeping the price level within limits. Thus, the emphasis of state interventions keeps on changing depending on immediate economic concerns.
One of the benefits of the Indian political system is that the high level of inflation is not politically acceptable, and the government is forced to take several populist measures to keep the inflation rate down. Further, the relationship between inflation and GDP growth in India are not established, and political leaders are right in demanding low inflation and high GDP growth. Generally, inflation rates in India fluctuate around the 5% level and rarely allowed to touch double-digit. Whenever inflation increases, the single emphasis of the government turns into taming inflation. Many policy analysts have criticized RBI’s monetary policy in recent times and found it to be inconsistent. The RBI often remains very elusive as to what they are trying to target and how the target is being achieved. Instead, the RBI often resorts to rather an ad hoc combination of foreign exchange intervention, interest rate changes, and a nonmarket mechanism like hikes in the Cash Reserve Ratio (CRR), among others.
Singh (2010) examined the monitory policy of India and found that the variations in the short-term interest rates are primarily influenced by the inflation gap than the output gap. They used a historical sample covering 1950-51 to 2008-09 and noticed an obvious bias in the conduct of monetary policy regarding stronger reaction to the output gap than to deviations in inflation. However, the results from 1988 onwards suggest that the monetary policy reacts relatively strongly to inflation deviations than in the output gap. The estimated coefficients of inflation gap in the Taylor rule equation are relatively large as compared to the coefficients of the output gap, suggesting more than the proportional reaction of monetary policy to inflation deviations. They also noted that the current exchange rate fluctuations also influence monetary policy decisions about the interest rate. In the study, we tried to examine the relationship between various measures of Interest rate, Output gap, foreign trade, and exchange rate using partial least squares.
Taylor rule and Modifications
rt=2%+0.5(yt–yt* )+0.5(pt–2%)
Where, rt is the targeted federal funds rate, (yt–yt*) is a measure of the output gap, and pt is the current rate of inflation. The response coefficients were fixed in the generic Taylor rule formulation as the target interest rate was kept at 2%. However, the original rule can be adapted to suit the requirements of other places. For example, the numerical constants of the equation can be replaced by parameter estimates using regression analysis.
Taylor remarked in his paper that even though his rule was targeted for the US, it is possible to extend the same to other developed economies. Several studies involving other developing nations observed that policymakers often try to achieve some explicitly or implicitly inflation target by adjusting interest rates.
Taylor remarked in his paper that even though his rule was targeted for the US, it is possible to extend the same to other developed economies. Several studies involving other developing nations observed that policymakers often try to achieve some explicitly or implicitly inflation target by adjusting interest rates.
Prior to the reform process initiated in the early 1990’s, the Indian economy was practically a closed one, and prices of a large number of commodities were administered. The prices were attempted to be stabilized by granting generous subsidies, resulting in a chronic budget deficit. After the introduction of various economic reforms, the current monetary policy framework of India became similar to the frameworks of the US and other developed economies. Though the emphasis on price stability and growth kept varying to tackle prevailing economic conditions, the issue of price stability started gaining higher importance.
Literature on Taylor Rule Applicability in India
Although the applicability of Taylor rule was successfully tested in U.S. and many other countries, current study in Indian context and mound many deviances. Rather et al. (2014) showed that regarding overall inflation volatility, the exchange rate rule had a comparative advantage over the Taylor rule when export-price shocks were the major sources of real volatility. Bhandari & Frankel (2014) found that under certain conditions, nominal GDP targeting is indeed better placed than Inflation targeting when they face supply shocks. Gupta Sengupta (2016) analyzed whether the current macroeconomic environment in India is fit for inflation targeting and indicated that historically the Reserve Bank of India had given more importance to inflation compared to output growth and exchange rate. Sawhney et al. (2017). Observed that the Taylor rule is not only out of fashion but also has become irrelevant. They found that the Taylor rule does not help in explaining contemporary monetary policy behavior in both India and the U.S. Caporale et al. (2018) examined the Taylor rule in five emerging economies and suggested that the reaction of monetary authorities to deviations from target differs regarding the size and significance of the coefficients of inflation. They suggested an augmented nonlinear Taylor rule to capture the behavior of monetary authorities. But no study was found that used Partial least Square modeling approaches.
Empirical Analysis
This study tried to examine the relationship of interest rate with other macroeconomic latent variables/constructs using Partial Least Squares (PLS), where Inflation, Interest rate, Output gap, Foreign trade and Exchange rate were assumed to be independent variables that determine interest rates. Any changes of the value of these latent variables are likely to be reflected by various outcomes (indicators). For example, when the underlying interest rate changes, the rate of all interest-bearing instruments also changes.
Unlike the standard multiple regression model, the PLS modeling allows using a large number of indicators (manifest variables) to measure latent variables/constructs. In the study, each latent variable was measured using some measurable indicators. A short description of latent variables and their indicators are given below:
A single indicator of inflation may not be appropriate for a diverse country like India and both Consumer Price Index (CPI), and Wholesale Price Index (WPI) was used to measure inflation for various purposes. In the early 1990s, central banks of many other nations used the WPI as a measure of inflation, but in recent years, some of them have given up using the WPI, as it is not deemed an accurate measure of general inflation levels.
In India, due to few operational difficulties to measure CPI quickly, WPI changes are used to report an official measure of inflation. The time lags in obtaining CPI estimates are about two months, and the figure is made available on a monthly basis. In the case of WPI, the values are made available on a weekly basis with roughly two weeks’ time lag. In the study, the yearto- year rise of both CPI and WPI were used as indicators of inflation latent variable.
The Index of Industrial Production (IIP) is a measure that indicates the status of production in the industrial segment, and it gives a single representative figure to determine the level of industrial activity in the country. This measure is useful for various policy planning drives and is also used in academic research. The IIP estimates are also taken as a substitution for the overall output of the economy, as IIP is measured on a monthly basis whereas GDP estimates in India are measured quarterly. Even though the industrial production contributes a small part of GDP, Industrial production shows high influence on interest rates and consumer demand and the figures are closely monitored by the central banks. The IIP is often used to forecast future economic growth. Another issue of using IIP is that the index exhibits too much seasonal fluctuation. To alleviate the problems of seasonal fluctuations, the change of IIP on year to year basis was used to keep similarity with the measures of inflation. The use of year-to-year change would also alleviate the problem associated with monthly seasonality. Instead of relying on the single composite IIP measure, it was also decided to use some sectorial IIP estimates.
Though the RBI moderates only short-term interest rates, the change in short-term rate act as a signaling device for long-term interest rates. It is furthermore observed that long-term interest rates tend to follow the direction of short-term rates with some time lag. As different instruments yield varying interest rate, the following measures were shortlisted to measure the underlying interest rate: a) Call money rate, b) The yield on 91days Treasury bill and c) The yield on 1 yr government security
In India, a significant part of foreign exchange transactions is carried out using US dollar as a trading currency. However, to enhance the scope of measurement, the following foreign exchange rates were included as reflective indicators of exchange rate variables: a) U.S. dollar, b) Euro and c) Yen. Domestic production is affected by the volume of external trade, and therefore both exports and import trade values, in and out of the country were used as reflective indicators of international trade.
Methodology
The value of the indicators used in the study was mainly drawn from Handbook of Statistics on Indian Economy published by the Reserve Bank of India (www.rbi.org.in/) and from the website of Ministry of Statistics and Program Implementation (http://mospi.nic.in/iip). The monthly data from January 2000 to March 2018 was used for the study. The relationship amongst variables was established using a Partial Least Square (PLS) model. Use of the PLS method has been increasing in recent years because of its ability to model latent constructs that are uncontaminated by measurement error under conditions of non-normality and with small to medium sample sizes. The PLS is useful for testing complex models with multiple variables and is particularly beneficial when the relationship among the variables cannot be captured using a single regression equation.
In the model, reflective indicators measure the same underlying phenomenon (Chin, 1998) and to confirm that indicators share more variance with the component score than with error variance, the loadings of the indicators are expected to be more than 0.70. However, Loadings of lesser values can be accepted when additional comparable indicators are used in the block. According to the accepted guidelines, the value of Cronbach alpha in basic research should exceed 0.70. The composite reliability value should be higher than 0.70. Convergent validity is established when the AVE value exceeds 0.50. In the proposed model, all the latent variables have exhibited relatively high scores on the parameters compared to the acceptable benchmarks.
To measure discriminant validity, these two conditions are tested. The AVEs of the latent variables should be higher than the construct’s highest squared correlations among the latent variables. Correlations between constructs exceeding the square roots of their AVE indicate that they may not be sufficiently discriminable. In the PLS method, the structural model and the relevant hypothesis can be tested by computing path coefficients and its statistical significance. The structural models that exhibit the connection between latent variables were given in Figure 1. The strength of the relationship between connected latent variables was measured, and their weights were determined using SmartPLS software.
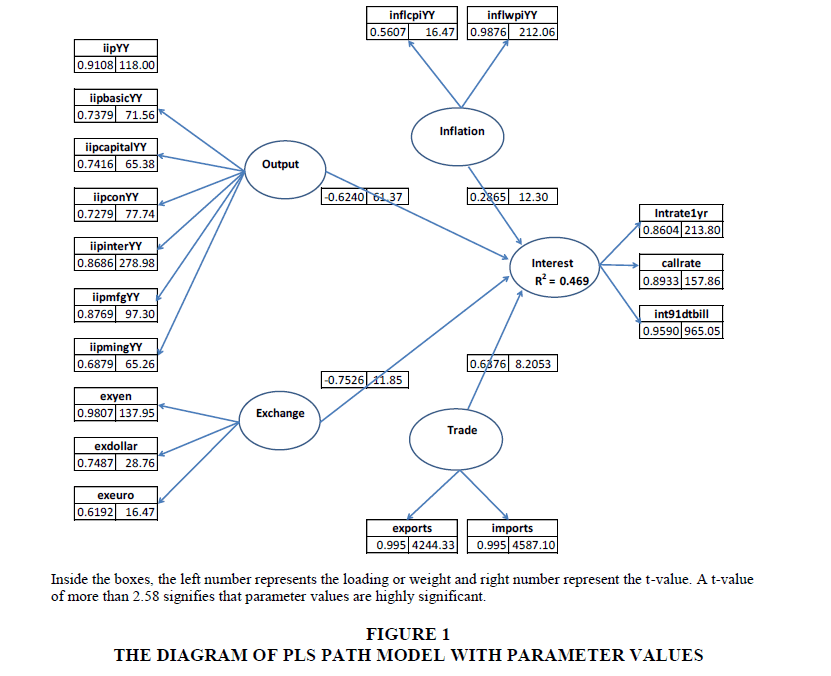
Figure 1:The Diagram of PLS Path Model with Parameter Values
The normal distribution of data is not an assumption in the PLS model, and hence the significance of the weights cannot be established using parametric significance tests. SmartPLS software uses a non-parametric bootstrap procedure under which a large number bootstrap sample is drawn from the original sample with replacements.
Further, the quality of the path model can be ascertained by the Q2 statistic. The Q2 statistic can be used for a block-wise evaluation of the predictive relevance of the model by reproducing the observed values of the model itself. A Q2 statistic is less than zero means that the model lacks predictive relevance whereas the Q2 values 0.02, 0.15 and 0.35 indicates that the latent variable has a small, medium or large predictive relevance. The SmartPLS software estimated two kinds of Q2 statistics by using a Blindfolding procedure: cross-validated communality and cross-validated redundancy. The cross-validated communality assesses the ability of the model to predict the indicators directly from their latent Variables in the measurement model. The cross-validated redundancy assesses the capacity of the structural model to predict the dependent manifest variables using the related structural relation (Tenenhaus et al., 2005).
Theory and Model
We tried to investigate the Taylor rule relationship using partial least square modeling approach in the previous section. Unlike the standard multiple regression model, the PLS modeling allows using a large number of indicators (manifest variables) to measure latent variables/constructs. In the study, each latent variable was measured using some measurable indicators. A short description of the variables used in the study is given in Table 1. We used Interest rate as a target variable, and Target variable) and created a model using PLS framework depicted in Figure 1.
| Table 1 VARIABLES USED IN THE STUDY |
|||
| SL | Variables | Measurable Indicators | Source |
| 1 | Interest rate (Target variable) | 91 days T-bill rates (int91dtbill), one-yr T-bill rates (intrate1yr) and Call money rates (callrate) | Database of Indian Economy: https://dbie.rbi.org.in |
| 2 | Inflation rate (Latent variable) | Yr to yr changes of: a) Consumer Price Index (inflcpiYY) and b) Wholesale price index (inflwpiYY) | https://dbie.rbi.org.in |
| 3 | Exchange rates (Latent variable) | Exchange rates of Indian Rupee with: a) US$ (dollar), b) Japanese Yen (exyen), and c) Euro (exeuro) | https://dbie.rbi.org.in |
| 4 | Trade (Latent variable) | Total Imports (imports) and Total Exports (exports) | https://dbie.rbi.org.in |
| 5 | Production (Latent variable) | Year to year changes of overall Index of Industrial Production (iipYY) and its main subsectors: a) Basic (iipbasicYY), b) Capital (iipcapitalYY), c) Consumer goods (iipconYY), d) Intermediate goods (iipinterYY), e) Manufactured goods (iipmfgYY), and f) Mining (iipmingYY) | Ministry of Statistics and Program Implementation http://mospi.nic.in/iip |
Analysis
To examine the PLS model and measurement scales, the following measures were used:
1. Loading of indicators.
2. Cronbach's alpha.
3. Composite reliability.
4. Average variance extracted (AVE).
Loading of each indicator is displayed in Figure 1 and values of Cronbach's alpha, Composite Reliability and AVE are given in Table 2. In the model, the inflation was captured using two reflective measures, CPI-based inflation, and WPI based inflation. The loading of CPIbased measure on the inflation variable was only 0.561 whereas the loading of WPI based inflation measure was 0.988. Though the CPI-based measure gave less loading, the measure was considered important on the theoretical importance.
| Table 2 TEST PARAMETERS OF THE MEASUREMENT MODEL |
|||
| Cronbach's Alpha | Composite Reliability | AVE | |
| Exchange | 0.72 | 0.83 | 0.64 |
| Inflation | 0.60 | 0.77 | 0.64 |
| Interest | 0.89 | 0.93 | 0.82 |
| Output | 0.92 | 0.92 | 0.64 |
| Trade | 0.99 | 1.00 | 0.99 |
In another measure, the cross-loadings are examined (Table 3), where loading of an indicator should not be higher with other latent variables than the one it is intended to measure. Except for CPI-based inflation indicator, this condition was generally met, and accordingly, the discriminant validity of the latent variables was confirmed. The number of bootstrap samples in the test was set to 5000 numbers. The t-value of loadings/weights obtained using the bootstrap resampling technique are included in the PLS path diagram presented in Figure 1. The critical values of two-tailed tests are 1.65 (significant level: p-value=1%), 1.95 (p=5%) and 2.58 (p=1%). Another evaluation criterion of the structural model is the R2 value, which reveals similar meaning to that of traditional regression. The R2 of the latent interest rate dependent variable was 0.469, and it reveals that the modeled variables explain 46.9% of the variance.
| Table 3 CROSS LOADING OF INDICATORS |
|||||
| Exchange | Inflation | Interest | Output | Trade | |
| exyen | 0.9807 | 0.4796 | 0.2057 | -0.4842 | 0.8385 |
| exdollar | 0.7487 | -0.0397 | 0.0749 | -0.608 | 0.2126 |
| exeuro | 0.6192 | 0.4723 | 0.0196 | -0.0475 | 0.8102 |
| inflcpiYY | 0.5677 | 0.5607 | 0.0781 | -0.0213 | 0.717 |
| inflwpiYY | 0.3177 | 0.9876 | 0.4127 | 0.0267 | 0.5674 |
| intrate1yr | 0.2344 | 0.3001 | 0.8604 | -0.4 | 0.4435 |
| callrate | 0.1176 | 0.3336 | 0.8933 | -0.2908 | 0.2574 |
| int91dtbill | 0.1271 | 0.4211 | 0.959 | -0.3086 | 0.3862 |
| iipYY | -0.5857 | 0.102 | -0.1696 | 0.9108 | -0.1714 |
| iipbasicYY | -0.3048 | 0.0482 | -0.0984 | 0.7379 | 0.0369 |
| iipcapitalYY | -0.6142 | 0.0739 | -0.1469 | 0.7416 | -0.1689 |
| iipconYY | -0.4879 | 0.0384 | -0.0882 | 0.7279 | -0.1752 |
| iipinterYY | -0.4354 | 0.0375 | -0.4119 | 0.8686 | -0.2578 |
| iipmfgYY | -0.6024 | 0.0959 | -0.1386 | 0.8769 | -0.1735 |
| iipmingYY | -0.2545 | -0.0972 | -0.4199 | 0.6879 | -0.231 |
| exports | 0.7509 | 0.6324 | 0.4029 | -0.2459 | 0.9949 |
| imports | 0.755 | 0.6467 | 0.4103 | -0.253 | 0.9951 |
The blindfolding procedure was carried out by using SmartPLS keeping omission distance value equal to 8. The results are shown in Table 4. It can be observed that for this model all the blocks had high positive values cross-validated communality and cross-validated redundancy. As these values were positive (above the threshold level), it can be assumed that the model had acceptable predictive relevance.
| Table 4 RESULTS OF BLINDFOLDING TEST |
|
| Q2 value | |
| Construct Cross-validated Redundancy | |
| interest | 0.1274 |
| Construct Cross-validated Communality | |
| exchange | 0.2035 |
| inflation | 0.1556 |
| interest | 0.4329 |
| output | 0.3518 |
| trade | 0.7613 |
Note: A Q2 statistic is less than zero means that the model lacks predictive relevance whereas the Q2 values 0.02, 0.15 and 0.35 indicate that the variable has a small, medium or large predictive relevance.
Discussion
Analysis of interest rate determinants involving Taylor rule framework in India suggests that monetary policy appeared more reactive to the inflation gap than to the output gap. Some studies that analysed interest rate movements in India also advocated the inclusion of other macroeconomic variables in modeling interest rate.
In the study, we tried to examine the relationship of interest rate with other macroeconomic latent variables/constructs using Partial Least Squares (PLS), where Inflation, Interest rate, Output gap, foreign trade and Exchange rate were assumed to be independent variables that determine interest rates. Any changes of the value of these latent variables are likely to be reflected by various outcomes (indicators).
Use of the PLS method has been increasing in recent years because of its ability to model latent constructs that are uncontaminated by measurement error under conditions of nonnormality and with small to medium sample sizes. The PLS is useful for testing complex models with multiple variables and is particularly beneficial when the relationship among the variables cannot be captured using a single regression equation. The path diagram of the PLS model is given in Figure 1.
The analysis of the path model shows that both the measurement model and structural model fulfilled an acceptable model fit criterion as measured by various tests. The t-value of the path coefficients validated the significance of the structural model. Significance levels of all indicator loadings and path coefficients were less than 0.01 and accordingly the strength of the relationship between interest rate and other variables were tested and found to be highly significant. It was found that all indicators used to explain the interest rate changes were useful as evident from their statistical measures. Another interesting observation was that the WPI based inflation measure had a much higher impact compared to the CPI measured inflation measure as WPI is the most widely used inflation indicator in India.
References
- Bhandari, P., & Frankel, J. (2014). The best of rules and discretion: A case for nominal GDP targeting in India. CID WP, 284.
- Caporale, G.M., Helmi, M.H., Çat?k, A.N., Ali, F.M., & Akdeniz, C. (2018). Monetary policy rules in emerging countries: Is there an augmented nonlinear taylor rule? Economic Modelling, 72, 306-319.
- Gupta, A.S., & Sengupta, R. (2016). Is India ready for inflation targeting? Global Economy Journal, 16(3), 479-509.
- Chin, W.W. (1998). The partial least squares approach to structural equation modelling. In Marcoulides, G.A. (Ed.) Modern Methods for Business Research, (pp. 295-336). Lawrence Erlbaum Associates, Mahwah, NJ: London .
- Hair, J. F., Ringle, C.M., & Sarstedt, M. (2011). PLS-SEM: Indeed a silver bullet. The Journal of Marketing Theory and Practice, 19(2), 139-151.
- Ringle, C.M., Wende, S., & Will, A. (2005). SmartPLS. Retrieved from http://www.smartpls.de
- Sawhney, B., Kulkarni, K.G., & Cachanosky, N. (2017). Monetary policy in India and the US: Is the taylor rule irrelevant? International Review of Business and Economics, 1(1), 75-107.
- Singh, B. (2010). Monetary policy behaviour in India: Evidence from taylor-type policy frameworks. Retrieved from http://www.rbi.org.in/scripts/PublicationReportDetails.aspx?UrlPage=&ID=590
- Taylor, J.B. (1993). Discretion versus policy rules in practice. Carnegie-Rochester Conference Series on Public Policy, 39, 195-214.
- Tenenhaus, M., Vinzi, E., Chatelin, Y., & Lauro, C. (2005). PLS path modeling. Computational Statistics and Data Analysis, 48(1), 159-205.