Research Article: 2018 Vol: 22 Issue: 1
A Study on Impact of Banknifty Derivatives Trading on Spot Market Volatility in India
Manasa N, Ramaiah University of Applied Sciences
Suresh Narayanarao, Ramaiah University of Applied Sciences
Keywords
Derivatives, BANKNIFTY, Volatility, GARCH Model.
JEL Code
G13, G23, H54
Introduction
Volatility is an integral part of stock market, where stock market index is considered as the pillar of a country’s economic growth. The stock market indicates bullish and bearish phases where in the bullish market, attracts huge investments from domestic and foreign investors which leads to increase of stock values. In case of bearish-market stock value falls down and these variations in stock values determine the return on the stock market volatility. Volatility indicates variations in the values of instruments which could result in either gain or loss. Volatility is an obstruction for economic progress due to less investment in stock market. Assessing the value of securities relies on volatility from claiming each security. Volatility can be considered as Historical Volatility based on the past price movements of the security and Implied Volatility market and measured based on the result of information about the security.
The stock market volatility may be influenced by factors viz., inflation rate and interest rate, money related leverage, business earnings, profits plans, securities prices and socio-economic, political and macroeconomic variables like, international developments, economic progression, budget, general business environments, credit policies, etc. Trading volume monitored by arrival of new information regarding the securities or any kind of evidence that incorporate into value of the securities drives the volatility of the stock market.
Derivatives are innovative financial instruments, which facilitates the investors to invest in stock market instruments, which have high return potential and at the same time hedge against the volatility in the prices of such instruments. However, the primary objective of Derivative products is to manage/control/reduce volatility in the stock market and thereby improves the activity in the stock market transactions. In fact, ‘Derivatives’ are considered as the most important pillar for the economic growth, the other three pillars being stock market, banking and insurance sectors (Moses, 2013).
Literature Review
The study conducted on Impact for subordinate items exchanging with respect to spot market volatility, discloses that derivatives transaction in the securities market has mostly reduced the asymmetric response of volatility of spot market. Furthermore, TARCH model might have been discovered suitableness among the GARCH models (Nair, 2011). Also study discloses that, volatility of spot market had diminished after the introduction of index futures and options. Furthermore the currency futures had a disrupting impact on volatility of stock market depicted by GARCH model (Nandy, 2014). Other study (Sinha, 2015) utilizing GARCH model, demonstrates that volatility about spot market augmented after the introduction of derivatives. Another study compared the volatility during pre and post period of introducing derivatives using GARCH family and concluded TARCH model is better fit and found the presence of leverage effect and positive impact of volatility on returns for pre-derivative, post-derivative and the whole period (Singh, 2016). The other study was indicated that by the GARCH model test, it was observed that the volatility of spot market has decreased after the commencement of future contracts on the index (Singh and Tripathi, 2016). By keeping in mind of all the literature review, the current study is carried out to determine the effect of BANKNIFTY stocks derivative transaction on spot market volatility in India using GARCH model.
Database and Methodology
The objective of the investigation is to know the effect of individual bank stock futures on volatility of spot market about BANKNIFTY stocks.
Database
The period of study is from 1 April 2010 to 31 March 2017, which is chosen to observe the influence of trading of equity derivatives on spot market volatility after global financial crisis. The range of the present study is confined to futures market of BANKNIFTY. The sample size of the study involves 8 stocks: viz., Axis Bank Ltd, HDFC Bank Ltd, State Bank of India Group (SBI), Canara Bank, Bank of Baroda, Federal Bank Ltd., Kotak Mahindra Bank Ltd. and Yes Bank Ltd. The data for stocks contains daily closing values of spot market and near month contract of stock futures. BANKNIFTY index is taken as the control variable and data comprise of the daily closing value. The resource used to gather the data is from NSE website @ http://www.nseindia.com. The analysis were done using E-views 9 Student version. The different methods used for study are descriptive statistics, unit root test, heteroskedasticity test, GARCH model, AIC values, SIC values, Serial correlation test, histogram normality test and ARCH-LM test.
Methodology
Initially methodology starts with the initial analysis of the return series with the help of basic statistical tool called “Descriptive Statistics” before proceeding with econometric modelling. An initial assessment of mean and standard deviation of the series is done to comment on the volatility of prices of stocks under study. Skewness and kurtosis measure will help us understand the asymmetry from the normal distribution in a set of statistical data. To check the whether series is stationary or not for the existence of unit root, ADF test is applied. Stock market data displays volatility clustering, where time series shows period of high volatility and low volatility. GARCH/ARCH time series models generally utilised in econometrics and finance because of random volatility. Before applying the GARCH model for return series, heteroskedasticity test is applied and residuals of all the stocks are plotted to check whether the volatility exists or not. If these things exist for residuals plot, this gives justification to run the GARCH model.
The GARCH (a, b) model (Bollerslev, 1986) recommends that conditional variance of returns is a linear function with lagged conditional variance and furthermore past squared error terms.
The GARCH (a, b) model where a is the order of ARCH term and b is the order of GARCH term can be expressed as follows:

Where: Rt is daily return of dependent variable,
 is daily return of independent variable,
 is constant,
  is the coefficient of
 and
and is the residuals.

Where: is the variance of the residual/error term resultant from the mean-equation (1) and also known as volatility of dependent variable.
is the constant, is the coefficient of
 is the ARCH term or past squared residuals derived from mean equation or news about previous volatility,
 is the GARCH term or past residual variance and
 is the coefficient of .
To analyse how the derivative instruments viz., index futures and stock futures does have an impact on the spot market volatility, exogenous dummy variable  is made known into the variance equation. If the factor of the exogenous dummy variable found satisfactory at 0.05 level of significance, derivatives instruments has an effect on the volatility of spot market. Furthermore, if this coefficient is found statistically significant, it implies that the equity derivative transactions lead to change in in the spot market volatility. Then variance equation is represented as follows:

Where: is the dummy variable or derivative market index and stocks,
 is the coefficient of
To check the superiority of the model, Akaike Criterion value (AIC) and Schwartz values (SC) are analysed. Further, study is continued with diagnostic checking of the model with Stock Market return as dependent variable and return on derivatives as exogenous variable along with dummy variable. The model will be good when residuals satisfy for no serial correlation while testing for serial correlation, no ARCH effect with ARCH Test and are normally distributed. (Peterson, 2014).
Results and Discussion
In this section, results of the study are discussed where first summary of descriptive statistics for BANKNIFTY stocks are estimated of both futures return and cash return are shown in Table 1. Further, ADF test results are shown in Table 2, followed by GARCH model results are discussed shown in Table 3. To determine the quality of the model, AIC and SC values are analysed for all the stocks as shown in Table 4 and also diagnostic checking is done for the GARCH model shown in Table 5.
Descriptive Statistics of Bank stocks
The Table 1 recapitulates the descriptive statistics of BANKNIFTY stocks returns. The factor of skewness for all the return series are dissimilar from zero which shows that return distribution is asymmetric and the coefficient of kurtosis shows that the return series are not symmetric in all the stocks. Further from Jarque-Bera test, displays that in all the stocks, series are not normally distributed as probability value are equal to zero.
| Table 1: Descriptive Statistics Of Bank Stocks | |||||||||
| Symbol | Variable | Mean | Max | Min | Std. Dev | Skewness | Kurtosis | Jarquebera | P |
|---|---|---|---|---|---|---|---|---|---|
| AXIS | Futures Return | -0.0005 | 0.1297 | -1.6149 | 0.0442 | -27.9452 | 1019.8 | 74929 | 0 |
| Cash Return | -0.0005 | 0.1460 | -1.6139 | 0.0443 | -27.7381 | 1010.2 | 73519 | 0 | |
| BANKBARODA | Futures Return | -0.0008 | 0.2093 | -1.6195 | 0.04552 | -25.7845 | 920.9522 | 61283 | 0 |
| Cash Return | -0.0008 | 0.2034 | -1.6171 | 0.04543 | -25.8219 | 922.7417 | 61522 | 0 | |
| CANBK | Futures Return | -0.0002 | 0.1215 | -0.1454 | 0.02589 | 0.075008 | 4.80304 | 237.1 | 0 |
| Cash Return | -0.0002 | 0.1260 | -0.1434 | 0.02545 | 0.106533 | 5.030067 | 301.9 | 0 | |
| FEDRALBAK | Futures Return | -0.0006 | 0.1190 | -1.5841 | 0.04699 | -23.9702 | 772.0699 | 43048 | 0 |
| Cash Return | -0.0006 | 0.1173 | -1.5827 | 0.04686 | -24.1369 | 778.6607 | 43788 | 0 | |
| HDFCBANK | Futures Return | -0.0002 | 0.0768 | -1.6072 | 0.041 | -34.5735 | 1355.4 | 1.3300 | 0 |
| Cash Return | -0.0002 | 0.0775 | -1.6054 | 0.0409 | -34.6031 | 1356.9 | 1.3300 | 0 | |
| KOTAKBANK | Futures Return | 0.0009 | 0.0859 | -0.6935 | 0.02871 | -14.7222 | 347.7 | 86746 | 0 |
| Cash Return | 0.0009 | 0.0842 | -0.7011 | 0.0288 | -14.6113 | 344.6 | 85219 | 0 | |
| SBIN | Futures Return | -0.0011 | 0.1059 | -2.2859 | 0.0586 | -34.194 | 1332.2 | 1.2700 | 0 |
| Cash Return | -0.0011 | 0.1114 | -2.2820 | 0.0586 | -34.1462 | 1329.9 | 1.2700 | 0 | |
| YESBANK | Futures Return | 0.0010 | 0.2 | -0.1318 | 0.0244 | 0.3003 | 9.609 | 3192.9 | 0 |
| Cash Return | 0.0010 | 0.2023 | -0.1347 | 0.0248 | 0.3354 | 9.3128 | 2921.8 | 0 | |
The test critical values -3.43392,-2.863013, -2.567607 are statistical significant at 1%, 5% and 10% level and *denotes statistical significant at 1% level.
ADF Test
The Table 2 describes the results of ADF test for BANKNIFTY stocks. Generally to check the stationary of the return series, unit root test is followed by employing ADF test. In all the stocks of BANKNIFTY returns, the t-statistic value of ADF test statistics is less than the expected critical values, hence, the return series are stationary at level with intercept in all the stocks of BANKNIFTY.
| Table 2: Adf Test | |||
| Symbol | t-Statistic Futures Return | t-Statistic Cash Return | Probability* |
|---|---|---|---|
| AXIS | -40.88645 | -40.83462 | 0 |
| BANKBARODA | -42.39085 | -42.29624 | 0 |
| CANBK | -40.39227 | -39.49335 | 0 |
| FEDRALBNK | -31.82826 | -31.71682 | 0 |
| HDFCBANK | -42.11621 | -42.0653 | 0 |
| KOTAKBANK | -43.06441 | -43.07084 | 0 |
| SBIN | -41.46426 | -41.28508 | 0 |
| YESBANK | -38.70207 | -38.75875 | 0 |
GARCH model
The Figure 1, indicates pattern of volatility clustering of daily return series of BANKNIFTY stocks the residuals of BANKNIFTY stocks which indicates that there are long periods with low fluctuations and also long periods with high fluctuations tends that variation in respective periods followed by respective high/low volatility . When we find the residuals in this pattern, this is the justification to run ARCH family models. Further ARCH-LM test statistic is applied for residuals which indicate the presence of ARCH effect. The best tool to measure the volatility is GARCH model, where in this study used to find the effect of stock futures on volatility of spot market.

Figure 1:Pattern Of Volatility Clustering Of Daily Return Series Of Banknifty Stocks.
The results of GARCH model of BANKNIFTY stocks is presented in the Table 3, ARCH term, is GARCH term and is dummy variable which is stock futures return. ARCH term is significant for all the stocks except KOTAKBANK. GARCH term is significant as value is less than 1% for HDFCBANK, SBIN, AXIS, YESBANK, CANBK, FEDRALBANK and BANKBARODA. To estimate the effect of derivative transaction on volatility of spot market, introduced a dummy variable in the conditional variance equation (2) of the GARCH model. Stock futures return is significant in case of HDFCBANK, SBIN, AXIS, YESBANK, FEDRALBNK and BANKBARODA and even the coefficient are negative hence, the volatility of stocks spot market is declined.
| Table 3: Results Of Estimated Garch Model | ||||||
| GARCH (1,1) Model: Mean Equation: ?? 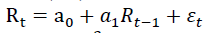 ?? (1) ?? (1) Variance Equation: ?  ???(3) ???(3) |
||||||
| Symbol | Mean Equation | Variance Equation | ||||
|---|---|---|---|---|---|---|
| a0 | α1 | α0 | α1 | β1 | γ1 | |
| AXIS | 0.0033* (0.0007) |
0.2487* (0.0351) |
0.0001* (0.0006) |
-0.0019* (0.008) |
0.766* (0.008) |
-0.0038* (0.0002) |
| BANKBARODA | -0.00007 (0.0021) |
0.1341 (0.1138) |
0.0009 (0.0009) |
-0.0009* (0.0001) |
0.5525 (0.4626) |
-0.0005* (0.00005) |
| CANBK | -0.0003 (0.0005) |
0.2945* (0.0354) |
0.00002* (0.000005) |
0.0969* (0.0121) |
0.8716* (0.0161) |
-0.00006 (0.0001) |
| FEDRALBANK | 0.0037* (0.0006) |
0.1689* (0.0347) |
0.0005* (0.00001) |
0.2141* (0.0195) |
0.0079 (0.0197) |
-0.005* (0.00003) |
| HDFCBANK | 0.0029* (0.0005) |
0.2287* (0.0261) |
0.0001* (0.0006) |
-0.001* (0.0004) |
0.5147* (0.022) |
-0.003* (0.00001) |
| KOTAKBANK | 0.00002 (0.0028) |
0.1299 (0.1) |
0.0008* (0.0002) |
0.15 (0.1147) |
0.6000* (0.1419) |
0.0000 (0.0001) |
| SBIN | 0.0035* (0.0008) |
0.3293* (0.0397) |
0.0011* (0.00002) |
0.0018* (0.00004) |
-0.686* (0.0185) |
-0.0053* (0.00002) |
| YESBANK | 0.0018* (0.0005) |
0.3069* (0.0308) |
0.00001* (0.0003) |
0.0715* (0.0102) |
0.8963* (0.0140) |
-0.0008* (0.0002) |
*indicates statistical significance at 1% level.
The Figure 2, shows AIC and SC values of all the stocks. These values are used to check the quality of the model. In this chart, BANKBARODA stock is having lower values in both AIC and SC, hence it can be said that this stock is better compared to other stocks.

Figure 2:Banknifty Stocks Aic And Sc Values.
In the next step, diagnostic check is carried out which consists of serial correlation, ARCH effect and normal distribution is shown in Table 4.
| Table 4: ?Serial Correlation Squared Residuals | |||||
| Symbols | Prob | ||||
|---|---|---|---|---|---|
| Lag Interval 1 | Lag Interval 2 | Lag Interval 3 | Lag Interval 4 | Lag Interval 5 | |
| AXIS | 0.695 | 0.199 | 0.325 | 0.48 | 0.606 |
| BANKBARODA | 0.651 | 0.578 | 0.778 | 0.851 | 0.908 |
| CANBNK | 0.878 | 0.863 | 0.899 | 0.945 | 0.973 |
| FEDRALBANK | 0.637 | 0.894 | 0.675 | 0.741 | 0.845 |
| HDFCBANK | 0.203 | 0.444 | 0.537 | 0.397 | 0.463 |
| KOTAKBANK | 0.88 | 0.85 | 0.912 | 0.97 | 0.98 |
| SBIN | 0.809 | 0.181 | 0.323 | 0.48 | 0.455 |
| YESBANK | 0.8 | 0.922 | 0.983 | 0.936 | 0.963 |
From the Table 5, it is found that for all the stocks of BANKNIFTY, there is no serial correlation, no ARCH effects and the residuals are not normally distributed.
The model will be good when there is no serial correlation, no ARCH effect and residuals are normally distributed. But here residuals are not normally distributed, which is not desirable.
.
| Table 5: Arch-Lm Test | ||||
| Symbol | F-statistic | Obs*R-squared | Prob. F (1, 1729) | Prob. Chi-square (1) |
|---|---|---|---|---|
| AXIS | 0.1535 | 0.1537 | 0.6952 | 0.695 |
| BANKBARODA | 0.2043 | 0.2045 | 0.6513 | 0.6511 |
| CANBNK | 0.0234 | 0.0234 | 0.8783 | 0.8782 |
| FEDRALBANK | 0.2222 | 0.2222 | 0.6374 | 0.6371 |
| HDFCBANK | 0.1688 | 0.1692 | 0.7034 | 0.7035 |
| KOTAKBANK | 0.0227 | 0.0228 | 0.8801 | 0.88 |
| SBIN | 0.0582 | 0.0583 | 0.8093 | 0.8092 |
| YESBANK | 0.0642 | 0.064 | 0.7999 | 0.7998 |
Conclusion
The Indian security market had seen major functional and operational changes as an outcome of continuing financial sector improvements introduced by the GOI (Government of India). India is one of the existing evolving markets in the region of southern Asia region which has introduced derivative instruments in 2000 for providing tools for risk management to stakeholders which enabled well organised price discovery process with informational efficiency into the market. Derivatives market has a strong impact on GDP growth in India is empirically proved in the research work done to analyse an affirmative relationship between the accumulative volume of the derivatives market and real per capita GDP in six major world economies (Ali, Francisco & Gilberto, 2016). In this paper, examined the impact of stock futures on spot market volatility and from descriptive statistics, found that data returns of all the stocks are not normally distributed. From ADF test, all the stock returns are stationary at intercept level only. Next, ARCH effect is found in all the stocks and volatility is declined for HDFC BANK, SBIN, AXIS, YESBANK, BANKBARODA, CANARABANK and FEDRAL BANK in GARCH model. As stock futures contract provide a mechanism to hedge, speculate and arbitrage, so this reduces the volatility in spot market by risk transference. Hence, it can be concluded that derivatives market effecting spot market in reducing volatility and this can help investors to trade in spot market and making it more liquid. Further work can be done to analyse the effect of derivatives transaction on volatility of spot market using other derivative instruments viz., index and stock options.
References
- Aho, K., Derryberry, D. & Peterson, T. (2014). Model selection for ecologists: The world views of AIC and BIC. Ecology, 95(3), 631-636.
- Aali-Bujari, A., Venegas-Martínez, F. & Pérez-Lechuga, G. (2016). Impact of derivatives markets on economic growth in some of the major world economies: A difference-GMM panel data estimation. Aestimation, (12), 110.
- Bollerslev, T. (1986). Generalized autoregressive conditional heteroskedasticity. Journal of Econometrics, 31(3), 307-327.
- Moses. (2013). Impact of financial derivatives on stock market volatility in India: A study of futures and options in NSE, PhD Thesis, Sri Krishnadevaraya University.
- Nair, A.S. (2011). Existence and extent of impact of individual stock derivatives on spot market volatility in India. Applied Financial Economics, 21(8), 563-600.
- Nair, A.S. (2011). Existence and extent of impact of individual stock derivatives on spot market volatility in India. Applied Financial Economics, 21(8), 563-600.
- Nandy, S. & Chattopadhyay, A.K. (2014). Impact of introducing different financial derivative instruments in India on its stock market volatility. Paradigm, 18(2), 135-153.
- Nseindia.com. (2017). NSE - National Stock Exchange of India Ltd. [online] Available at: http://www.nseindia.com [Accessed 23 May 2017].
- Singh, G. (2016). Volatility Study of NSE NIFTY during its pre and post derivative period.
- Singh, S. & Tripathi, L.K. (2016). The impact of derivatives on stock market volatility: A study of the Sensex index. Journal of Poverty, Investment and Development, 25, 37-44.
- Sinha, R. (2015). The impact of derivatives on spot market volatility: A study on S&P CNX Nifty, India. International Journal of Management and Social Sciences Research, 4(6), 31.