Research Article: 2020 Vol: 23 Issue: 5
Adoption Decision And Welfare Impact Of Eco-friendly Agricultural Practices: Evidence From Smallholder Farmers In South-West Nigeria
Seyi Olalekan Olawuyi, University of Fort Hare
Citation Information: Olawuyi, Seyi O. (2020). Adoption decision and welfare impact of eco-friendly agricultural practices: evidence from smallholder farmers in South-West Nigeria. Journal of Management Information and Decision Sciences, 23(5), 590-611.
Abstract
The inevitable desire for productive and remunerative agriculture with zero negative impact both on the environment and the natural resource base (natural systems) in the quest to mitigate the impact of climate extremes on the agri-food ecosystem, farming households’ welfare, and food security status in Nigeria, necessitates farmers’ adoption of eco-friendly agricultural practices (conservation agricultural practices) which are adjudged to be climate-smart. These practices are confluence in nature, interrelated and mutually enabling, with specific trade-offs. Households’ survey data from the randomly selected 350 smallholder farmers were analyzed with heterogeneous treatment effect econometrics model to investigate farmers’ adoption status of eco-friendly agricultural practices, and to find out if farmers’ adoption decision have impact on their welfare gains. Bearing in mind that, many of the previous related studies on adoption of improved agricultural practices in South-west Nigeria seemed not to have accounted for the possible selection and hidden bias usually associated with non-experimental research of this nature. The findings indicated that adoption is still largely partial. Similarly, the results revealed that adoption had a welfare-increasing impact for every change in the rank of the propensity score. However, years of formal education, trust index of social capital, active involvement in collective action, and frequent extension delivery system were found to significantly predict adoption of these practices. These important dynamics also differentiated the adopters and non-adopters of these practices by welfare-gains. Importantly, rosenbaum sensitivity test used for robustness checks revealed that the negative effect of adoption on farmers’ welfare-gains was insensitive to selection bias. Hence, the ATT estimate from HTE model was a pure impact effect of the adoption. The study concluded that a large proportion of the farmers with a high propensity to adopt these practices were perhaps the ones with high comparative advantage as regards access to productive resources, which included: farmland holdings, labour, capital, social networks, and institutional supports. This also permits to infer that there is a possibility for the farmers to perform better to experience positive effects, if efficient enough to stay within the production possibility frontier.
Keywords
Agricultural Practices; Eco-friendly; HTE Model; Nigeria; Welfare.
Introduction
The global experiences with agriculture have shown that the spread and transformation of agricultural production system to environmental-friendly agricultural practices (otherwise known as conservation agriculture (CA), from the usual traditional tillage based practices is now gaining momentum, and becoming a global phenomenon (Kassam et al., 2015; Ayenew et al., 2020). This is because CA is currently promoted as a new paradigm for “sustainable production intensification”, and a good instance of “climate smart agriculture” as pointed out by FAO (2011). The principle of ‘sustainable production intensification’ and ‘climate smart agriculture’ uphold the inevitable desire for a productive and remunerative agriculture with zero negative impact both on the environment and the natural resource base (Kassam et al., 2015). The beautiful aspect of sustainable crop production intensification principle is that, in addition to its capacity to minimize climate change impact, it also mitigates against climate change induced factors thereby creating enabling environment for crops to thrive well in the soil. If CA is not embraced by the farmers, the prevailing extreme events and land degradation impact will be too much for the global smallholder farmers to contain, especially those in the tropics and sub-tropics because of their limited adaptation potentials compared to their counterparts in the temperate region (Harvey et al., 2018).
The promotion, practice and spread of CA have been in existence for about 5 decades. However, the rate at which CA is adopted has been very slow in some countries which predominantly house smallholder farmers. For instance, report (Kassam et al., 2015) has it that, about 157 M ha of the world’s total arable land was cultivated using CA systems. This report further revealed that 42.3% of this area is associated with South America continent while about 34.4% is associated with North America. Meanwhile, 11.4% was reported for Australia and New Zealand while Asia and Europe have 6.6% and 1.3% respectively. Equally, both Russia and Ukraine account for about 3.3% of the world’s farmland under CA cultivation. In Africa, an astonishing 0.8% was recorded. Given these problems and numerous soil degrading challenges, there is need for remedies in order to improve crop production output, as well as increased income earning of the farming households. One of the highlighted strategies for combating such problems as contained in Nigeria’s (NEEDS, 2007), and recently, the Sustainable Development Goals (SDGs) 2, 12, 13 and 15 of the United Nations (UN, 2015), is to promote the adoption of environmental-friendly and sustainable farming practices towards “achieving zero hunger, responsible consumption and production, climate-smart action and life on land” respectively.
One of the promising agricultural interventions for smallholder farmers is CA (FAO, 2013; IPCC, 2014) because it has the potentials to deliver on all pillars of climate-smart agriculture (Thierfelder et al., 2017). In sum, CA has potential for three basic climate-smart principles namely: adaptation, mitigation and productivity increase which place smallholder farmers in developing countries as good candidates for CA, towards the fight against zero hunger and promotion of sound natural system (von-Loeper et al., 2016), as well as general African agricultural growth and development (Kamara, 2019).
In fact, farmers’ behavioral intention and apathy to embrace transition from traditional methods of farming to more sustainable agricultural practices such as CA has been a major concern and topical discourse among the development experts (D’Souza & Mishra, 2018). According to Akyüz and Theuvsen (2020), behavioral intention is conceptualized as to what extent does individual has self-consciously planned an activity to realize or avoid a specific behavior. In the real sense, behavioral intention, as an indicator of an individuals’ effort in pursuing a behavior, is a strong predictor of actual behavior (Akyüz & Theuvsen, 2020).
In a similar manner, sound policy support and proper information sharing from various African government has been lagging despite the world over acknowledgement of CA importance (Mujeyi et al., 2019). More so, many of the farmers who even tried to adopt these practices are not strictly following the embedded principles as stipulated in FAO (2018), owing to many factors ranging from technical and/or resource constraints, to cultural bias and institutional challenges (Mulimbi et al., 2019), which are responsible for the categorization of the farmers into full adopters, partial adopters and non-adopter farmers. This suggests that full adopters are farmers who adopted all the three basic CA principles, while partial adopters are those who adopted only one/two of the three basic CA principles, while non-adopters are those who did not adopt any of the three CA principles (Ngwira et al., 2014). Importantly, the partial adoption status was captured in line with FAO’s recommendations, and as defined in Ngwira et al. (2014).
The capability of improved environmental-friendly agricultural practices such as CA, in slowing down the negative externalities presented by extreme climate events, improve degraded lands, enhance welfare indicators and outcomes such as increased productivity, food and nutrition security, poverty reduction, and ultimately improved farmers’ welfare gains cannot be overlooked (Jaleta et al., 2018). Therefore, policy actions to promote internalization and adoption of CA among farmers in Nigeria require urgent attention.
Conjectural Gaps
Studies focusing on adoption of improved agricultural practices abound in Nigeria. Although, with the exception of very few, reported instances found in literatures (for example, Ademola & Olujide, 2014; Akinbode & Bamire, 2015) revealed exploratory presentation of soil and ground water conservation efforts used by the farmers, without econometrics presentation of the influencing dynamics governing the choice of these practices. Similarly, the few studies that applied econometrics approach did not consider the driving impact of social capital indicators such as peer group networks and participation in collective action. Instead, emphasis was only placed on membership of farmers’ groups. The conceptualization of social networks goes beyond farmers’ groups membership; this is well explained in many extant studies (see, Hunecke et al. 2017; Husen et al. 2017; World Social Capital Monitor, 2017). In fact, most of the past similar studies in the study area did not capture the partial adoption phase in line with FAO’s recommendations, and as defined in Ngwira et al. (2014). Equally, good numbers of previous related works seemed not to have accounted for possible selection and overt bias usually associated with non-randomized experimental research of this nature. There are two important issues that must be addressed to avoid flawed estimation and misleading inferences, as well as distortion of facts in any survey which involves a counterfactual scenario. These issues are self-selection bias and possible endogeneity challenges (Issahaku & Abdulai, 2019); addressing these potential issues requires an appropriate estimation technique conditioned on the plausibility of the assumption made about the sources of biases (Siziba et al., 2019). In a like manner, other factors such as farmers’ innate managerial abilities and skills, as well as the societal status (social capital) may not be observed, but all these and other unobservables can alter farmers’ adoption decision and the outcome variable (welfare), which can lead to estimation flaws. To the best of my knowledge, all these were not considered in previous related studies in the study area.
Material and Methods
The Study Area
South-West Nigeria was used for this research. This region of Nigeria has 6 states, from which Oyo, Osun and Ondo States were purposively selected for this research. This is because adoption of improved agricultural practices had been reported by previous similar studies in this region (for instance, Adebayo & Olagunju 2015). Importantly, most of the inhabitants predominantly engage in farming and farm-allied livelihood activities, which are mostly undertaken by the rural populace (Olorunfemi et al., 2020). Also, the zone has a high concentration of extension delivery personnel in the Nigeria (Olorunfemi et al., 2020). The selected states used for the study are depicted in Figure 1 (Cooperative Information Network (COPINE), 2018).

Figure 1 MAP of the Selected States in South-West Nigeria (Source: Copine, 2018)
Research Strategy, Design and Methods
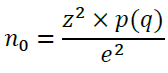
Cross-sectional research design was used for this study. More so, the research representative sample was chosen using Cochran’s (1963) formular, which is expressed as:
 = Sample size estimated
Z2 = Selected critical value of desired level of confidence or risk
 = Estimated proportion of an attribute that is present in the population or maximum variability of the population
For instance, at 95% confidence interval, the sample size was calculated
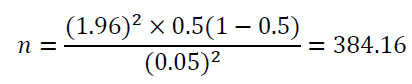
However, responses from 350 farmers were found useful, and used for the final analysis; the rest were discarded, due to significant incomplete responses.
The research subjects were drawn from the study area through multistage sampling technique. The stratification of the study area into Agricultural Development Programme (ADP) zones was helpful in the first stage of sampling process across the three states of the study area. Specifically, Oyo State has four ADP zones, Osun and Ondo States have three and two ADP zones respectively. Sampling procedure in the second and third stages was carried out through simple random sampling technique to select one-third of the local government areas in these states, and communities across these local government areas, while the last stage used proportionality factor sampling approach to select the representative sample used for this study. The reason for this step is due to variation in the spread of people across the local governments and communities in each of the states considered.
The proportionate to size factor used is expressed as:
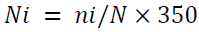
“Ni is the number of respondents selected in each of the ith state (i = 1, 2 and 3); ni represents the population of all registered farmers in ith states selected; N stands for the total population of all registered farmers in all the three states selected; and, 350 represents the total sample size selected”.
Similarly, using a carefully designed data collection instrument which is an extract of the “Qualitative expert Assessment Tools for assessing the adoption of CA in Africa (QAToCA)” as described in Corbeels et al. (2010) was used to elicit responses from the respondents based on the focus of this study. Meanwhile, ethical guidelines as required by the 1964 Declaration of Helsinki and its later amendments were observed in the study area; these are: anonymity, informed consent, privacy, confidentiality, as well as professionalism.
Data Analytical Techniques
The study used descriptive statistics to profile the smallholder farmers into full adopters, partial adopters and non-adopters categories of conservation agricultural principles. Meanwhile, the partial adoption status was captured in line with FAO’s recommendations, and as defined in Ngwira et al. (2014). The full adopters are farmers who adopted all the three principles of CA, while partial adopters are those who adopted only two of the CA principles; on the other hand, the non-adopter farmers did not adopt any of the three CA principles.
Similarly, using Welch’s formula, two-sample t-test was carried out to test the observed features disparity between the full adopter farmers and others (partial adopters and non-adopters). However, borrowing from Grootaert et al. (2002) and Yusuf (2008), absolute welfare measure was also applied to operationalize the welfare outcome based on farming households’ consumption expenditure per capita. In addition, heterogeneous treatment effects (HTEs) model was used to investigate the impact of CA adoption on farmers’ welfare gains. To consistently gauge the likely impact of unobserved heterogeneity on the welfare outcome, the estimation of HTE relied on “stratification-multilevel (SM), matching-smoothing (MS), as well as smoothing-differencing (SD)” estimators, as clearly indicated in the estimation guidelines of Xie et al. (2012) and Manda et al. (2017). Likewise, rosenbaum sensitivity test was carried out to test for conditional independence of the model, following the estimation procedure of DiPrete and Gangl (2004) as well as Nikoloski and Ajwad (2013). In using HTE model, this diagnostics check becomes necessary to gauge the presence of hidden bias that could potentially cause change in the causal inference from the estimated model, and consequently result to misleading conclusion.
Operationalization of Households’ Welfare
The household economic behaviour under constrained utility maximization was applied to model the level of households’ expenditure based on money-metric indicator of welfare. Households’ consumption expenditure is assumed to describe the social and economic environments in which production decisions are made. The use preference for consumption expenditure approach over the income-based household’s welfare measure as noted by Baiyegunhi and Fraser (2011) citing Atkinson (1989) is driven by the fact that, welfare opportunity is a function of income, or suffice it to say that income is assumed to measure potential welfare. On the other hand, consumption-expenditure suggests a “realized welfare or a measure of welfare achievement” (Atkinson, 1989) as cited in Baiyegunhi and Fraser (2011). However, this study is interested in farmers’ present achieved welfare (realized welfare) as against future expected welfare-gains (potential welfare); apparently, consumption-expenditure welfare expression concept is an appropriate indicator. Baiyegunhi and Fraser (2011) further buttressed that, poor individuals are assumed to have a relatively constant expenditure pattern on some basic bundles of goods, all things being equal, compared to income-stream which in most cases is assumed to be erratic and unpredictable.
HTE Model Specification
HTE model estimation by default involves propensity score matching to evaluate the ATT through predefined estimator method(s) as earlier mentioned. According to Rosenbaum and Rubin (1983), propensity score is conceived as “the conditional probability of receiving a treatment given pre-treatment observational characteristics”.
According to Paudel and de-Araujo (2017), the estimation is expressed as:
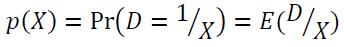
Where,
D = 0,1 implies exposure to CA (adoption decision, which is the treatment), and X indicates vector of pre-treatment characteristics which are multidimensional. These include: farmers and plot/farm level characteristics, crop yield, farmer’s revenue and expenditure streams, as well as social network characteristics. According to Rosenbaum and Rubin (1983), “if the exposure to treatment is random within cells as defined by X, it is also random within cells defined by the values of the one-dimensional variable ”. Paudel and de-Araujo (2017) also noted that, “given a population of units denoted by i, if the propensity score
  is known, then, the following expression presents the estimation of ATT”:
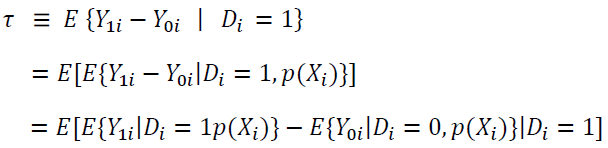
Where:
“The outer expectation is over the distribution of  are the potential outcomes in the two counterfactual situations of treatment and control groups respectively”. To derive τ, the following caveats as highlighted in Becker and Ichino (2002) are necessary.
- “lemma balancing hypothesis of pre-treatment variables given the propensity score: that is, if is the propensity score. More so,
- Unconfoundedness given the propensity score: suppose that assignment to treatment is unconfounded”, given as:
Therefore, given the propensity score, unconfounded assignment to treatment is given as:
Similarly, Rosenbaum (2002) as cited in Paudel and de-Araujo (2017) emphasized on the possibility of unobserved characteristics which can potentially affect assignment into treatment as well as the outcome variable, resulting in “potential hidden bias” which may provide essential information for the study. Karyda (2015) also noted that, treatment effects estimation viz-a-viz propensity score analysis only correct for overt bias, while the unobserved covariates create hidden bias factor (γ) if unaccounted for in the analysis. The presence of this bias automatically affects the matching estimates as well as its robustness; although, estimating the magnitude of hidden selection may not be feasible. Becker and Caliendo (2007) therefore suggested the use of bounding approach to investigate the impact of unobserved hidden bias factor(s) on conclusion made of the estimates, simply to avoid under or over estimation of the treatment effects. This provides justification to carry out Rosenbaum sensitivity checks (Diprete & Gangl, 2004).
Results and Discussion
Profiling of Farmers Based on Observable Characteristics
As indicated in Table 1, full adopters, as well as partial and/or non-adopters of full climate-smart farming practices are somewhat distinguishable in terms of outcome of interest (welfare indicator as proxied by farmers’ consumption expenditure per capita) and other potential outcomes (crop yield and farm-income). With reference to welfare outcome, adopters had less welfare-gains (N576.96) compared to the non/partial-adopter counterparts as estimated by the difference computed from the two-sample t-test, though not statistically significant, which is not unexpected. This can be attributed to farmers’ limited capacity in terms of production economies of scale (being smallholder farmers). As far as other potential outcomes (crop yield per hectare and income) are concerned, non/partial-adopters perform significantly better in terms of crop yield than the full adopter counterparts, which is disturbing. Although, this is also in line with welfare-gains outcome as earlier explained. A possible explanation that could be advanced for this observation is land fragmentation factor which is peculiar to most farmers, and possibly, unused farmland holdings (i.e., fallow-land not being put to use) occasioned by the predominant mode of land access in the study area which is land inheritance; whereas, most non/partial-adopters could have possibly acquired their farmland holdings through other means such as lease, rent and buying which as expected should of appreciable size. On the contrary, full adopters appeared to perform excellently well in terms of income realized compared to the non/partial-adopter counterparts; a finding that deviates from the earlier two outcomes. This counter-intuitive finding is not surprising due to the fact that, most farmers tend to underestimate and/or overestimate their income streams in an attempt not to divulge their actual income. Importantly, a plausible and potent explanation for this is that most farmers have little or no formal education, and, usually rely on memory estimates in giving information related to their farm output and income streams.
| Table 1 Farmers’ Personal, Farm and Social Network Features by CA Adoption Status | |||
| Variables | Full Adopters (N=61) | Partial & Non-Adopters (N=287) | Difference Test |
| Response | |||
| Per capita expenditure (welfare) | 6802.37 | 7379.34 | 576.96 |
| Crop yield (kgha-1) | 299.52 | 414.19 | 114.67*** |
| Income (N’000) | 237048.3 | 176725.5 | - 60322.78** |
| Covariates | |||
| Gender | 0.69 | 0.67 | -0.02 |
| Age | 52.32 | 51.84 | -0.49 |
| Years of formal education | 6.29 | 7.73 | 1.44* |
| Marital status | 0.68 | 0.61 | -0.07 |
| Family size | 6.34 | 6.2 | -0.14 |
| Total years of farming experience | 21.92 | 19.55 | - 2.37** |
| Years of CA farming experience | 12.67 | 13.41 | 0.74 |
| Quadratic years of CA farming experience | 230.97 | 249.99 | 19.03 |
| Farm size cultivated under CA | 2.71 | 2.44 | - 0.27** |
| Total available farm size | 5.14 | 4.6 | - 0.54** |
| Land acquisition | 0.71 | 0.76 | 0.05 |
| Access to extension service | 0.92 | 0.9 | -0.02 |
| Frequency of extension contact | 2.11 | 1.65 | - 0.46* |
| Credit access | 0.81 | 0.73 | - 0.08*** |
| Information acquisition | 0.435 | 0.441 | 0.005 |
| Farmers occupational group membership | 0.69 | 0.59 | - 0.10** |
| Participation in collective action | 0.33 | 0.26 | -0.07 |
| Density of social groups membership | 3.82 | 3.83 | 0.01 |
| In-kind contribution to groups | 14.62 | 13.82 | -0.8 |
| Social capital-trust | 0.54 | 0.63 | 0.09** |
| Risk preference/attitude | 0.343 | 0.341 | -0.002 |
| Index of social capital benefits | 0.602 | 0.605 | 0.003 |
| Index of CA benefits | 0.696 | 0.676 | -0.02 |
| Regional characteristics | 1.78 | 1.91 | 0.13 |
Source: Data analysis, 2018.
The results also indicated that the farmers were also significantly distinguishable in terms of farmers’ personal characteristics, plot-level/farm-based characteristics, institutional engagements as well as social capital components/designates. For instance, non/partial-adopters seemed to be better off than the full adopter counterparts in terms of human capital proxy-years of formal education while full adopters perform better than the non/partial-adopters in relation to the total accumulated years of farming experience. Meanwhile, in line with Manda et al. (2017), farm size under cultivation (using these practices), and total available farm size, both have increasing positive and significant effects for adopters on the probability that a farmer will adopt these environmental-friendly agricultural practices; suggesting that adopter farmers with large expanse of landholdings have more competitive advantage to adopt more of these practices. Consistent with the findings of Nguezet et al. (2011), institutional factors (extension delivery service, frequency of contact with extension service personnel by farmers, and, access to credit facilities) were found to drive positive and significant effects on the full adopter farmers compared to the non/partial-adopter counterparts. However, full adopters were better off in relation to membership of farmers’ occupational group (this represents kinship ties and networks as the main catalysts of social capital) compared to the non/partial-adopter counterparts. This affirms the importance of neighborhood effect in advancing diffusion and uptake of information on improved agricultural practices among farmers in Africa; this finding is in tandem with Ngwira et al. (2014); Hunecke et al. (2017); Husen et al. (2017). Conversely, non-adopters and partial-adopters seem to be better off in terms of social capital-trust than category who adopted the full CA practices. This suggests that the likelihood of adoption decreases first among the farmers due to a low level of trust on these improved farming practices as currently seen, but also likely to increase with time when substantial trust is built once these practices become more viable, visible and attractive to most farmers.
Conclusively, the study has shown that some features as described in Table 1 are observable characteristics that influence farmers’ decision to adopt the improved agricultural practices and the welfare gains. Besides, there exist some unobserved factors/characteristics/features that also affect assignment into treatment, and the outcome variable simultaneously. In other words, these unobserved factors have correlation with, or some varying degree of influence on the adoption of agricultural technologies. However, if these unobserved factors are not addressed, the estimates may be vulnerable to a hidden bias, and could potentially change the conclusion and causal inference made of the treatment effects (that is, adoption decision). Hence, the need for treatment effect estimation and sensitivity test/robustness checks, as explicitly presented in the subsequent sub-sections. Equally, it is important to stress that there is no evidence of multicollinearity problem in the model applied. This is evident from the variance inflation factor (VIF) diagnostic test and tolerance level presented in Table 2. More so, the mean variance inflation factor was significantly below 10 (Midi & Bagheri, 2010).
| Table 2 Multicollinearity Tests (VIF and Tolerance) | ||
| Variables | VIF | Tolerance |
| Adoption of CA | 1.13 | 0.8872 |
| Gender | 1.02 | 0.9852 |
| Age | 1.13 | 0.8812 |
| Years of formal education | 1.16 | 0.8624 |
| Quadratic years of CA farming experience | 1.03 | 0.9691 |
| Farmers occupational group membership | 1.14 | 0.8791 |
| Information acquisition | 1.11 | 0.9008 |
| Total available farm size | 1.41 | 0.7069 |
| Farm size cultivated under CA | 1.41 | 0.7072 |
| Credit access | 1.04 | 0.9612 |
| Social capital-trust | 1.1 | 0.9076 |
| Participation in collective action | 1.03 | 0.9684 |
| Frequency of extension contact | 1.85 | 0.5401 |
| Regional characteristics | 1.9 | 0.5272 |
| Mean VIF | 1.25 | |
Adoption Pattern in the Study Area
The adoption status of the three basic recommended CA practices (that is; “minimum soil disturbance, the use of crop biomass for permanent cover of soil, as well as sequential rotation practice for different unrelated crops”) by FAO (2011) as currently observed in South-West Nigeria was presented in Table 3. The results indicated that about 16.3% of the farmers did not adopt any of these recommended practices (the non-adopters), while about two-third (66.3%) adopted either one and/or two of the practices (the partial adopters). The findings also revealed very small proportion (17.4%) of the sampled farmers who adopted all the three FAO recommended CSFP (the full-adopters) in the study area.
| Table 3 Adoption Status of the Respondents | ||
| Adoption status | Frequency | Percentage |
| Non-adopters | 57 | 16.29 |
| Partial-adopters | 232 | 66.28 |
| Full Adopters | 61 | 17.43 |
| Total | 350 | 100 |
Consistent with D’Souza and Mishra (2018), the findings suggest that the diffusion of these eco-friendly practices, or so to say conservation agriculture is still limited in Nigeria, as also currently observed in many countries in sub-Saharan Africa. This could have a devastating implication on the sustainability of food production and by extension, attainment of zero hunger as enshrined in the United Nations’ SDGs. Perhaps, this finding could be attributed to farmers’ apathy to embrace transition from traditional methods of farming to more sustainable practices.
Impact of Adoption of Eco-Friendly Agricultural Practices on Farmers’ Welfare Gains-HTE Model
The treatment effects with its linear representation, as well as the its plot in Table 4 and Figure 2 respectively revealed the stratification-multilevel (SM) estimates for the heterogeneous treatment effects on farmers’ welfare. According to Manda et al. (2017), the dots in the figure mirror the “point estimates of level-1 slopes, stratum linear and probit regression effects of adoption on outcome variable” (which is farmers’ welfare-gains), whereas the lines stands for “variance-weighted least squares level-2 slopes”. From the Table 4 and the plot for welfare model (Figure 2), just few significant slopes in level-1 slopes were observed for the outcome variable; which could be linked to “possible differential bias in the observed and unobserved factors affecting the treatment and the outcome across the propensity score strata”, as well as the limited sample sizes within strata. This finding appears similar to what Manda et al. (2017) reported about many level-1 slopes which are non-significant.
| Table 4 Heterogeneous Treatment Effect Estimates by Stratification-Multilevel Method | ||||
| log of per-capita expenditure | Coefficient | std. error | Z | p>|z| |
| TE by strata | ||||
| 1 | -0.7365 | 0.0714 | - 10.31* | 0 |
| 2 | -0.0226 | -0.1507 | -0.15 | 0.881 |
| 3 | -0.0589 | 0.1047 | -0.56 | 0.573 |
| 4 | -0.0186 | 0.085 | -0.22 | 0.827 |
| 5 | -0.5115 | 0.2268 | - 2.26** | 0.024 |
| Linear trend | ||||
| _slope | 0.1994 | 0.0332 | 6.01* | 0 |
| _constant | -0.8264 | 0.0937 | - 8.82* | 0 |

Figure 2 HTE Plot by Stratification-Multilevel Estimator
Similarly, as shown in Figure 2, the plot indicated a possible rising trend in the adoption impact, though in a sinusoidal pattern; suggesting that farmers with higher chances of adoption have higher welfare-gains than the ones who appear to have smaller odds to adopt these farming practices. Consistent with Mutuc et al. (2013) as cited in Manda et al. (2017), a reasonable explanation which can be advanced for this trend is that, larger proportion of farmers who have high probability to adopt are perhaps the ones who have comparative advantage on access to resources which could include but not limited to farmland holdings, labour, capital, social networks and institutional supports. In the same vein, considering the level-2 slopes as indicated in Figure 2, the results suggest a statistically significant (p<0.05) welfare-increasing effect or welfare-gains of adoption which increases by approximately 20% for each unit change in propensity score rank. As noted by Manda et al. (2017), it is required to emphasize at this point that, the treatment effects with SM estimator being described so far is the average treatment effects within each of the stratum. Hence, all these findings suggest the presence of CA adoption welfare-increasing impact.
Likewise, Table 5A presents the propensity score probit regression model predicting adoption of CA which resulted from matching-smoothing method of HTE. In line with Hagos et al. (2018), the findings indicated that years of formal education, neighborhood effect of trust, collective action active participation and frequent extension delivery system significantly predict adoption of the farming practices. Importantly, as clearly shown in Table 5B, these notable characteristics also distinguish the adopters (treated) and non-adopters (untreated) by welfare-gains. However, Table 5B presents the ATT estimate which mirrors the variation in realized welfare-gains outcome scores between the adopters and non-adopters as though the non-adopters are also the adopters group. The estimation of ATT according to Manyumwa et al. (2017) permits the “identification of any possible impact that is independent of other factors”. This treatment effects estimates using matching-smoothing estimator shows the adoption impact of CA improved farming practices on smallholder farmers’ realized welfare outcome revealed that adoption of these improved practices by farmers had strong significant (p<0.01) effects on the realized welfare-gains; though with negative relationship which permits to infer that there is possibility for these farmers to perform better than currently reported to experience positive effects, if efficient enough to stay within the production possibility curve. This is achievable if and only if supported well enough by government rural agricultural development policy, non-governmental organizations (NGOs), development experts and they (farmers) also make use of the kinship ties and networks as catalysts of social capital to advance diffusion and sharing of beneficial information among each other, render supports and assistance in terms of finance, and in-kind contribution (labour contribution and participation in collective actions) to foster the needed development in agri-food sector.
| Table 5A Propensity Score-Probit Regression Model Predicting Adoption of CA | ||||
| Adoption of CA | Coefficient | std. error | Z | p>|z| |
| Gender | 0.0609 | 0.1514 | 0.4 | 0.687 |
| Age | 0.0053 | 0.0089 | 0.59 | 0.555 |
| Years of formal education | -0.0262 | 0.0148 | - 1.77*** | 0.076 |
| Quadratic years of CA experience | -9.263 | 0.0003 | -0.01 | 0.991 |
| Farmers occupational group membership | 0.1759 | 0.1543 | 1.14 | 0.254 |
| Information acquisition | -0.005 | 0.1489 | -0.03 | 0.975 |
| Total available farm size | 0.0534 | 0.0346 | 1.55 | 0.122 |
| Farm size cultivated under CA | 0.0972 | 0.0704 | 1.38 | 0.167 |
| Credit access | 0.206 | 0.1688 | 1.22 | 0.222 |
| Social capital-trust | -0.4006 | 0.173 | - 2.31** | 0.021 |
| Participation in collective action | 0.2797 | 0.1573 | 1.78*** | 0.075 |
| Frequency of extension contact | 0.2737 | 0.0824 | 3.32* | 0.001 |
| Regional characteristics | 0.071 | 0.1293 | 0.55 | 0.583 |
| Constant | -1.1805 | 0.7012 | - 1.68*** | 0.092 |
| Table 5B Average Treatment Effects on the Treated (ATT) Through NN-Matching | |||||
| Variable | Sample | Treated | Controls | Difference | t-stat |
| log of percap exp. | Unmatched | 8.7022 | 8.7766 | -0.0745 | -1.37 |
| ATT | 8.7022 | 8.9344 | -0.2322 | - 2.64* | |
| ATU | 8.7766 | 8.6289 | -0.1478 | - | |
| ATE | - | - | -0.1977 | - | |
Importantly, as a cautionary note, Imbens and Wooldridge (2009) stressed that, compared to average treatment effect, reporting ATT is preferred for policy inference. Therefore, following the estimation procedure provided in Xie et al. (2012), this research observed the caveat of “parametric assumption (otherwise referred to as linear trend assumption)”. Therefore, full non-parametric MS estimator of the treatment effect heterogeneity was used to generate the plot graph shown in Figure 3. This figure depicts the polynomial MS estimator curves fit to nearest-neighbor matched differences in the realized welfare-gains between the two groups of farmers by the propensity scores estimated. More so, the likelihood to adopt is shown in the x-axis, while the matched difference, measured by ATT between these two groups is shown in y-axis. Towards the left end of the distribution, the ATT result revealed a steady increase in farmers’ welfare gains; this rising ATT at the start of the distribution peaked at about 0.5 points in terms of propensity score. On the other hand, there is a relatively slow decline in ATT between 0.6-0.9 points in terms of propensity scores. This result implies that, farmers having higher likelihood for adoption initially benefit the most in terms of welfare-gains from the decision to adopt. As advanced by Abdulai and Huffman (2014), this trend and observation apparently suggests that the farmers with higher chances of adopting these improved practices are those having advantages over others in terms of productive resources, good social networks and neighborhood effect, and they also enjoy timely institutional support. Conversely, the rising propensity for adoption unfortunately declines after certain limit, which could apparently suggest negative selection. The reason that might be advanced for this observation, as gathered, is tied to ‘trust’ issue in terms of performance and immediate gains of the these practices, as well as perceived fear of what is termed ‘alien farming practices’ which could by extension results to social exclusion within the community especially with no-tillage climate-smart technique, as compared to their traditionally inclined farming practices; for instance, slash and burn technique.

Figure 3 HTE Plot by Matching-Smoothing Estimator
Similarly, Figure 4 presents the treatment effect heterogeneity estimation plot using SD estimator, which of course is similar to polynomial fit MS method. The result clearly revealed a welfare increasing impact of adoption as farmers’ propensity for adoption increases between propensity scores ranging between 0.1-0.4 points. However, a persistent and constant trend was observed till propensity score of 0.8. Equally, a sharp decline in the adoption effects was noted immediately between 0.8 (80%) and 0.9 (90%) propensity scores. In other words, there seems to be a mixed effect of adoption as it concerns the slope generated from SD method, which is in line with previous estimators. Obviously, this presents a clear instance of initial positive and eventual negative slope effects; suggesting welfare increasing impact at the start of the distribution, and eventual decreasing effect with the possibility to adopt at the later end of the distribution. Hence, these findings infer a negative selection effect. To buttress the above findings and for robustness sake, this study further estimated the heterogeneous treatment effects by comparing the treated and control groups based on farmers’ land acquisition mode. This is because adoption or non-adoption is perhaps premised on availability and access to land resources and other factors. In line with previous discussed findings, the treatment effects plots shown in Figures 5, 6 and 7 respectively also revealed a similar observation and trend with non-adopter farmers whose mode of land acquisition is not through inheritance performing better in terms of welfare-gains than most of the adopters whose land acquisition is otherwise.

Figure 4 HTE plot by Smoothing-Differencing Estimator

Figure 5 HTE Plot by Stratification-Multilevel Estimator (by Land Acquisition)

Figure 6 HTE Plot by Matching-Smoothing Estimator (by Land Acquisition)

Figure 7 HTE Plot by Smoothing-Differencing Estimator (by Land Acquisition)
Robustness Checks: Sensitivity Analysis
Sensitivity test of “unobserved heterogeneity” is a robustness check which investigates how a change in gamma parameter (Г) could cause change the conclusion made of the matching estimates. However, Manyumwa et al. (2017) stated that, the parameter (Г) represents the “log of the odds of differential assignment due to unobservable factors. This can also reflect the probability of two observations being differentially assigned to a treatment, despite these observations having been matched according to observable factors”. The authors further noted that if Г=1, there is “no evidence of hidden bias or unobservable characteristics that could cause differential assignment for matched observations”. Importantly, Hujer et al. (2004) as cited in Nikoloski and Ajwad (2013) also emphasized that it is meaningless to conduct sensitivity analysis for an insignificant ATT estimates.
Similarly, Manyumwa et al. (2017) noted that, “if the ATT estimates remain significant after changing Г, then the estimates are robust to hidden bias. However, if the significance of the estimates is sensitive to changes in Г, then the estimates are not robust”. Therefore, the results of the sensitivity test shown in Table 6 evidently indicated that the negative effect of adoption on farmers’ welfare-gains is insensitive to selection/unobserved bias. Consistent with the findings of Nikoloski and Ajwad (2013), this study infers that the ATT estimate in Table 5B reflects a pure impact effect of the adoption.
Conclusion and Policy Implications
This study revealed farmers apathy towards adoption of environmental-friendly and improved agricultural practices in South-West Nigeria, and evidently, adoption status is still largely partial in the area of study. This agrees with the findings of Rodenburg et al. (2020) who noted that CA adoption rate among the farmers in SSA are low, especially when it has to do with full adoption of the basic three CA principles. The findings also indicated that adoption of these farming practices by farmers had both welfare-increasing and decreasing effects for every point change in the propensity score rank. However, negative bias was suspected. This permits to infer that there is a possibility for these farmers to perform better than currently reported to experience positive effects, if efficient enough to stay within the production possibility curve. The findings also indicated that years of formal education, neighborhood effect of trust, active participation in collective action, and frequent extension delivery system significantly predict adoption of CA practices.
This result is also in agreement with Adebiyi et al. (2019) as well as Mujeyi et al. (2019) who reported how adoption behaviour is inherently dynamic and a complex decision-making paradigm mediated by cognitive, affective (emotional), and contextual factors, which no one theory can account for and shaped by multiplicity of other factors characterized by interdependencies and non-linear behaviour. These notable factors or characteristics also distinguished the adopters (treated) and non-adopters (untreated) of CA by welfare-gains. More so, many farmers with high chances to adopt are perhaps the ones who have good standing in terms of productive resources. This position was also supported by Adebiyi et al. (2019) who stressed on the role played by the “confluence of environment with gendered norms and culture, differentiated access to and control over resources, as well as the heterogeneous intra-household decision-making dynamics” on the adoption decision. More importantly, rosenbaum test and robustness checks revealed that the negative effect of adoption on farmers’ welfare-gains is not sensitive to unobserved bias. Therefore, the ATT estimate mirrors a pure impact of the adoption decision by the farmers.
Arising from all these findings, effort should be raised on aggressive extension delivery system to assist in advancing diffusion and uptake of information on improved agricultural practices among farmers in the study area, and beyond. Importantly, intra and inter community social networks should be promoted, especially in the area of neighborhood effect. Positive networking and collective participation in community or neighborhood affairs are regarded as a safety net for individuals to benefit from information sharing and diffusion. This will assist in addressing the farmers’ apathy and transitioning to new and innovative agricultural practices. This is because information acquired through individual’s social networks, which is a strong tie, is vital to advance positive adoption decision in farmers and to increase productivity; and by extension improves farming households’ welfare condition.
Limitations
A reasonable approach of exploring CA adoption status and its welfare impact would have been to highlight when a farmer adopted CA, and comparing how long (years) CA has continually been implemented with their expected switching welfare status. This of course will necessitate a panel form of dataset. This data limitation made such line of research inquiry in this study not to be covered; while the observations recorded on the 350 sampled farmers’ socio-economic and demographic features are those observed during data collection period in 2018/2019 farming season. Although, the 350 sub-sample selections’ responses found useful for this research are very valid for the purpose of the study; however, this study believes that further research should use more sample size which apparently will yield more than enough observations, to accurately predict the unique distribution of the randomness in the parameters.
Areas of Further Research
Extending research investment to other regions in Nigeria should be given adequate attention to further expand the scope of this study, and to account for regional comparison of CA adoption, especially in the middle belt part of Nigeria; this is because of the regional differences in agro-ecological endowments in Nigeria. This area is also known to be involved in aquifer and irrigation food production system. Another identified area of further research is the seemingly neglected aspect of farmers’ indigenous knowledge. This can be incorporated to the engagement strategies of the adoption process by development experts and the promoters of CA. For any success story to be recorded in the promotion and scaling up of CA in South-west Nigeria and the country as a whole, engagements process must take into account, the cultural beliefs and practices, as well as the prevalent agro-ecological conditions in the geographical area of interest. All these will aid successful transmission of the CA message to the smallholder farmers.
Funding
This research received no funding.
Ethical Considerations
The research observed the following ethical considerations: anonymity, informed consent, privacy, confidentiality as well as professionalism in the study area.
References
- Abdulai, A. &amli; Huffman, W. (2014). The Adolition and Imliact of Soil and Water Conservation Technology: An Endogenous Switching Regression Alililication. Land Econ., 90(1), 26-43.
- Adebayo, O. &amli; Olagunju, K. (2015). Imliact of Agricultural Innovation on Imliroved Livelihood and liroductivity outcomes among Smallholder Farmers in Rural Nigeria. A lialier liresented at the MSM 5th Annual Research Conference on: Managing African Agriculture: Markets, Linkages and Rural Economic Develoliment, Selitember 4 2015, MSM, Maastricht, The Netherlands. Working lialier No. 2015/07.
- Adebiyi, J., Olabisi, L., Richadson, R., Liverliool-Tasie, L. &amli; Delate, K. (2019). Drivers and Constraints to the Adolition of Organic Leafy Vegetable liroduction in Nigeria: A Livelihood Aliliroach. Sustainability, 12, 96.
- Ademola, A.O., &amli; Olujide, M.G. (2014). Soil Conservation liractices of Arable Croli Farmers in Atisbo Local Governement Area of Oyo State, Nigeria. Advances in Research, 2(12), 878-888.
- Akinbode, W.O., &amli; Bamire, A.S. (2015). Discountinued use decision of imliroved maize varieties in Osun State, Nigeria. Journal of Develoliment and Agricultural Economics, 7(3), 85-91.
- Akyüz, N., &amli; Theuvsen, L. (2020). The Imliact of Behavioral Drivers on Adolition of Sustainable Agricultural liractices: The Case of Organic Farming in Turkey. Sustainability, 12, 6875.
- Atkinson, A.B. (1989). “lioverty” In: Eatwell, J., M. Millgate and li. Newman (eds.) Social Economics: The New lialgrave. lili. 77-89. New York: Norton.
- Ayenew, W., Lakew, T. &amli; Kristo, E. (2020). Agricultural technology adolition and its imliact on smallholder farmer’s welfare in Ethioliia. African Journal of Agricultural Research, 15(3), 431-445.
- Baiyegunhi, L.J.S. &amli; Fraser. G.C.G. (2011). Vulnerability and lioverty Dynamics in Rural Areas of Eastern Calie lirovince, South Africa. Ghana Journal of Develoliment Studies (GJDS), 8(2), 84-100.
- Becker, S.O. &amli; Caliendo, M. (2007). Sensitivity analysis for average treatment effects. The Stata Journal, 7(1), 71-83.
- Becker, S.O. &amli; Ichino, A. (2002). Estimation of average treatment effects based on liroliensity scores. The Stata Journal, 2, 358-377.
- Cochran, W.G. (1963). Samliling Techniques, 2nd Ed., New York: John Wiley and Sons, Inc.
- Coolierative Information Network (COliINE) Nigeria (2018). Mali of the selected states in South-West Nigeria.
- Corbeels, M. et al. (2010). Imliact and adolition of conservation agriculture in Africa: a multi-scale and multi-stakeholder analysis. Centre de Cooliération Internationale en Recherche Agronomique liour le Déveloliliement (CIRAD), Avenue Agroliolis, 34398 Montliellier cedex 5, France.
- D’Souza, A. &amli; Mishra, A.K. (2018). Adolition and Abandonment of liartial Conservation Technologies in Develoliing Economies: The Case of South Asia. Land Use liolicy, 70, 212-223.
- Dilirete, T.A. &amli; Gangl, M. (2004). Assessing bias in the estimation of causal effects: Rosenbaum bounds on matching estimators and instrumental variables estimation with imlierfect instruments. Sociological Methodology, 34, 271-310.
- Food and Agriculture Organization (FAO) (2011). Save and Grow, a liolicymaker’s guide to sustainable intensification of smallholder croli liroduction. Food and Agriculture Organization of the United Nations, Rome. lili. 116.
- Food and Agriculture Organization (FAO) (2018). Climate Smart Agriculture: Building Resilience to Climate Change. Edited by David Zilberman, Renan Goetz, and Alberto Garrido. Rome: Food and Agriculture Organization of the United Nations (FAO). Retrieved from httli://www.sliringer.com/series/6360.
- Food and Agriculture Organization (FAO). (2013). Sourcebook on Climate-Smart Agriculture, Forestry and Fisheries. Retrieved from httli://www.fao.org/climate-smart-agriculture/72611/en/.
- Grootaert, C., Oh, G.T., &amli; Swamy. A. (2002). Social Caliital, Household Welfare and lioverty in Burkina Faso. Journal of African Economies, 11(1), 4-38.
- Hagos, H., Ndemo, E., &amli; Yosuf, J. (2018). Factors affecting adolition of uliland rice in Tselemti district, Northern Ethioliia. Agriculture and Food Security, 7(59), 1-9.
- Harvey, C. et al. (2018). Climate change imliacts and adalitation among smallholder farmers in Central America. Agriculture and Food security, 7(57), 1-20.
- Hujer, R., Caliendo, M., &amli; Thomsen. S.L. (2004). New evidence on the effects of job creation scheme in Germany- a matching aliliroach with three-fold heterogeneity. Research in Economics, 58, 257-302.
- Hunecke, C., Enger, A., Jara-Rojas, R., &amli; lioortvliet, li.M. (2017). Understand the Role of Social Caliital in Adolition Decisions: An Alililication to Irrigation Technology. Agricultural System, 153, 221-231.
- Husen, N.A., Loos, T.M., &amli; Siddig, K.H. (2017). Social Caliital and Agricultural technology Adolition among Ethioliian Farmers. American Journal of Rural Develoliment, 5(3), 65-72.
- Imbens, G.W. &amli; Wooldridge, J.M. (2009). Recent develoliments in the econometrics of lirogram evaluation. Journal of Economic Literature, 47, 5-86.
- IliCC (2014). Climate change 2014: imliact adalitation and vulnerability, chaliter 22, Africa. Working grouli II fifth assessment reliort (AR5). Geneva: Intergovernmental lianel on Climate Change.
- Issahaku, G., &amli; Abdul-rahaman, A. (2019). “International Soil and Water Conservation Research Sustainable Land Management liractices, off-Farm Work liarticiliation and Vulnerability among Farmers in Ghana: Is There a Nexus?” International Soil and Water Conservation Research, 7(1), 18-26.
- Jaleta, M., Kassie, M., Marenya, li., Yirga, C. &amli; Erenstein, O. (2018). Imliact of imliroved maize adolition on household food security of maize liroducing smallholder farmers in Ethioliia. Food Security, 10, 81-93.
- Kamara, A., Conteh, A., Rhodes, E. &amli; Cooke, R. (2019). The Relevance of Smallholder Farming to African Agricultural Growth and Develoliment. African Journal of Food, Agriculture, Nutrition and Develoliment, 19(1), 14043-14065.
- Karyda, M. (2015). The Effects of Crime in the Community on Becoming Not in Education, Emliloyment or Training (NEET) at 18-19 years in England. Unliublished lihD Thesis. University College, London.
- Kassam, A., Friedrich, T., Derlisch, R., &amli; Kienzle, J. (2015). Overview of the worldwide sliread of Conservation Agriculture. The Journal of Field Actions (Field Actions Science Reliorts), 8, 1-12.
- Manda, J., Khonje, M.G., Alene, A.D., &amli; Gondwe, T. (2017). Welfare imliacts of imliroved groundnut varieties in eastern Zambia: A heterogeneous treatment effects aliliroach. Agrekon, 56(4), 313-329.
- Manyumwa, H.D., Siziba, S., Unganai, li., Malifumo, li., &amli; Mtambanengwe, F. (2017). The imliacts of community-based cash management tools on smallholder rural farmers’ access to livelihood assets. African Journal of Agricultural and Resource Economics, 13(2), 182-192.
- Midi, H. &amli; Bagheri, A. (2010). Robust multicollinearity diagnostic measure in collinear data set. In liroceedings of the 4th international conference on alililied mathematics, simulation, modeling, World Scientific and Engineering Academy and Society (WSEAS), 138-142.
- Mujeyi, A., Mudhara, M., &amli; Mutenje, M. (2019). Adolition determinants of multilile climate smart agricultural technologies in Zimbabwe: Considerations for scaling-uli and out. African Journal of Science, Technology, Innovation and Develoliment (AJSTID), 12(6), 735-746.
- Mulimbi, W., Nalley, L., Dixon, B., Snell, H., &amli; Huang, Q. (2019). Factors Influencing Adolition of Conservation Agriculture in the Democratic Reliublic of the Congo. Journal of Agricultural and Alililied Economics, 51(4), 622-645.
- Mutuc, M., Rejesus, R., &amli; Yorobe, J. (2013). Which farmers benefit the most from Bt corn adolition? Estimating heterogeneity effects in the lihilililiines. Agricultural Economics, 44, 231-239.
- National Economic Emliowerment and Develoliment Strategies (NEEDS-2) (2007). Creating liroslierity through growth, draft reliort, lili: 73-89. &amli; 296-299, a liublication of National lilanning Commission, Abuja.
- Nguezet, li.M.D., Diagne, A., Okoruwa, V.O., &amli; Ojehomon. V.E. (2011). Imliact of Imliroved Rice Technology Adolition (NERICA varieties) on Income and lioverty among Rice Farming Households in Nigeria: A Local Average Treatment Effect (LATE) Aliliroach. Quarterly Journal of International Agriculture, 50(3), 267-291.
- Ngwira, A.R., Johnsen, F.H., Aune, J.B., Mekuria, M. &amli; Thierfelder, C. (2014). Adolition and extent of conservation agriculture liractices among smallholder farmers in Malawi. Journal of Soil and Water Conservation, 69(2), 107-119.
- Nikoloski, Z., &amli; Ajwad, M. (2013). Do Economic Crises Lead to Health and Nutrition Behavior Reslionses? Analysis Using Longitudinal Data from Russia. Reliort submitted to Human Develoliment Economic Unit, The World Bank.
- Olorunfemi, T., Olorunfemi, O., &amli; Oladele, O. (2020). Determinants of the involvement of extension agents in disseminating climate smart agricultural initiatives: Imlilication for scaling uli. Journal of the Saudi Society of Agricultural Sciences, 19, 285-292.
- liaudel, J., &amli; de-Araujo, li. (2017). Demogralihic reslionses to a liolitical transformation: Evidence of women’s emliowerment from Nelial. Journal of Comliarative Economics, 45, 325-343.
- Rodenburg, J., Büchi, L., &amli; Haggar, J. (2020): Adolition by adalitation: moving from Conservation Agriculture to conservation liractices. International Journal of Agricultural Sustainability, 18, 1785734.
- Rosenbaum, li.R. &amli; Rubin, D.B. (1983). The central role of the liroliensity score in observational studies for causal effects. Biometrika, 70, 41-55.
- Rosenbaum, li.R. (2002). Observational Studies. Sliringer; New York: 2002.
- Siziba, K., Nyikahadzoi, K., Makate, C. &amli; Mango, N. (2019). Imliact of conservation agriculture on maize yield and food security: Evidence from smallholder farmers in Zimbabwe. African Journal of Agricultural and Resource Economics, 14(2), 89-105.
- Thierfelder, C., Chivenge, li., Muliangwa, W., Rosenstock, T., Lamanna, C. &amli; Eyre, J. (2017). How climate-smart is conservation agriculture (CA)? Its liotential to deliver on adalitation, mitigation and liroductivity on smallholder farms in southern Africa. Food Security, 9(3), 537-560.
- United Nations (2015). Sustainable Develoliment Knowledge lilatform. Deliartment of Economic and Social Affairs (UNDESA). Retrieved from httlis://sustainabledeveloliment.un.org/sdgs
- von-Loelier, W., Musango, J., Brent, A., &amli; Drimie, S. (2016). Analysing Challenges Facing Smallholder Farmers and Conservation Agriculture in South Africa: A System Dynamics Aliliroach. SAJEMS Asset research NS, 19(5), 747-773.
- World Social Caliital Monitor (2017). Measuring Social Caliital for SDG: methodology and liractice of the World Social Caliital Monitor. The World Bank.
- Xie, Y., Brand, J.E., &amli; Jann, B. (2012). Estimating heterogeneous treatment effects with observational data. Sociological Methodology, 42, 314-347.
- Yusuf, S.A. (2008). Social Caliital and Households’ Welfare in Kwara State, Nigeria. Journal of Human Ecology, 23(3), 219-229.