Research Article: 2023 Vol: 27 Issue: 3S
Agency Costs and Earnings Management: Evidence from China Textile Industry
Zijia Huang, Autonomous University of Madrid
Hao Zhang, Institute University of Lisbon
Citation Information: Huang, Z., & Zhang, H. (2023). Agency costs and earnings management: evidence from china textile industry. Academy of Accounting and Financial Studies Journal, 27(S3), 1-17.
Abstract
Under the modern enterprise system where ownership and management are separated, the principal and agent have a game of interests due to their different positions. The agent passes false accounting information to the principal through earnings management behavior. Therefore, it is necessary to study agency costs and earnings management issues and provide reasonable suggestions to protect the interests of the principal. Selecting the financial data and related corporate governance information of listed companies in the textile industry from 2011 to 2020 on Shanghai and Shenzhen stock markets, a multiple regression model was constructed to explore agency costs and surplus from three aspects: equity agency costs, debt agency costs, and control agency costs. The results show that the governance structure of listed companies in China’s textile industry cannot play an effective governance role. The empirical analysis based on the research hypothesis that listed companies with high agency conflicts will restrain earnings management behaviors by improving the corporate governance structure is not reasonable. Among the listed companies in China’s textile industry, those listed companies with high agency cost of control are easier to whitewash their financial reports through earnings management and need to strengthen the protection of the interests of small and medium shareholders through cash dividends and other methods.
Keywords
Agency Costs, Earnings Management, China Textile Industry.
Introduction
In the 1980s, earnings management has become one of the hot topics in financial accounting theory. In the past, most of the research on earnings management governance focused on corporate governance, the nature of equity and executive incentives, and provided valuable references for corporate earnings management governance (Bendell, Sutherland & Little, 2017). However, the earnings management behaviors of listed companies still exist widely. Management’s manipulation of accounting information reduces the quality of corporate accounting information, damages the trust mechanism between the company and stakeholders, and makes it difficult for stakeholders to obtain information about the company’s operating efficiency. An effective information on debt solvency leads to wrong economic decisions, which is not conducive to the long-term development of the enterprise. Therefore, how restraining the earnings management behavior of listed companies is still a major problem faced by listed companies.
According to the viewpoint of new institutional economics, the organizational form of the company system can reduce transaction costs. However, while reducing transaction costs, the separation of ownership and control in the form of corporate organization leads to the problem of principal-agent. In the actual operation and management process of an enterprise, the principal-agent conflict and the company’s earnings management behavior are related. Researchers have also studied the relationship between agency conflict and earnings management behavior from the perspective of contract theory and corporate governance. These studies not only have different perspectives and analyses in theoretical research but also have great differences in the measurement of agency costs and the choice of agency variables. Therefore, the conclusions drawn from the research on the relationship between agency costs and earnings management are also divergent. Since many factors affect the agency cost and earnings management behavior of a company, the relationship between the two is not simply positive or negative. It is necessary to sort out and further study the relationship between agency cost and earnings management, to figure out the relationship between agency costs and earnings management. To a certain extent, it can provide a basis for companies to formulate financing policies and suppress earnings management decisions. From the perspective of creditor governance, it proposes to strengthen the hard constraints of the debt mechanism, strengthen the enthusiasm and initiative of creditors to participate in corporate governance, protect the interests of creditors themselves, and at the same time improve the management performance evaluation system, and weaken the motivation of management’s earnings management.
Literature Review
Klein (2002) used manipulative accruals to measure earnings management. The study found that whether the audit committee and the board of directors independently affect earnings management, and the proportion of independent directors is negatively related to earnings management. Baber et al. (2006) measured the relationship between agency costs and earnings management from the perspective of supplementary information and cash flow and seasonal benefits. The study found that earnings management is more serious when companies provide cash flow information and financial statements at the same time. Qin & Liu (2013) also selected the total asset turnover rate as the measurement variable of agency cost, and concluded that the degree of earnings management will affect the agency cost of the company, and the greater the degree of earnings management, the higher the agency cost. Moreover, agency costs have a significant positive correlation with earnings management, which is a process of mutual influence. Beuselinck & Deloof (2014) classifies different companies and finds that if earnings management cannot affect minority shareholders’ equity to a large extent, management’s agency costs will be reduced. Song & Wang (2015) studied the relationship between agency issues and accrued earnings management and real activity earnings management from the perspective of the nature of property rights. The research results pointed out that agency costs are positively correlated with accrued earnings management and real activity earnings management.
On the other hand, some studies believe that with the improvement of the quality of accounting information, the agency costs of enterprises have been reduced. The quality of accounting information reflects whether the company’s internal management has a complete and transparent financial system and internal management system. Bushman & Smith (2001) believe that when management transparency increases, accounting information will inevitably lead to more truthful and fair accounting information, and increased corporate management transparency will also enhance trust within an enterprise and can also lead to a drop in agency costs. The agency conflict between shareholders and management has resulted in the management showing good report performance through earnings management to gain the trust and support of shareholders, to ensure the stability of its position in the company and the maximization of its interests. The embezzlement of company interests provides a rationalized cover. Teoh et al. (1998) research shows that in the process of stock issuance, listed companies will increase the company reported earnings level before the issuance by adjusting the manipulable accrued earnings management method, which results in the company’s operating performance after the stock issuance. The decline in stocks and the decline in stock returns have realized the infringement of the interests of external shareholders by controlling shareholders. Martinez & Sanchez (2015) from the perspective of cash on hand, the study found that companies with higher quality accounting information generally have lower free cash flow. And when the free cash flow of the enterprise is low, the probability of misuse of cash by the management is lower, and the agency cost is also reduced Table 1.
| Table 1 The Research within the Last 3 Decades of Coverage | ||
| Topic | Author | Citations |
| Factors of agency cost | Watts & Zimmerman (1986) | 51,421 |
| Cash flow and agency cost | Jensen (1986) | 26,750 |
| Martinez & Sanchez (2015) | 20 | |
| Agency cost and earnings management | Wiedman & & Marquardt (2005) | 159 |
| Baber et al. (2006) | 134 | |
| Qin & Liu (2013) | 32 | |
| Beuselinck & Deloof (2014) | 22 | |
| Song & Wang (2015) | 13 | |
| Dechow et al. (1995) | 226 | |
| Factors of earnings management | Klein (2002) | 2,352 |
| Teoh et al. (1998) | 10 | |
| The quality of accounting information and agency costs | Bushman & Smith (2001) | 3,596 |
View at the research within the last 3 decades of coverage, in the topic of “Agency Costs and Earnings Management: Evidence from China Textile Industry” evolution, it can be found that relevant research involved the factors of agency cost and earnings management, cash flow and agency cost, agency cost and earnings management, and also the quality of accounting information and agency costs. Due to the factors of agency cost and earnings management, related research literatures are cited more frequently. It can be judged that the relationship between agency cost and earnings management is a transformational result of in-depth research.
But, in the current academic research on agency costs and earnings management, the relationship between agency costs and earnings management is not simply a positive or negative correlation. Companies have different agency costs. The relationship between different agency costs and earnings management is also inconsistent in different research periods and different research samples. In terms of the relationship between agency cost and agency cost, like the analysis of equity incentives and earnings management, the perfection of the capital market has a great impact on the relationship between agency cost and earnings management. Expense agency cost is one of the means for enterprise management to manipulate earnings management. If under the equity incentive, the motivation of the management to hold the equity is to sell in the short term, then the management will manipulate the agency cost of expenses for earnings management, otherwise, it will not. The above research results provide ideas for this research. At present, after the introduction of equity incentives into China, it has been recognized by enterprises and implemented. However, due to the imperfect capital market in China, coupled with the Chinese institutional environment and the psychological influence of management, companies’ views on equity and the legal background of equity incentives are different from those in other countries.
Among listed companies in China, the manufacturing industry occupies a large proportion. The textile industry in the manufacturing industry is an industry with significant earnings management characteristics. Limited to the limitations of previous research categories, this research design selects textile listed companies in China’s manufacturing industry as the research sample to explore the relationship between agency costs and earnings management, which is of great significance for guiding the governance of listed companies and the perfection of the securities market.
Hypothesis
Based on the above theoretical research and empirical research on the relationship between agency costs and the degree of earnings management, the following research hypotheses are made:
The governance structure of listed companies in China’s textile industry is not perfect. Although some listed companies have serious agency conflicts, they have not established a good corporate governance mechanism, and have not formed effective constraints on the management’s encroachment on the company’s interests. Therefore, the higher the agency cost, the higher the degree of earnings management. The higher the total asset turnover rate, the more efficient the use of corporate assets, and the lower the cost of equity agency. Therefore, the negative value of the total asset turnover rate is used as the research variable of the equity agency cost. As a result, hypothesis 1: equity agency cost is positively correlated with the degree of earnings management.
Creditors and shareholders are the main sources of corporate funds, but their claims to corporate income and assets are very different. The higher the agency cost between company shareholders and creditors is. To reduce financing costs and reduce the restrictions on the company’s investment and financing activities by debt contract terms, the controlling shareholder will whitewash the financial report through earnings management to gain an advantage in the game with creditors. Status Due to the financing preferences of listed companies in China and the characteristics of the bond market, the debt governance mechanism may not be able to play its due role (Lin & Wei, 2000). Therefore, the correlation between debt agency costs and the degree of earnings management is not necessarily significant (Luo & Li, 2019). This study takes debt financing cost as the research variable of debt agency cost and proposes hypothesis 2: The debt agency cost is positively correlated with the degree of earnings management.
In the case of a relatively concentrated corporate ownership structure, the main problem of corporate agency conflict is the encroachment of the interests of small and medium shareholders by the controlling majority shareholder. The higher the agency cost between the controlling shareholder and the minority shareholder, to maximize the private benefits of control and the interests of insiders, the controlling shareholder will use the revised financial report through earnings management to show to shareholders, funds and other external investors good business performance to raise the stock price and enhance the company’s market value (Qin & Liu, 2013). As a result, hypothesis 3: The agency cost of control is positively correlated with the degree of earnings management.
TobinQ value is the ratio of the market value of the company’s assets to the company’s expected asset replacement value. It is used to measure the company’s performance or growth opportunities. It can be used as a reflection of the company’s investment value, and can also be used as a characterization of the company’s operating performance. Effective operation and management when the interests of management and shareholders are consistent are conducive to maximizing the value of the company (Lang & Litzenberger, 1989). The greater the value of TobinQ; the greater the value of TobinQ; the more consistent the interests of controlling shareholders and external shareholders, the lower the degree of capital encroachment and interest encroachment on the listed company. The higher the value, the higher the TobinQ value. Therefore, the TobinQ value is not only affected by the management behavior of the management, but also by the controlling shareholder’s decision-making behavior of the listed company. It can be considered that the lower the agency cost of the listed company as a whole, the greater the TobinQ value. As a result, Hypothesis 5 is proposed: TobinQ value is negatively correlated with the degree of earnings management.
The distribution of cash dividends is an effective mechanism to alleviate the conflict of interest between controlling shareholders and small and medium shareholders. The higher the cash dividend, the lower the free cash flow of the controlling shareholder’s encroachment on interests, and the lower the agency cost of control rights. At the same time, the less cash flow management can make on-the-job consumption or investment behaviors, the management’s investment or investment to realize personal benefits Consumer behavior is also restricted, and the cost of equity agency is lower (Qiang et al., 2017). It shows that the interests of the company’s management and shareholders, controlling shareholders and small and medium shareholders are relatively consistent, and their motivation to conceal personal interests in earnings management is smaller (Baber et al., 2006). As a result, hypothesis 4: cash dividends are negatively correlated with the degree of earnings management.
External auditing is an important force to supervise and control the company’s earnings management. The process of auditing financial reports by auditors is the process of identifying and correcting the earnings management behavior of the audited entity. The higher the professionalism of the auditing unit, the higher the audit quality. Companies with a higher level of earnings management are more likely to be issued non-standard opinions by auditors (Weigand & Baker, 2011). However, in China, especially in state-owned holding companies, the absence of the main body of property rights leads to a lack of demand for audit services, a lack of checks and balances in equity, and insufficient management constraints. The management or controlling shareholder manipulates the financial information system to achieve the reporting process, and the quality of financial reports is restricted. Based on the wishes of management or controlling shareholders; in the accounting service market, the audit work of certified public accountants is restricted by the firm, and its independence and practice quality are affected (Huang Ke et al., 2019). It cannot guarantee that audits and audit reports truly and completely reflect the financial information of the company. As a result, Hypothesis 6 is proposed: audit is negatively correlated with the degree of earnings management, but this correlation is uncertain.
The independent director system is China’s rigid policy and regulations on listed companies, intending to enhance the transparency of the company through the independence of the board of directors, reducing the degree of information asymmetry between major shareholders and external small and medium shareholders, and improving the corporate governance structure. Under normal circumstances, the composition of the board of directors is an important factor affecting the efficiency of the board of directors (Beuselinck & Deloof, 2014). A board of directors with a high proportion of independent directors is easier to eliminate external influences, reduce financial fraud, and ensure the authenticity of financial information. However, under the background of China’s dominance and lack of checks and balances in equity, the selection of independent directors depends on controlling shareholders, etc. It is difficult to form a unified understanding of the actual operating effects of the independent director system. As a result, Hypothesis 7 is proposed: The proportion of independent directors is negatively correlated with the degree of earnings management, but this correlation is uncertain.
Methodology
The Chinese textile industry was selected as the sample scope of the study. In China, the textile industry is a labor-intensive industry, and the upstream and downstream of the industrial chain are highly correlated. The upstream raw materials of the textile industry include cotton, cocoon silk, chemical fiber, etc., involving agricultural planting, breeding, chemical industry and other related industries. The midstream is the processing and manufacturing link of the textile industry. The downstream industries mainly include clothing, household textiles, and industrial textiles (Abbas et al., 2021). From the perspective of historical performance, changes in the production-sales rate caused by the fluctuations in upstream raw material prices and the fluctuations in downstream demand have a significant impact on the profitability of China’s textile manufacturing industry, which also makes China’s textile industry more cyclical (Lin et al., 2018).
Variables
Agency cost
The agency cost is measured by selecting relevant indicators as proxy variables. De Anglo et al. (2000) believe that operating expense ratio and asset use efficiency conform to the nature of agency costs, and can be used as the measurement of agency costs. Singh & Davidson (2003) further considered the composition of operating expenses based on the research of De Anglo et al. (2000), and found that the transportation, handling, and packaging expenses included in operating expenses could not effectively reflect agency costs. And in real life, it is difficult to find companies with zero agency costs, so sales and management costs are directly used to measure agency costs.
Equity agency cost (Ac equity)
Deng et al. (2008) studied the corporate governance effect of bank claims and found that the asset management expense ratio, as a combination of the management expense ratio and the total asset turnover rate, can well reflect the agency cost issue. This article believes that the direct measurement of additional expenditures of enterprises or the use of company characteristic indicators such as scale and growth as agency variables of agency costs cannot obtain pure agency cost data, and cannot objectively and truly reflect agency costs between shareholders and management of listed companies. The efficiency of asset use expressed in terms of total asset turnover rate can be used as a reasonable variable for equity agency costs. In the textile industry, the turnover rate of total assets can reflect the operating performance of the company’s management. Therefore, in this research, the total asset turnover rate is used to represent equity agency cost.
Debt agency cost (Ac debt)
According to the research results of Jensen & Meckling (1976), due to the existence of agency conflicts between shareholders and creditors, creditors will sign binding debt contracts with the company or increase loan interest rates. Therefore, the loan interest rate, which is the cost of debt financing, can be used as an important indicator to measure the cost of debt agency. Anderson et al. (2003) used the difference between the weighted average return of the bonds issued by the company and the yield of the national debt with the same maturity time to express the debt financing cost. Higher, the higher the agency cost between shareholders and creditors.
However, due to China’s special institutional background, listed companies rarely issue corporate bonds. Information on the company’s debt maturity structure is not easy to obtain. It is not appropriate to use the difference between the weighted average yield of bonds issued by the company and the yield of treasury bonds with the same maturity time to measure debt agency costs.
This paper uses financial expense indicators to represent the cost of the company’s use of external funds, and considers the existence of corporate bonds issued by listed companies. The financial expense data in this article is taken from the CCER database. The financial expense in this database represents the expenses incurred in raising funds required for production and operation, including interest expenses (minus interest income) and exchange losses (minus exchange Income) and related fees, etc. Because the research samples are all listed companies in the textile industry, the proportions of interest, income, and exchange gains and losses are relatively low. Therefore, the cost of debt financing can be used as the cost of the company to raise funds, and can be used as a research variable that reasonably reflects the cost of debt agency.
Agency cost of control (Accontrol)
Meng & Zhou (2018) found that financial linkages have significant negative effects on both calculated and true earnings management. Equity agency costs and debt agency costs play a part in the intermediary role between financial linkages and accrued earnings management. The intermediary effect of the agency cost of control rights is not significant. This article believes that in the actual operation and management process of listed companies in China, there are also some companies accounts receivable and accounts payable that reflect the company’s real trading behavior, and do not form funds through connected transactions of receivables or payables. Embezzlement, and if receivables and payables represent the company’s embezzlement of funds through related transactions, it is equivalent to assuming that all listed companies will conduct related transactions through receivables and payables to achieve capital embezzlement. Such an assumption is not in line with the actual situation. Therefore, this paper selects purely transaction indicators in the research, from the CCER listed company-related transaction database, according to whether there is a control relationship, holding relationship, or kinship between the related party company and the listed company, and summarizes the related transactions that occurred in the current year. The amount is used as a measurement of the degree of embezzlement of the listed company’s funds by the controlling shareholder through related transactions. Therefore, it is reasonable to use the purely related party transaction indicators obtained through screening in this paper as a research variable reflecting the agency cost of control rights.
Earnings management
Given the textile industry is labour-intensive, so the real earnings management is considered rather than accruals earnings management. Real earnings management is a mainstream earnings management strategy because accruals earnings management is more likely to detect (Cohen & Zarowin, 2010; Roychowdhury, 2006). Textile firms may find it convenient to manipulate earnings via REM, such as overproducing at certain times to improve the operating margin.
A large number of empirical studies have shown that the manipulative accruals estimated by the modified Jones model can reasonably and effectively measure the degree of earnings management of listed companies. For example, Lin & Wei (2000) research on earnings management in the process of public offering (IPO) of listed companies in China. Luo & Li (2019) found that the motivation of companies to turn around and the earnings management through investment returns have a positive impact on companies being issued non-standard audit opinions. At the same time, abnormal audit fees will reduce this positive impact.
Judging from the actual situation in China, the history of the stock market is relatively short, and the time experienced by listed companies is also very short, and the systematic disclosure of accounting information and the establishment of a corporate governance structure only started in 1998. Therefore, when Chinese scholars use the modified Jones model, most of them use cross-sectional data instead of time series data, but empirical research shows that good testing results can also be achieved. In the empirical research process of this article, the panel data and cross-sectional data were established on the research samples, and it was found that the results of the two research methods were not significantly different. Chinese scholar Lu (1999) proposed an extended Jones model, which is based on the modified Jones model proposed by Dechow et al. (1995) by adding intangibles and other long-term assets. According to the research on the measurement model of earnings management, this paper determines that based on the Jones model extended by Lu (1999), it measures the degree of earnings management of listed companies in the Chinese textile industry.
Control Variable
Tobin’s Q (tobinq)
Lang & Litzenberger (1989) regard Tobin’s Q value as the proxy variable of the company’s equity agency cost, and regard companies with Tobin’s Q value less than 1 as over-invested companies. Theoretically, Tobin’s Q value is the ratio of the market value of the company’s assets to the company’s expected replacement value of assets, which is used to measure the company’s performance or growth opportunities. Although the application of Tobin’s Q theory in China has certain limitations due to the imperfect capital market, it can still provide an investment value perspective for analyzing problems. Tobin’s Q is not only affected by the agency cost of equity, but also by the agency cost of control rights. Therefore, this indicator is used as a control variable to reflect the overall level of company value and agency costs.
Cash dividend (Dividend)
Studies generally believe that the distribution of cash dividends is an effective mechanism to alleviate the conflict of interest between controlling shareholders and small and medium shareholders. Weigand & Baker (2011) studied the choice of dividend policy from the perspective of investor protection and found that the distribution of cash dividends is an important way to effectively protect external investors. Qiang et al. (2017) found that under the background that the new share issuance system is not yet perfect, the controlling shareholders of GEM listed companies use over-raised funds to make a large proportion of cash dividends, which harms the long-term interests of small and medium shareholders. Based on previous studies, this article believes that the higher the cash dividends of listed companies that year, the interests of small and medium shareholders will be protected, and the lower the free cash flow of the controlling shareholder’s interest encroachment. At the same time, the less cash flow management can make on-the-job consumption or investment behavior, the management’s investment or consumption behavior for personal benefit is also restricted. Therefore, in this article, cash dividends are used as a control variable to control the impact of different company sizes (Belden et al., 2005).
Audit quality (Audit)
Companies with high agency costs often choose external auditors with a good reputation to reduce their agency costs. The audit of the financial report of a listed company represented by an audit firm, as a reflection of the company’s performance and financial report’s true degree, is not only affected by the agency cost between shareholders and management, but the agency cost of debt and the agency cost of control rights, but also audit has a restraining effect on the earnings management behavior of listed companies. Therefore, the audit represented by the selection of the accounting firm is set as a control variable. The proportion of independent directors to the board of directors (Indboard)
Huang et al. (2019) found through empirical research that the separation of the two positions of chairman and general manager has an inhibitory effect on the private benefits of control. The proportion of independent directors is negatively correlated with the private benefits of control, but it is not significant. At the same time, the management equity incentive has an intermediary effect in the process of the influence of the combination of two positions on the private benefits of control. Therefore, this paper will set the proportion of independent directors as a control variable. The variable names and symbols are shown in Table 2.
| Table 2 The Names and Symbols of Variables | |||
| Variable | Name | Meaning | Symbol |
| Explained variable | Earnings management | Earnings management level | EM |
| Explanatory variables | Equity agency cost | Turnover rate of total assets | Ac equity |
| Debt agency cost | Financing costs | Ac debt | |
| Agency cost of control | Amount of related transaction | Ac control | |
| Control variable | Tobin’s Q | TobinQ | |
| Cash dividend | Dividend | ||
| Audit quality | Audit | ||
| Proportion of independent directors | Ind board | ||
| Company Size | Size | ||
| Return on Assets | ROA | ||
| Return on Equity | ROE | ||
| Growth | Growth | ||
| Book-to-market ratio | BM | ||
| Age of the company | Age | ||
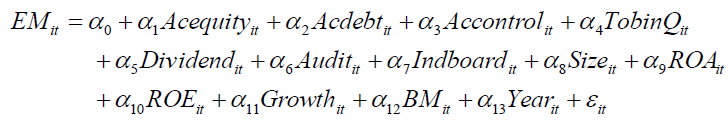
Model
According to Table 2, the explained variable of the model is the degree of earnings management. The explanatory variables are equity agency cost, debt agency cost and control agency cost. Therefore, the relationship model between agency cost and earnings management is established as follows:
Data Collection
The data in this article comes from the CSMAR database and the CCER database, and a total of 110 listed companies in the textile industry on the Shanghai and Shenzhen stock markets from 2011 to 2020 are selected as the total research sample.
The reason for choosing the sample from 2011 to 2020 is that in 2010, China issued three guidelines matching the Basic Norms for Enterprise Internal Control (2009), marking the official launch of the supervision and management of enterprise internal control information disclosure in the Chinese market. The Basic Norms for Internal Control of Enterprises (2009), taking the five elements of internal control as clues, clarifies the disclosure norms of listed companies in terms of the five elements, and requires external audit institutions to audit the implementation and effect of internal control of enterprises. In 2010, Chinese enterprises formally implemented this standard. Therefore, the listed companies in the textile industry from the first year (2011) to 2020 after the implementation of this standard are selected as the research samples.
To avoid the interference of abnormal data, the data were screened as follows:
1. Listed companies that have lost money for two consecutive years and whose shares have been subject to special treatment (ST), and listed companies that have lost money for three consecutive years and whose shares have been warned of delisting risk, are eliminated. On April 22, 1998, the Shanghai and Shenzhen Stock Exchanges of China announced that, according to the stock listing rules implemented in 1998, they would make special treatment for the stock trading of listed companies with abnormal financial or other conditions. There are two cases when the financial status or other conditions are abnormal: a. after the audit of the listed company, the net profit of two consecutive fiscal years is negative; b. the audited net assets per share of the listed company in the latest accounting year are lower than the par value of the shares. During the period when the stock trading of a listed company is subject to special treatment, its stock trading must follow three rules: a. the daily rise and fall of the stock quotation is limited to 5%; b. the name of the stock shall be changed to the original name of the stock plus "ST"; c. the interim report of a listed company must be audited.
2. Exclude companies with incomplete data;
3. The data were processed with Winsorize by 1%.
Through the above processing, a total of 5200 data samples from 52 textile companies were finally obtained.
Analysis Method
Eviews 10.0 software was used for statistics and analysis of the data.
Results and Discussion
Descriptive Statistics
The descriptive statistics of each study variable are shown in Table 3.
| Table 3 Descriptive Statistics Results | |||||
| Variable | Mean | Median | Max | Min | Std.D |
| Acequity | -0.722 | -0.625 | -0.001 | -14.628 | 0.652 |
| Acdebt | 0.0723 | 0.0541 | 0.959 | 7.253 | 0.089 |
| Accontrol | 2.313 | 1.4258 | 5.255 | 0.000 | 1.156 |
| TobinQ | 2.096 | 1.625 | 43.629 | 0.011 | 2.014 |
| Dividend | 1.515 | 3.153 | 5.256 | 0.000 | 1.354 |
| Audit | 0.463 | 0.000 | 2.000 | 0.000 | 0.620 |
| Indboard | 0.352 | 0.333 | 1.000 | 0.000 | 0.067 |
| Size | 98.625 | 95.320 | 152.032 | 10.326 | 3.252 |
| ROA | 9.663 | 9.625 | 12.525 | 6.325 | 2.325 |
| ROE | 5.625 | 5.584 | 8.652 | 3.326 | 0.857 |
| Growth | 6.663 | 6.256 | 9.635 | 2.553 | 0.242 |
| BM | 7.625 | 6.997 | 10.326 | 3.625 | 0.263 |
| Age | 18.626 | 17.521 | 25.322 | 11.025 | 0.525 |
Multicollinearity Test
The correlation between explanatory variables is tested to determine whether there is a problem of multicollinearity that affects the results of the study. The correlation coefficients between explanatory variables and control variables are shown in Table 4.
| Table 4 Pearson Correlation Coefficients between Explanatory Variables and Control Variables | |||||||||||||
| Variable | Acequity | Acdebt | Accontrol | TobinQ | Dividend | Audit | Indboard | Size | ROA | ROE | Growth | BM | Age |
| Acequity | 1 | ||||||||||||
| Acdebt | 0.004 | 1 | |||||||||||
| Accontrol | 0.303 | -0.002 | 1 | ||||||||||
| TobinQ | -0.036 | 0.105 | 0.002 | 1 | |||||||||
| Dividend | 0.052 | 0.116 | -0.003 | 0.008 | 1 | ||||||||
| Audit | 0.016 | 0.024 | 0.015 | -0.066 | 0.056 | 1 | |||||||
| Indboard | 0 | -0.027 | 0.007 | 0.008 | 0 | 0.007 | 1 | ||||||
| Size | 0.005 | 0.014 | 0.002 | 0.006 | 0.102 | 0.01 | 0.021 | 1 | |||||
| ROA | 0.023 | 0.001 | 0.01 | 0.035 | 0.014 | 0.007 | 0.016 | 0.1 | 1 | ||||
| ROE | 0.062 | 0.066 | 0.037 | 0.011 | 0.033 | 0.032 | 0.001 | 0.02 | 0.01 | 1 | |||
| Growth | 0.017 | -0.099 | 0.023 | 0.009 | -0.02 | -0.06 | -0.02 | -0.02 | 0.01 | 0.034 | 1 | ||
| BM | -0.057 | -0.213 | -0.292 | -0.014 | 0.019 | 0.022 | 0.011 | 0.04 | 0.03 | -0.03 | 0.001 | 1 | |
| Age | 0.033 | 0.018 | 0.057 | 0.085 | 0.022 | 0.016 | 0.015 | 0.04 | 0.02 | 0.01 | 0.055 | 0.002 | 1 |
It can be seen from Table 4 that, except for the pearson correlation coefficient between Turnover and Rtrans, which is 0.303, the correlation coefficients of all other variables are very small. There is no significant multicollinearity among the study variables. Therefore, it can be inferred that there is no serious multicollinearity between the research variables set in this paper, thus ensuring the validity of the conclusions of the empirical research model.
Heteroscedasticity Test
When the random error term of the regression result has heteroscedasticity, its variance often has a certain relationship with the main research variables. At this time, the least square method (OLS) is used to estimate the model parameters, which may cause the parameter estimates to be unbiased. But if not effective, the significance test of the parameter will lose its meaning, leading to the failure of prediction and so on.
Therefore, this paper uses Eviews to perform the White heteroscedasticity test, and judges whether to reject the null hypothesis of no heteroscedasticity by the concomitant probability. As shown in Table 5, the associated probability of the test is 0.2068, and the null hypothesis cannot be rejected, that is, the model is considered to have no heteroscedasticity, indicating that the parameter estimation in the regression model is valid.
| Table 5 White Heteroscedasticity Test | |||
| F-statistic | 1.024 | Prob. F(24,186) | 0.207 |
| Obs*R-squared | 45.625 | Prob. Chi-Square(24) | 0.207 |
Regression Results and Analysis
The Eviews regression results of the multiple linear regression model are shown in Table 6.
| Table 6 Regression Results | ||||
| Variable | Coefficient | Std.Error | T-Statistic | Prob. |
| Acequity | 0.019 | 0.005 | 2.670 | 0.000 |
| Acdebt | -1.060 | 1.520 | -0.463 | 0.227 |
| Accontrol | 0.002 | 0.001 | 2.664 | 0.000 |
| TobinQ | -0.015 | 0.001 | -8.652 | 0.000 |
| Dividend | -1.062 | 0.205 | -2.659 | 0.000 |
| Audit | 0.002 | 0.007 | 0.170 | 0.690 |
| Indboard | 0.103 | 0.052 | 0.527 | 0.204 |
| Size | 0.125 | 0.003 | 0.515 | 0.104 |
| ROA | 0.135 | 0.001 | 0.432 | 0.203 |
| ROE | 0.025 | 0.004 | 0.326 | 0.224 |
| Growth | 0.526 | 0.007 | 0.521 | 0.625 |
| BM | 0.036 | 0.020 | 0.356 | 0.103 |
| Age | 0.051 | 0.035 | 0.166 | 0.085 |
| Constant | 0.000 | 0.011 | -0.004 | 0.670 |
| R-squared | 0.127 | Mean dependent var | 0.106 | |
| Adjusted R-squared | 0.110 | S.D. dependent var | 0.170 | |
| S.E. of regression | 0.236 | Akaike info criterion | -0.010 | |
| Sum squared resid | 116.859 | Schwarz criterion | 0.036 | |
| Log likelihood | 31.586 | Hannan-Quinn criter. | 0.001 | |
| F-statistic | 14.822 | Durbin-Watson stat | 1.469 | |
| Prob(F-statistic) | 0.000 | |||
The R2 of the regression model is 0.127, and the adjusted R2 is 0.110. Although the goodness of fit of the model is not great, according to econometric theory, when the number of samples is greater than 30, it is considered a large sample. The goodness of fit can be low, but at the same time it must be matched with the F test of the regression equation. In this study, the model F value is 14.822, and the significance probability p-value is 0.000. This shows that the overall regression model has passed the significance test, which also shows that the overall linear relationship of the model is significant.
The relationship between equity agency costs and the degree of earnings management of listed companies: Acequity is significantly negative with the degree of earnings management at a significant level of 1%. The total asset turnover rate can reflect the efficiency of the manager’s use of the company’s assets. The higher the total asset turnover rate, it means that the management uses most of the assets for productive purposes. The agency cost between shareholders and management is lower, and the degree of earnings management is also lower (Watts & Zimmerman, 1986; Wiedman& Marquardt, 2005). According to the relationship between the related indicators of equity agency cost and the degree of earnings management, it can be considered that the agency cost of equity is positively correlated with the degree of earnings management.
The relationship between debt agency costs and the degree of earnings management: There is no correlation between Acdebt and the degree of earnings management. This is mainly because China’s bond market is underdeveloped and creditors are in a disadvantaged position. They cannot effectively restrict debtors through debt contract clauses. Shareholders hope to reduce financing costs or reduce financing constraints by demonstrating good report performance through earnings management, while creditors cannot demand corresponding interest by identifying the true performance of the company. Therefore, in the empirical study, the financing cost does not affect the earnings management behavior of listed companies (Qin & Liu, 2013). It can be considered that due to the underdeveloped bond market in China, creditors cannot form effective constraints on debtors through debt contract clauses. The degree of earnings management is not related to the cost of debt agency.
The relationship between the agency cost of control and the degree of earnings management: Accontrol is positively correlated with the degree of earnings management at a significant level of 1%. The larger the controlling shareholder’s occupation of the company’s funds through connected transactions, the higher the agency cost of control rights. In order to conceal the negative impact of profit encroachment on the company, controlling shareholders tend to influence financial reporting information through earnings management. According to the correlation between the relevant indicators of the agency cost of control and the degree of earnings management, it can be known that the controlling shareholder will embezzle the assets of the listed company through related transactions and transfer pricing in commodity sales. The more serious the agency conflict between the controlling shareholder and the small and medium shareholders, the higher the agency cost, and the more likely it is to conceal the company’s interest embezzlement behavior through earnings management (Song & Wang, 2015; Dechow et al., 1995). That is, the agency cost of control is positively related to the degree of earnings management.
The relationship between Tobin’s Q value and the degree of earnings management: at a significant level of 1%, there is a significant negative correlation with the degree of earnings management. This shows that the greater the Tobin’s Q value, the lower the degree of earnings management. The larger the Tobin’s Q value, the better the investment value, performance and operating performance of the company, the more the interests of shareholders and management tend to be consistent, and the lower the cost of equity agency (Fernandes & Ferreira, 2007; Hapsoro & Bahantwelu, 2020). Controlling shareholders and small and medium shareholders are also aligned in the interests of maximizing the company’s market value, and the lower the agency cost of control rights. It can be considered that agency costs are positively related to the degree of earnings management.
The relationship between the level of cash dividends and the level of earnings management: Dividend is negatively correlated with the level of earnings management at a significant level of 1%. The cash dividend allows the interests of small and medium shareholders to be protected to a certain extent (Baber et al., 2006). At the same time, cash dividends also reduce the free cash flow of listed companies, so the higher the cash dividends. This shows that the interests of internal and external shareholders tend to be more consistent, and the need for earnings management is also reduced. It has an enlightenment to the financing of small and medium-sized enterprises. Banks can provide small amounts of financing to local SMEs through loans at attractive interest rates to balance the interests of internal and external shareholders with earnings management.
The relationship between Audit and the level of earnings management: Audit has a relatively low correlation with the level of earnings management. This shows that the audit represented by the audit unit cannot effectively identify the earnings management behavior of listed companies (Klein, 2002; Luo & Li, 2019). This also reflects the non-independence of the audit process of certified public accountants in the Chinese accounting service market, and the inability to produce audit reports based on the true financial information of listed companies.
The relationship between independent directors and the degree of earnings management: The significant level of correlation between the proportion of independent directors and the degree of earnings management is relatively low. This shows that the establishment of independent directors cannot effectively restrain the company’s earnings management behavior. The role of independent directors is subject to controlling shareholders (Klein, 2002). The right to choose and decide on the candidates for independent directors lies with the controlling shareholder (Beuselinck & Deloof, 2014). This also reflects that although the China Securities Regulatory Commission and other departments have formulated independent directors and other related governance norms and legal regulations, the implementation of these provisions does not achieve the expected purpose.
Robustness Test
Since the measurement methods of earnings management are relatively consistent, this paper uses surrogate agency costs as a robustness test. The empirical results are tested by replacing the agency cost variable in the model with total asset turnover (AT). According to Yang Yufeng and Luo Wei, the total asset turnover rate is used as a measure of implicit agency cost. The higher the total asset turnover rate, the lower the agency cost. According to the results in Table 7, the estimated coefficient of AT is significantly positive at the 1% level, which still shows that agency costs and earnings management are positively correlated. The results of the robustness test are consistent with the results of the empirical analysis.
| Table 7 Robustness Test | ||||
| Variable | Coefficient | Std.Error | T-Statistic | Prob. |
| Acequity | 0.021 | 0.006 | 2.658 | 0.000 |
| Acdebt | -1.058 | 1.521 | -0.474 | 0.226 |
| Accontrol | 0.004 | 0.002 | 2.652 | 0.000 |
| TobinQ | -0.013 | 0.002 | -8.664 | 0.000 |
| Dividend | -1.060 | 0.206 | -2.670 | 0.000 |
| Audit | 0.004 | 0.008 | 0.158 | 0.689 |
| Indboard | 0.105 | 0.053 | 0.515 | 0.203 |
| Size | 0.127 | 0.004 | 0.503 | 0.103 |
| ROA | 0.137 | 0.002 | 0.420 | 0.203 |
| ROE | 0.027 | 0.005 | 0.314 | 0.223 |
| Growth | 0.528 | 0.008 | 0.510 | 0.625 |
| BM | 0.038 | 0.021 | 0.344 | 0.102 |
| Age | 0.054 | 0.036 | 0.154 | 0.085 |
| Constant | -0.001 | 0.012 | -0.015 | 0.669 |
| R-squared | 0.129 | Mean dependent var | 0.106 | |
| Adjusted R-squared | 0.112 | S.D. dependent var | 0.169 | |
| S.E. of regression | 0.238 | Akaike info criterion | -0.012 | |
| Sum squared resid | 114.261 | Schwarz criterion | 0.036 | |
| Log likelihood | 29.588 | Hannan-Quinn criter. | 0.001 | |
| F-statistic | 15.824 | Durbin-Watson stat | 1.386 | |
| Prob(F-statistic) | 0.000 | |||
Endogenetic Test
Considering that earnings management may also affect the disclosure of internal control information and agency costs, resulting in data analysis errors. In this section, the independent variable after a period of delay and the control variable and dependent variable after a period of delay are used for regression analysis to eliminate the impact of endogenous panel data. The results are shown in Table 8. Although the results of endogenous test are slightly different from those in Table 6, except for the sign changes of individual control variables, there is little difference in the sign and significance of other variables. This also verifies that the above conclusions have not changed substantially.
| Table 8 Endogenous Test Results | ||||
| Variable | Coefficient | Std.Error | T-Statistic | Prob. |
| Acequity | 0.021 | 0.005 | 2.525 | 0.000 |
| Acdebt | -0.995 | 1.343 | -0.441 | 0.205 |
| Accontrol | 0.003 | 0.001 | 2.227 | -0.002 |
| TobinQ | -0.033 | 0.003 | -6.553 | 0.000 |
| Dividend | 1.106 | 0.185 | 2.363 | 0.000 |
| Audit | 0.005 | 0.007 | 0.133 | 0.525 |
| Indboard | 0.089 | 0.053 | 0.443 | 0.107 |
| Size | 0.197 | 0.004 | 0.506 | 0.113 |
| ROA | 0.206 | 0.004 | 0.406 | 0.332 |
| ROE | 0.045 | 0.002 | 0.226 | 0.205 |
| Growth | -0.345 | 0.006 | -0.447 | 0.560 |
| BM | 0.068 | 0.034 | 0.403 | 0.124 |
| Age | 0.035 | 0.049 | 0.187 | 0.089 |
| Constant | 0.002 | 0.022 | 0.021 | 0.528 |
| R-squared | 0.202 | Mean dependent var | 0.124 | |
| Adjusted R-squared | 0.106 | S.D. dependent var | 0.106 | |
| S.E. of regression | 0.202 | Akaike info criterion | -0.104 | |
| Sum squared resid | 112.205 | Schwarz criterion | 0.022 | |
| Log likelihood | 27.335 | Hannan-Quinn criter. | 0.001 | |
| F-statistic | 13.626 | Durbin-Watson stat | 1.225 | |
| Prob(F-statistic) | 0.000 | |||
Conclusion
According to the viewpoint of new institutional economics, the organizational form of the company system can reduce transaction costs. However, while reducing transaction costs, the separation of ownership and control in the form of corporate organization leads to the problem of principal-agent. The enterprise's earnings management behavior reduces the reliability of accounting information. This makes the earnings information in financial reports unable to objectively and fairly reflect the company's operating performance and the company's true profitability, and even mislead investors' investment decisions. In the actual operation and management process of an enterprise, the principal-agent conflict and the company's earnings management behavior are related. However, in the research, the measurement of agency cost and the choice of agency variables are different, and the conclusions on the relationship between agency cost and earnings management are also different.
On this basis, this research explores the relationship between agency costs and earnings management. According to the results of the empirical research, the multiple regression model constructed in this paper has a good explanatory power for the problems raised as a whole.
The equity agency cost is positively correlated with the degree of earnings management, indicating that the higher the degree of potential principal-agent conflicts, the more complete and complete the corporate governance mechanism will be. The theoretical analysis that a sound corporate governance structure will reduce the space for agents to implement earnings management is not established in listed companies in the textile industry in China. This also reflects that the imperfect governance structure of listed companies in the textile industry in China makes it effective to restrict agency conflicts. Insufficient sex. The agency costs between shareholders and management are not mainly reflected in management fees. The management’s shareholding does not provide effective incentives for the management. Controlling the level of cash flow at the disposal of management can help alleviate the problem of agency conflicts. The credit agency cost is basically irrelevant to the degree of earnings management, indicating that debt governance cannot form an effective constraint on textile companies. In the market economy conditions, creditors and enterprises are at a disadvantaged position in the game of interest. It can be considered that due to the underdeveloped bond market in China, creditors cannot form effective constraints on debtors through debt contract clauses. The agency cost of control is significantly positively correlated with the degree of earnings management. Controlling shareholders of listed companies in China’s textile industry have encroached on the interests of listed companies through related transactions, which is relatively common and serious. This shows that the agency conflict between controlling shareholders and small and medium shareholders directly affects the company’s earnings management behavior. Therefore, during the audit process, it is necessary to consider the transfer of profits through related transactions or transfer pricing.
It can be concluded from the relationship between the control variables and the degree of earnings management that the issuance of cash dividends is conducive to the protection of the interests of small and medium shareholders, and strengthening the requirements for cash dividends of listed companies in the textile industry in the securities market can effectively protect external investors. The correlation between audit and independent directors and earnings management did not meet theoretical expectations and policy objectives. The audited financial report of the firm did not fully reflect the true financial information. The independent directors on the board of directors have not played a good supervisory role either. For companies in other industries, cash dividends work the same way. This makes the conclusions of this study universally applicable.
In general, the classification of agency costs explains the divergence in previous theoretical and empirical research. Combined with the situation of listed companies in China’s textile industry, selecting appropriate agency cost research variables, the empirical results well reflect the manifestations of agency conflicts in listed companies in China’s textile industry. Through research, it is concluded that among listed companies in China’s textile industry, the more serious the problem of agency conflict, the higher the agency cost and the higher the degree of earnings management.
References
Anderson, R.C., Mansi, S.A., & Reeb, D.M. (2003). Founding Family Ownership and the Agency Cost of Debt. Journal of Financial Economics, 68, 263-285.
Indexed at, Google Scholar, Cross Ref
Baber, W.R., Chen, S., Kang, & S.H. (2006). Stock price reaction to evidence of earnings management: Implications for supplementary financial disclosure. Review of Accounting Studies, 11(1), 5-19.
Indexed at, Google Scholar, Cross Ref
Belden, L.K. et al. (2005). Glucocorticosteroid hormone treatment of larval treefrogs increases infection by Alaria sp. trematode cercariae. Journal of Parasitology.
Indexed at, Google Scholar, Cross Ref
Bendell, J., Sutherland, N., & Little, R. (2017). Beyond unsustainable leadership: critical social theory for sustainable leadership. Sustainability Accounting, Management and Policy Journal.
Indexed at, Google Scholar, Cross Ref
Beuselinck, C., & Deloof, M. (2014). Earnings Management in Business Groups: Tax Incentives or Expropriation Concealment?. The International Journal of Accounting, 49(1), 27-52.
Indexed at, Google Scholar, Cross Ref
Bushman, R.M., & Smith, A.J. (2001). Finance accounting information and corporate governance. Journal of Accounting and Economics, 32, 237-33.
Indexed at, Google Scholar, Cross Ref
De Anglo, J., Cole, R., & Lin, J. (2000). Agency Costs and Ownership Structure. Journal of Finance, 55(1), 81-106.
Indexed at, Google Scholar, Cross Ref
Dechow, P.M., Sloan, R.G., & Sweeney, A.P. (1995). Detecting earnings management. Accounting Review, 13(6), 193-225.
Indexed at, Google Scholar, Cross Ref
Deng, L., Zhang, Z.Y., Li, H.S., et al. (2008). Research on the Role of Banks in the Corporate Control Market-Evidence from Chinese Listed Companies. Financial Research, 1, 88-99.
Fernandes, N.G., & Ferreira, M.A. (2007). The Evolution of Earnings Management and Firm Valuation: A Cross-Country Analysis. SSRN Electronic Journal.
Indexed at, Google Scholar, Cross Ref
Hapsoro, D., & Bahantwelu, M.I. (2020). Does earning management mediate the effect of capital structure on company value? Journal Ekonomi Dan Bisnis, 23(1), 53-68.
Indexed at, Google Scholar, Cross Ref
Huang, K., Wan, Q.Q, & Zhou, J. (2019). Research on the Correlation between the Characteristics of the Board of Directors of Small and Medium-sized Listed Companies and the Private Benefits of Control. Journal of Wuhan University of Technology (Social Science Edition), 6, 108-115.
Jensen, M.C., & Meckling, W.H. (1976). Theory of the firm: Managerial behavior, agency costs and ownership structure. Journal of Financial Economics, 3(4), 305-360.
Indexed at, Google Scholar, Cross Ref
Jensen, M.C. (1986). Agency cost of free cash flow, corporate finance, and takeovers. Corporate Finance, and Takeovers. American Economic Review, 76(2), 231-253.
Indexed at, Google Scholar, Cross Ref
Klein, A. (2002). Audit committee, board of director characteristics, and earnings management. Journal of Accounting and Economics, 33(3), 375-400.
Indexed at, Google Scholar, Cross Ref
Lang, L., & Litzenberger, R.H. (1989). Dividend announcements: Cash flow signalling vs. free cash flow hypothesis?. Journal of Financial Economics, 24(1), 181-191.
Indexed at, Google Scholar, Cross Ref
Lin, S., Wei, M.H. (2000). Profit Management in the Process of China’s A-Share Issuing Company’s Initial Public Offering. China Accounting and Finance Research, 2(2), 87-130.
Lu, J.Q. (1999). An Empirical Study on Earnings Management of China’s Loss Listed Companies. Accounting Research, 9, 25-35.
Indexed at, Google Scholar, Cross Ref
Luo, W.B., & Li, M.X. (2019). ST Enterprise Investment Income Earnings Management and Audit Opinions Based on the Moderating Effect of Abnormal Audit Fees. Friends of Accounting, 13, 19-25.
Meng, Y., & Zhou, H. (2018). Research on the Impact of Financial Links on Earnings Management of Listed Companies - The Mediating Role of Agency Costs. Journal of Guizhou University of Finance and Economics, 1, 47-56.
Qiang, G.L., Li, Y., Zhang, Z.W. (2017). The Paradox of the Cash Dividend Policy of Listed Companies on the Growth Enterprise Market - An Explanation Based on the Theory of Dividend Tunneling. China Economic Issues, (02), 68-79.
Qin, S.S., Liu, Z.S. (2013). The relationship between earnings management and agency costs of listed companies in Anhui. China Securities Futures, 12(9), 14.
Singh, M., & Davidson, W.N. (2003). Agency Cost Ownership Structure and Corporate Governance Mechanisms. Journal of Banking& Finance, 27(5), 793-816.
Song, C.J., & Wang, Y.J. (2015). Agency Cost and Accrued Real Earnings Management-An Empirical Study Based on the Perspective of Property Rights. Journal of Nanjing University of Finance and Economics, (03), 49-63.
Teoh, S.H., Welch, I., & Wong, T.J. (1998). Earnings Management and the Long-Run Market Performance of Initial Public Offerings. Journal of Financial Economics, 50(1), 63-99.
Indexed at, Google Scholar, Cross Ref
Watts, R., & Zimmerman, J. (1986). Positive Accounting Theory. Prentice Hall Englewood Cliffs (NJ), 388.
Weigand, R.A, & Baker, H.K. (2011). Changing perspectives on distribution policy: The evolution from dividends to share repurchase. Managerial Finance, 35(6), 479-492.
Indexed at, Google Scholar, Cross Ref
Wiedman, C., & Marquardt, C. (2005). Earnings management through transaction structuring: contigent convertible debt and diluted earnings per share. Journal of Accounting Research, 43(2), 205-243.
Indexed at, Google Scholar, Cross Ref
Received: 17-Nov-2022, Manuscript No. AAFSJ-22-12901; Editor assigned: 19-Nov-2022, PreQC No. AAFSJ-22-12901(PQ); Reviewed: 03-Dec-2022, QC No. AAFSJ-22-12901; Revised: 12-Jan-2023, Manuscript No. AAFSJ-22-12901(R); Published: 20-Jan-2023