Research Article: 2021 Vol: 24 Issue: 2S
AHP structure for determining sustainable performance of Indonesian seafood supply chain from stakeholders perspective
Muslimin, Tadulako University
Nudiatulhuda Mangun, Tadulako University
Elimawaty Rombe, Tadulako University
Edhy Taqwa, Tadulako University
Maskuri Sutomo, Tadulako University
Suryadi Hadi, Tadulako University
Citation Information: Muslimin, Mangun, N., Rombe, E., Taqwa, E., Sutomo, M., & Hadi, S. (2021). AHP structure for determining sustainable performance of Indonesian seafood supply chain from stakeholders perspective. Journal of Management Information and Decision Sciences, 24(S2), 1-10.
Abstract
Purpose: This paper aims to investigate and develop a framework of sustainable performance of supply chain in Indonesian fishery sector.
Design/methodology/approach: AHP was used to evaluate sustainable performance of fish supply chain. The criteria were compared through three main aspects include economic, social and environment. While the sub-criteria applied in this study were 15 items.
Findings: The results of this study indicate that environmental aspects, apart from social and economic, are the main priorities that must be considered in maintaining the sustainability of fishery supply chain. Environmental damage will affect the image of business destinations and have very long negative implications for fishery sector.
Research Limitation/Implication: This study uses a very small number of respondents, but respondents are believed to be able to provide useful information to determine which priorities should be focused on sustainable supply chain management in fishery. The limitation of this research is that it is hoped that in the future it can include more respondents with different analysis methods. This research can be used by policy makers in formulating strategies for implementing sustainable fishery in small islands which are also noted as a national park, especially in the Indonesian context.
Originality/Value: The study used data obtained from ten of actor in fishery supply chain consisting of fishermen, fish collectors, transporter and retailers.
Keywords
AHP; Sustainable performance; Supply chain; Fishery sector.
Introduction
Indonesia, the largest archipelago country in the world, has 5.8 million km2 of manageable sea and a huge potential and diversity of aquatic and fishery resources (Cribb & Ford, 2009). It is a major financial growth asset that can theoretically be used to improve the community's well-being (Munizu et al., 2019). In addition, these marine and fishery items may be used as a food supply to fulfill the needs of the population for proteins. The increase in the production of fisheries is also expected to lead to national food security. Fisheries shall contribute to the mechanism of implementing the security of food (Sun & Che, 2012). In Indonesia, fish protein and nutrient sources play a very important role (Setiadi et al., 2018). After the Government pays a great deal of attention, Indonesia hopes to become a big player in this region (Kresna et al., 2017). The other focus that stands out is the decrease in the volume of illegal fishing in the waters of Indonesia (Kresna et al., 2017). This has not received much recognition in the past. Indonesia's fishing industry is also stagnating behind a number of ASEAN countries, despite Indonesia is acknowledged as an exporting country for seafood. Indonesia faces a variety of obstacles to improving the productivity of the fishing industry (Karningsih et al., 2018). The barriers include limited fishing infrastructure, supply chain and still-weak logistics, quality of fish, policies that are not yet balanced (Rombe et al., 2018).
There are many problems surrounding the introduction of a very broad supply chain for seafood, and alternatives are pursued as quickly as possible. The development of a reliable supply chain for seafood requires a strong infrastructure (Mubaraq et al., 2019). Although the number of fishing ports in Indonesia is very significant, the support facilities are insufficient, for example in storing fish in cold storage (Rombe et al., 2018). The number of fishing vessels in Indonesia is also high, but their capability is still limited. Fishermen use a modest power on average(Tran et al., 2017). The inaccessible cold storage facilities will reduce the efficiency of the fish captured. Marine fishery products are highly dependent on this cold storage facility to preserve the freshness that will result in the consistency of seafood products (Kresna et al., 2017). Lack of storage will affect the quality of seafood products.
Rombe et al. (2018) high awareness of the benefits of implementing seafood supply chain management is not only owned by the downstream part but also in the upstream section. Each entity must have expertise in seafood supply chain management (Widyaningrum & Masruroh, 2012). This expertise can be obtained from training provided both from the government and from non-governmental organizations. Training activities will facilitate stakeholders in the seafood supply chain to gain knowledge about the application of cold chain systems and cold chain logistics systems (Khan et al., 2018; Mubaraq et al., 2019). The results of this training will be able to add to the skills of the participants who are also seafood supply chain stakeholders. This holistic and periodic activity will support the sustainability of the seafood supply chain.
This study aims to evaluate the sustainability performance of seafood in several entities involved in the supply chain. The results obtained in this study are expected to have implications for the development of supply chain sustainability studies in the topic of seafood. The output of this research is expected to provide significant managerial implications in the development of seafood supply chain management. This research was prepared by providing an overview of the research background, literature review, methods, results and discussions, and conclusions. This research was conducted in Indonesia in which has a large area of water. This country has focused the fisheries sector as one of the main sectors that has the potential to contribute to the country's foreign exchange. To ensure that the results of this fishery sector can be continuously maintained, evaluating the performance of seafood sustainability is very important. The results of the evaluation will provide better input for planning in this sector. An explanation of the structure of this study can be seen in the following explanation.
Literature Review
Seafood Supply Chain Management
Supply chain management operations cannot be isolated from information technology as a network collaboration and information exchange mechanism, such that efficiency can be accomplished (Huo et al., 2014; Zhou et al., 2014). The use of IT will create profit by reducing the expense of communication and information processing ( Lee et al., 2000; Koço?lu et al., 2011). The fish supply chains are not much different operationally from the supply chains of other commodities. Product characteristics distinguish them because they involve a series of processes or activities in the waters to catch fish and fish products into the hands of consumers (Al-Busaidi et al., 2016). Freshness of fish reaching the end consumer should be a priority in supply chain management. Activities in seafood supply chain management involve suppliers who are active in the upstream sector and consumer activities in the downstream (Mubaraq et al., 2019). The complexity of activities in the fish supply chain is quite high. The fish supply chain consists of fishermen, collectors, traders, processing industries and consumers. Integration between activities in the fish supply chain is supported by high trust from all parties involved (Rombe et al., 2018). The additional benefit of each entity is derived through the transparency of exchanging knowledge on the supply chain of fish resources (Karlsen et al., 2011). The correct supply chain management approach would control the supply chain's reliability and profitability in order to decrease surplus inventory, improve output and reduce costs (Parenreng et al., 2016).
The Scope of Sustainable Supply Chain Management (SSCM)
The operations of the company shall be incorporated with other activities of the following organizations (Morana, 2013). It is no doubt that business will thrive on its own has been discouraged (Markley & Davis, 2007). Supply chain management is a system that combines the delivery of goods and knowledge from suppliers to end customers (Dubey et al., 2017). Businesses must operate their business with a stronger emphasis on ensuring the continuity of collaboration with partners and customers (Shaharudin et al., 2015). The introduction of a successful SCM, the organization would have great appreciation and profits from customers and business partners (Taticchi et al., 2013). Competitive advantage can be gained by efficiency, careful control of sourcing, logistics, commitment to the supply side and reduction of transport sector spending (Beske & Seuring, 2014).
The idea of sustainable supply chain management (SSCM) is a continuation of the previous concept of SCM. The key pillar of the SSCM is partnership between good individuals. From the onset, the idea of supply chain management has become an issue (Markley & Davis, 2007). Researchers argued that the proper implementation of SCM could improve the competitive advantage of the business (Jermsittiparsert et al., 2019). Sustaining a profitable mutual partnership are the main focus of actors in supply chain (Li et al., 2006). Continuity of this partnership would have an impact on enhancing efficiency and retaining a competitive edge built on confidence, not simply on adverse factors ( Trim & Lee, 2008; Raman et al., 2013). SSCM gives priority to long-term priorities, namely to enable all supply chain institutions to give priority to the social and environmental facets of running a corporation ( Svensson, 2007; Das, 2018; Gupta & Palsule-Desai, 2011; Seuring, 2011). If the principle of sustainability in supply chain management is introduced, the target organization will face difficulties in sustaining partnerships with vendors ( Wu & Pagell, 2011; Pagell et al., 2010).
Analytical Hierarchy Process (AHP)
The AHP approach has been helpful and easy to use and has helped overcome decision-making challenges (Yakovleva et al., 2012). As a method for policy makers to make it easy for them to prioritize alternatives, Saaty (1980) created AHP. The value of AHP implementation in the decision-making process is that it can hierarchically map issues. In situations where options are very small, AHP is very suitable for use and each alternative has a range of characteristics (Xu et al., 2007). The validity of the criterion and sub-criteria is evaluated and then compared with each other on the basis of the weight score (Vaidya & Kumar, 2006). Application of AHP can help assess the priority scale of priorities and the ultimate process of review (Vaidya & Kumar, 2006). The structure of the AHP consists of priorities, requirements, sub criteria and alternatives (Al Qubaisi et al., 2016; Rombe et al., 2018). Conducting problem structuring, deciding solutions, determining the value of each element is the initial step that can be done (Benítez et al., 2012). AHP equipment is one of the decision-making tools used in a hierarchical arrangement to solve a condition in a formal way that gives each variable a discretionary value to decide which variables are priority and powerful (Vaidya & Kumar, 2006). This study uses AHP to determine which priorities should be focused for the decision-making process in sustainable supply chain management in seafood.
Methodology
This section summarizes a number of important things related to the scope of research, questionnaire design, survey data, and evaluation models. This research uses a case study based on the seafood industry practices of fishermen, fish collectors, transporters and retailers participating in the supply chain of seafood in Indonesia context. They were interviewed under the new normal of outbreak COVID-19. This research questionnaire was designed based on nine pairwise comparison scale types to ask respondents how the scale of comparison between each statement. Table 1 describes the scale used on the questionnaire, namely 1-9 to obtain the relative pairwise weight (Saaty, 1980; 1994). This scale will produce the weight of each criterion calculated for each respondent involved in this study.
| Table 1 Pairwise Comparison Scale | |
| Intensity of significance | Definition |
| 1 | Equal importance of both elements |
| 3 | Weak importance of one element over another |
| 5 | Essential or strong importance of one element over another |
| 7 | Demonstrated importance of one element over another |
| 9 | Absolute importance of one element over another |
| 2,4,6,8 | Intermediate values between two adjacent judgments |
Elkington (1998), introduced three criteria include environmental, social and economy. In the meanwhile, a total of 15 metrics are the sub-criteria contrasted in this analysis. The sub-criteria of this study were adapted from previous studies (Ilbery & Maye, 2005; Halweil, 2008; Gagalyuk et al., 2010; Morana, 2013; Taticchi et al., 2013; Kobayashi et al., 2015; Gutiérrez & Morgan, 2017; Howson, 2020). There are abbreviated elements used in each of the criterion and sub-criteria for this analysis and can be seen in Table 2 below.
| Table 2 Criteria and Sub-Criteria of Sustainable Supply Chain Management (SSCM) in Seafood | |||
| Criteria | Environment | Social | Economy |
| Sub Criteria | Low Waste (LW) Biodiversity (BV) Energy Consumption (EC) Infrastructure (INF) Water Consumption (WC) |
Training (TR) Gender Diversity (GD) Community Complaints (CC) Community Development (CD) Labor Condition (LC) |
Total Sales (TS) Forward Logistics System (FLS) ROI (ROI) Business Stability (BS) Financial Resilience (FR) |
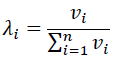
The research consisted of a selection of seafood entities supply chain including fishermen, fish collectors, transporters and retailers. The new standard health procedure performed this study such that the number of samples found was very small, consisting of 10 fishermen, 3 fish collectors, 2 transporters and 5 retailers. In order to prioritize the appropriate parameters and sub criteria, this analysis uses AHP to decide the weights of significance for each variable. Table 1 indicates that for relative pair-wise parameters analyses, nine ranges have been used. In terms of understanding particular weights, the level of value is shown. The analysis of criterion and sub-criteria allows to achieve the 3 criteria and 15 sub criteria in a pair ranking. The score derived from the set of the questionnaire creates a comparative weighted score that is then further processed into the matrix of evaluation. AHP is used to assess the weight of each component's value and to prioritize the related parameters and metrics. Each pair will be matched as seen in Table 1. A comparative rating of 3 criteria and 15 sub criteria derive the effects of the distribution of the questionnaire. Each component will be calculated based on their respective weights to get the eigenvalues so as to identify the geometric mean before the eigenvalues (λi) through the following equation:
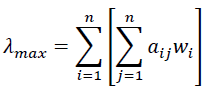
Then, the consistency ratio (CR) of the scoring weights will be determined by the following equation:
The following step is to measure the Consistency Index 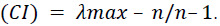 In addition, the subsequent stage, the consistency ratio was measured through
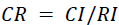 where, as seen in Table 3, the random consistency index is RI. If the outcomes of CR match the conditions, the outcome of the pairwise comparative weight can be used further. In order to prioritize the parameters and metrics appropriate for calculating sscm in seafood, the weight is derived from the geometric mean of each component and again the geometric mean of all the components. The goal of this analysis is to decide which factors should be prioritized in fostering the sustainability of seafood. The criteria and sub criteria for sustainable seafood management are then defined. Then, as defined in Table 3 below, this criterion and the matrix are measured with significance.
| Table 3 Random Consistency Index | |||||||||||||||
| n | 1 | 2 | 3 | 4 | 5 | 6 | 7 | 8 | 9 | 10 | 11 | 12 | 13 | 14 | 15 |
| RI | 0 | 0 | 0.58 | 0.90 | 1.12 | 1.24 | 1.32 | 1.41 | 1.45 | 1.49 | 1.51 | 1.54 | 1.56 | 1.57 | 1.59 |
Results and Discussion
On the basis of the results of the SSCM criteria for seafood, the priority for fish collectors, transporters and retailers is very high with respect to the economic criteria. Although, in the first place, fishermen prioritize the environmental requirements. Fishermen selected economy criteria as the second prioritize and social in the third prioritize. Fish collectors spotlight the economy criteria as the first prioritize, and environment and social criteria as the second and third consecutively. Transporters and retailers also highlight economy criteria as the first prioritize and social and environment criteria as the second and third prioritize respectively. Fishermen had the highest consistency ratio with 0.0707 and followed by retailers with 0.0565 as the second. Fish collectors had consistency ratio with 0.0468 as the third and transporters had the lowest consistency ratio with 0.0301 (Table 4 and Figure 1).
| Table 4 The Weight and Rank of SSCM in Seafood on Each Component | ||||
| Criteria of SSCM in Seafood Entities in Seafood SCM |
Environment | Social | Economy | Consistency Ratio |
| Fishermen | 0.751 (1) | 0.099 (3) | 0.150 (2) | 0.0707 |
| Fish Collectors | 0.166 (2) | 0.070 (3) | 0.764 (1) | 0.0468 |
| Transporters | 0.087 (3) | 0.415 (2) | 0.498 (1) | 0.0301 |
| Retailers | 0.074 (3) | 0.283 (2) | 0.643 (1) | 0.0565 |

Figure 1 Weight and Rank of SSCM in Seafood on Each Component
The results showed that fishermen assessed the sub criteria varied. On the environmental aspect, fishermen choose the infrastructure sub-criteria (INF) as the top ranking among the sub-criteria in this aspect with 0.3059 and low waste (LW) with 0.0548 had the lowest weight. Meanwhile, the fish collector sets the water consumption (WC) as the first rank with 0.2907 and low waste (LW) with 0.0970. For transporter, biodiversity (BV) had the highest weight with 0.3547 and low waste (LW) with 0.1029. In the group of retailers highlight that energy consumption (EC) had the highest weight with 0.2452 and infrastructure (INF) with 0.1186 had the lowest weight. For social criteria, the majority of stakeholder include fishermen, fish collectors and retailers spotlight community development (CD) had the highest weight with 0.2849, 0.2639, 0.2582 consecutively. However, the lowest weight had a different result among stakeholders, fishermen choosed training (TR) as the lowest weight with 0.1425 and fish collectors highlight labor condition (LC) with 0.1161. For retailers, gender diversity (GD) had the lowest weight with 0.1271. Turning to transporters, community complaints (CC) as the highest weight of sub criteria with 0.2795 and gender diversity (GD) with 0.1279 had the lowest weight. In the last criteria (economy), financial resilience (FR) had the highest weight with 0.2664 and business stability (BS) with 0.1405 had the lowest weight. In other stakeholder transporters, business stability (BS) had the highest weight with 0.2632 and forward logistics system (FLS) with 0.1468 had the highest weight. For fish collector and retailers, forward logitic system (FLS) had the highest weight with 0.2528 and 0.2477 respectively. For this group of stakeholders, total sales (TS) and business stability (BS) had the lowest weight with 0.1503 and 0.1378 consecutively. Therefore, it can be concluded that the majority of stakeholders spotlight the environment as the first criteria for sustainable supply chain management in seafood.
Conclusion
The results of this study indicate that sustainable supply chain management is needed in seafood to maintain the sustainability of this sector in the future. Fishery products are a sector that can provide employment and in the national context this sector can also contribute to increasing state income from fish exports. However, one of the challenges the sector faces is plastic waste that floats at sea and takes a long time to break down. This can threaten the ecosystem in the sea and its surroundings. This study designs three main points of sustainability, namely environmental, social and economic. The results of the analysis using AHP show that the environmental aspect is the first criterion, the second economic criterion and the third social criterion, which must be prioritized in sustainable supply chain management (SSCM) in seafood. Based on these results, it shows that stakeholders are aware that environmental aspects should be a priority to be maintained and maintained without neglecting social and economic aspects. If we look at the sub-criteria, this study shows that in the environmental aspect the views of stakeholders tend to vary in determining which sub-criteria are at the first level. In the social aspect, the sub-criteria chosen by stakeholders tend to lead to community development (CD). In the last aspect, namely economy, the forward logistics system (FLS) sub-criteria is a prominent choice in the view of stakeholders. Other sub-criteria that are also chosen by stakeholders are financial resilience (FR) and business sustainability (BS). This research still has many weaknesses, especially in terms of analytical methods. Therefore, further research is needed to generate generalizations about theories related to sustainability in seafood. Further research is also expected to find solutions to the problems faced in sustainable supply chain management (SSCM) in seafood.
Acknowledgement
This research was funded by Dana Dipa Pascasarjana 2020, Tadulako University, Palu-Indonesia.
References
- Al Qubaisi, A., Badri, M., Mohaidat, J., Al Dhaheri, H., Yang, G., Al Rashedi, A., & Greer, K. (2016). An analytic hierarchy process for school quality and inspection: Model development and application. International Journal of Educational Management, 30(3), 437-459.
- Al-Busaidi, M. A., Jukes, D. J., & Bose, S. (2016). Seafood safety and quality: An analysis of the supply chain in the Sultanate of Oman. Food Control, 59, 651-662.
- Benítez, J., Delgado-Galván, X., Izquierdo, J., & Pérez-García, R. (2012). Improving consistency in AHP decision-making processes. Applied Mathematics and Computation, 219(5), 2432-2441.
- Beske, P., & Seuring, S. (2014). Putting sustainability into supply chain management. Supply Chain Management, 19(3), 322-331.
- Cribb, R., & Ford, M. (2009). Indonesia beyond the wateras edge: Managing an archipelagic state. In Indonesia beyond the Wateras Edge: Managing an Archipelagic State.
- Das, D. (2018). International Journal of Production Research Sustainable supply chain management in Indian organisations: an empirical investigation Sustainable supply chain management in Indian organisations: an empirical investigation. International Journal of Production Research, 56(17), 5776-5794.
- Dubey, R., Gunasekaran, A., Papadopoulos, T., Childe, S. J., Shibin, K. T., & Wamba, S. F. (2017). Sustainable supply chain management: framework and further research directions. Journal of Cleaner Production, 142(2), 1119-1130.
- Elkington, J. (1998). Partnerships from cannibals with forks: The triple bottom line of 21st-century business. Environmental Quality Management, 8(1), 37-51.
- Gagalyuk, T., Hanf, J., & Herzlieb, C. (2010). Managing supply chains successfully: An empirical testing of success of supply chain networks in the German fish sector. Acta Agriculturae Scandinavica, Section C- Food Economics, 7, 139-150.
- Gupta, S., & Palsule-Desai, O. D. (2011). Sustainable supply chain management: Review and research opportunities. IIMB Management Review, 23(4), 234-245.
- Gutiérrez, A. T., & Morgan, S. (2017). Impediments to fisheries sustainability - Coordination between public and private fisheries governance systems. Ocean and Coastal Management, 135, 79-92.
- Halweil, B. (2008). Farming fish for the future. In Worldwatch Paper.
- Howson, P. (2020). Building trust and equity in marine conservation and fisheries supply chain management with blockchain. Marine Policy, 115, 103873.
- Huo, B., Qi, Y., Wang, Z., & Zhao, X. (2014). The impact of supply chain integration on firm performance: The moderating role of competitive strategy. Supply Chain Management, 19(4), 369-384.
- Ilbery, B., & Maye, D. (2005). Food supply chains and sustainability: Evidence from specialist food producers in the Scottish/English borders. Land Use Policy, 22(4), 331-344.
- Jermsittiparsert, K., Joemsittiprasert, W., & Phonwattana, S. (2019). Mediating role of sustainability capability in determining sustainable supply chain management in tourism industry of Thailand. International Journal of Supply Chain Management, 8(3), 47-58.
- Karlsen, K. M., Sørensen, C. F., Forås, F., & Olsen, P. (2011). Critical criteria when implementing electronic chain traceability in a fish supply chain. Food Control, 22(8), 1339-1347.
- Karningsih, P. D., Anggrahini, D., Kurniati, N., Suef, M., Fachrur, A. R., & Syahroni, N. (2018). Mapping Risks of Indonesian Tuna Supply Chain. Proceedings of IOP Conference Series: Materials Science and Engineering.
- Khan, S., Haleem, A., Khan, M. I., Abidi, M. H., & Al-Ahmari, A. (2018). Implementing traceability systems in specific supply chain management (SCM) through critical success factors (CSFs). Sustainability (Switzerland), 10(1), 204.
- Kobayashi, M., Msangi, S., Batka, M., Vannuccini, S., Dey, M. M., & Anderson, J. L. (2015). Fish to 2030: The Role and Opportunity for Aquaculture. Aquaculture Economics and Management, 19(3), 282-300.
- Koço?lu, I., Imamo?lu, S. Z., Ince, H., & Keskin, H. (2011). The effect of supply chain integration on information sharing: Enhancing the supply chain performance. Procedia - Social and Behavioral Sciences, 24, 1630-1649.
- Kresna, B. A., Seminar, K. B., & Marimin. (2017). Developing a traceability system for tuna supply chains. International Journal of Supply Chain Management, 6, 52-62.
- Lee, H. L., So, K. C., & Tang, C. S. (2000). Value of information sharing in a two-level supply chain. Management Science, 46(5), 597-743.
- Li, S., Ragu-Nathan, B., Ragu-Nathan, T. S., & Subba Rao, S. (2006). The impact of supply chain management practices on competitive advantage and organizational performance. Omega, 34(2), 107-124.
- Markley, M. J., & Davis, L. (2007). Exploring future competitive advantage through sustainable supply chains. International Journal of Physical Distribution and Logistics Management, 37(9), 763-774.
- Morana, J. (2014) Sustainable Supply Chain Management in Urban Logistics. In: Gonzalez-Feliu J., Semet F., Routhier JL. (eds) Sustainable Urban Logistics: Concepts, Methods and Information Systems. EcoProduction (Environmental Issues in Logistics and Manufacturing). Springer,
- Mubaraq, R., Rombe, E., Hadi, S., & Ardiansyah, R. (2019). Strategic Information System, Supply Chain Performance and Operational Performance in the Fishing Industry: A Conceptual Model. Proceedings of the 2019 International Conference on Organizational Innovation (ICOI 2019).
- Munizu, M., Pono, M., & Alam, S. (2019). The impact of information technology application on supply chain integration and competitive advantage: Indonesian fishery industry context. Quality - Access to Success, 20 (169), 151-156.
- Pagell, M., Wu, Z., & Wasserman, M. E. (2010). Thinking differently about purchasing portfolios: An assessment of sustainable sourcing. Journal of Supply Chain Management, 46(1), 57-73.
- Parenreng, S. M., Pujawan, N., Karningsih, P. D., & Engelseth, P. (2016). Mitigating risk in the tuna supply through traceability system development. International Food and Agribusiness Management Review, 19(1), 59-82.
- Raman, R., Chadee, D., Roxas, B., & Michailova, S. (2013). Effects of partnership quality, talent management, and global mindset on performance of offshore IT service providers in India. Journal of International Management, 19(4), 333-346.
- Rombe, E., Mubaraq, R., Hadi, S., Adriansyah, R., & Vesakha, G. (2018). Barriers and Drivers for Applying Fish Traceability System in Emerging Market. International Journal of Engineering & Technology, 7(4.15), 262.
- Saaty, T. L. (1980). The analytic hierarchy process: planning. Priority Setting. Resource Allocation. MacGraw-Hill, New York International Book Company.
- Saaty, T. L. (1990). How to make a decision: The analytic hierarchy process. European Journal of Operational Research, 48(1), 9-26.
- Saaty, T. L. (1994). How to Make a Decision: The Analytic Hierarchy Process. Informs Journal of Applied Analytics, 24(6), 1-131.
- Setiadi, S., Nurmalina, R., & Suharno, S. (2018). Analisis kinerja rantai pasok ikan nila pada bandar sriandoyo di kecamatan tugumulyo kabupaten musi rawas. Mix: Jurnal Ilmiah Manajemen, 8(1), 166-185.
- Seuring, S. (2011). Supply Chain Management for Sustainable. Business Strategy and the Environment, 20(7), 471-484.
- Shaharudin, M. R., Govindan, K., Zailani, S., & Tan, K. C. (2015). Managing product returns to achieve supply chain sustainability: an exploratory study and research propositions. Journal of Cleaner Production, 101, 1-15.
- Sun, C., & Che, B. (2012). The influence of marine aquaculture on the seafood supply chain in china. Aquaculture Economics and Management, 16(2), 117-135.
- Svensson, G. (2007). Aspects of sustainable supply chain management (SSCM): Conceptual framework and empirical example. Supply Chain Management, 12(4), 262-266.
- Taticchi, P., Tonelli, F., & Pasqualino, R. (2013). Performance measurement of sustainable supply chains. International Journal of Productivity and Performance Management, 62(8), 782-804.
- Tran, N., Rodriguez, U. P., Chan, C. Y., Phillips, M. J., Mohan, C. V., Henriksson, P. J. G., Koeshendrajana, S., Suri, S., & Hall, S. (2017). Indonesian aquaculture futures: An analysis of fish supply and demand in Indonesia to 2030 and role of aquaculture using the AsiaFish model. Marine Policy, 79, 25-32.
- Trim, P. R. J., & Lee, Y. I. (2008). A strategic approach to sustainable partnership development. European Business Review, 20(3), 222-239.
- Vaidya, O. S., & Kumar, S. (2006). Analytic hierarchy process: An overview of applications. European Journal of Operational Research, 169(1), 1-29.
- Widyaningrum, D., & Masruroh, N. A. (2012). Development of the sea fishery supply chain performance measurement system: A case study. International Journal of Supply Chain Management, 1(3), 20-32.
- Wu, Z., & Pagell, M. (2011). Balancing priorities: Decision-making in sustainable supply chain management. Journal of Operations Management, 29(6), 577-590.
- Xu, L. X. X., Ma, B., & Lim, R. (2007). AHP based supply chain performance measurement system. Proceedings of IEEE International Conference on Emerging Technologies and Factory Automation, ETFA.
- Yakovleva, N., Sarkis, J., & Sloan, T. (2012). Sustainable benchmarking of supply chains: The case of the food industry. International Journal of Production Research, 50(5), 1297-1317.
- Zhou, H., Shou, Y., Zhai, X., Li, L., Wood, C., & Wu, X. (2014). Supply chain practice and information quality: A supply chain strategy study. International Journal of Production Economics, 147, 624-633.