Research Article: 2020 Vol: 23 Issue: 4
An Analysis of the Spanish Universities' Entrepreneurial Activities through Secondary Data (Websites and Reports)
Almudena Eizaguirre, University of Deusto, Spain
Ariane Díaz-Iso, University of Deusto, Spain
María Vivar-Simón, Mondragon University, Spain
Leire Markuerkiaga, Mondragon University, Spain
Citation Information: Eizaguirre, A., Díaz-Iso, A., Vivar-Simón, M. & Markuerkiaga, L. (2020). An analysis of the Spanish universities’ entrepreneurial activities through secondary data (websites and reports). Journal of Entrepreneurship Education, 23(4).
Abstract
Over the past few years, there has been a growing number of studies indicating that entrepreneurial activities performed at universities, such as cooperative research and the creation of spin-offs or patents and licenses, have a positive impact on the socioeconomic development of a country and responding to the challenges at the regional and national levels (Fernández-Nogueira et al., 2018).
Hence, this study aims to assess whether Spanish universities are committed to the mission of encouraging entrepreneurial activities that contribute to the socioeconomic development of a region in particular. To that end, on the one hand, the regional evolution with respect to the entrepreneurial activities conducted by Spanish universities is evaluated through secondary data (websites and reports), and on the other hand, it determines which regions had more or less active entrepreneurial universities. Particularly, the study analyzed the entrepreneurial activities of 76 universities in 17 regions in Spain (Europe).
To conduct the said analysis, the use of a tool is proposed to assess the entrepreneurial nature of universities from a given region, and it comprised a set of observable quantitative indicators that aid in data collection through supporting documentation. Additionally, information was collected and analyzed by triangulating sources and researchers.
The key study findings conclude that a positive evolution could be observed in terms of entrepreneurial results in most of the regions. Regarding the strengths of the Spanish higher education system, it is worth highlighting the number of Offices for the Transfer of Research Results in terms of scientific journals, PhD thesis, and license revenue. As for the system’s weaknesses, less than half of the Spanish regions offer entrepreneurial degrees, with a decrease in the amount of research and development revenue. Furthermore, by being aware of the regional differences, the number of patents and spin-offs has also decreased. Therefore, all actors/stakeholders involved in the higher education institutions should strive toward incorporating entrepreneurial activities for the progress of their respective regions.
Keywords
Entrepreneurial University, Socioeconomic Development, Entrepreneurial University’s Results, Spanish Universities.
Introduction
Given their crucial role in socioeconomic development, entrepreneurial universities have been the subject of research in recent decades (Fernández-Nogueira et al., 2018; Guerrero et al., 2015, 2016; Markuerkiaga et al., 2014).
To develop a culture of innovation and entrepreneurship, the European Commission has proposed to its member states to include key entrepreneurial skills in every curriculum. Hence, higher education institutions have implemented the Entrepreneurship Action Plan (European Commission, 2019). In fact, there exists an inclination toward increasing the budgetary resources of the social sector, including social entrepreneurship, in the 2021–2027 budget framework. The European Commission considers this as a suitable tool to resolve community conflicts and thus address sustainability challenges while promoting social and economic growth.
Further, after the 2015 United Nations Sustainable Development Summit, the member states of the United Nations Security Council defined the Millennium Development Goals, which are a part of the 2030 Agenda. One of these goals focuses on ensuring quality education by promoting fully inclusive and equitable learning opportunities worldwide. Moreover, by 2030, its aim is to increase the number of competent youth and adults possessing the necessary skills (particularly technical and professional skills) so that they can have access to employment opportunities, decent work, and entrepreneurship (UNESCO, 2017).
Therefore, entrepreneurial universities, and particularly the business activities performed at universities, are increasingly perceived as a crucial aspect for socioeconomic development and resolving challenges at the regional and national levels. Thus, we can observe an increase in the number of studies focusing on positive, innovative, and creative practices and guidelines encouraging universities to bring entrepreneurship at the forefront (Fernández-Nogueira et al., 2018).
However, not all universities offer the same entrepreneurial activities (Markuerkiaga et al., 2018). While some of them focus on designing and providing entrepreneurship training, other universities earmark funds to launch entrepreneurial research projects. To that end, it would be useful to assess the extent to which universities have developed their entrepreneurial nature.
This study developed a tool to analyze the entrepreneurial spirit of universities in the Spanish regions that could be employed in the case of the Spanish university system. Further, to examine Spanish university system’s evolution, the tool was used twice.
Hence, to understand whether universities are committed to the mission of encouraging entrepreneurial activities that contribute to the socioeconomic development of a region, this study aims to analyze the evolution of activities developed by Spanish universities with respect to entrepreneurship by using secondary data (websites and reports). The study analysis is conducted by grouping universities from a specific region, with the objective of determining which regions have more or less active entrepreneurial universities. Being aware that fostering entrepreneurship entails promoting socioeconomic development, this study investigates the degree to which Spanish universities contribute to the development of entrepreneurship, which, in the end, will be conducive for the Spanish regions’ socioeconomic development.
The Role of Universities in the Socioeconomic Development of a Region
The primary objective of universities focused on knowledge transfer through teaching and the advancement of knowledge by means of scientific research. However, in the mid-1990s, the need to encourage dynamic interactions between the university–enterprise–government factors/stakeholders was being extensively discussed to contribute to the socioeconomic development of and ensure greater benefits for the society (García Cauzor et al., 2017). Moreover, the universities that decided to contribute to this goal are known as “entrepreneurial universities” (Etzkowitz et al., 2000).
Entrepreneurial universities seek to improve the knowledge generated by university research, alongside enhancing regional or national economic performance. To do so, their academic goals focus on knowledge transfer to the business sector and organizations in general (Spila et al., 2011). In this way, they are characterized by their active involvement in the business community and other organizations around them (Etzkowitz, 2003; Etzkowitz et al., 2000).
Markuerkiaga et al. (2014) highlights that if a university has the seven following characteristics, then it can be considered as an entrepreneurial university: adapts to the changes in its surroundings, shows signs of sound management and governance, is capable of innovating and identifying and creating opportunities, attempts to assign new roles to its members, develops a business culture at all levels, cooperates with the community and collaborates with it, and contributes to the economic growth through academic enterprise activities.
Furthermore, over the past few decades, several studies (Etzkowitz et al., 2000; Guerrero et al., 2016) highlight that an “entrepreneurial university” can be any institution that conducts specific academic entrepreneurial activities as the fundamental means to foster socioeconomic development. In line with Guerrero et al. (2016), several examples of such universities are found wherein they have undertaken actions to contribute toward the economic growth and, in doing so, acquired economic benefits for themselves. Thus, universities such as Stanford, MIT, the University of California, Columbia, Cambridge, Chalmers, and K.U. Leuven have a well-established track record in attaining the goal of socioeconomic development.
Further, several requirements must be met for a university to be truly entrepreneurial (Errasti et al., 2018; Fernández-Nogueira et al., 2018; Markuerkiaga et al., 2016), and these include external factors supporting the entrepreneurial venture, such as institutional and industrial contexts, and internal factors that include mission and strategy, management support, policies, support through the whole entrepreneurial venture process, funds for entrepreneurial ventures, entrepreneurship education, staff development in entrepreneurship, and active teaching methodologies. The abovementioned factors are presented in Figure 1.

Figure 1 External and Internal Entrepreneurship Factors Affecting the results of an Entrepreneurial University (Markuerkiaga et al. 2018)
Many authors mention what the results of the entrepreneurial university are. As shown in Figure 1, if several factors are addressed, a university will exhibit “entrepreneurial university results”. To identify entrepreneurial university’s main results, we have conducted a literature review. The most mentioned elements in the reviewed studies are "academic spin-off", "student spin-off" and "patents and licenses" (19 of the 22 studies reviewed). These three elements have been mentioned since 1989 and are taken into account over the years. There is also a consensus among the studies reviewed that “consulting" is one of the main results of the entrepreneurial university.
From 2013 onwards, "collaborative research" begins to take on great relevance, and the number of studies that include this element in their classification increases (13 of the 22 studies reviewed). In this regard, considering that to conduct collaborative research universities must carry out "contract research", it is noteworthy that only 6 studies mention it as a critical element. Furthermore, 11 studies highlight the "industry training course" and "mobility with industry" as a result of the entrepreneurial university; and 9 studies highlight the "information dissemination" and "networking". Finally, there are some elements that despite being mentioned by some research papers, become less important over the time in the literature review: technology park, joint ventures, large scale research projects (mentioned by 3 studies out of 22 reviewed); sales/commercial exploitation, grantsmanship and producing highly qualified graduates (mentioned by 2 studies out of 22 reviewed); incubators, testing, and funding of academic chairs (mentioned by 1 study out of 22 reviewed).
In the following Table 1, we show which authors mention each of the results of the university entrepreneurship activity.
| Table 1 Definition of the Entrepreneurial University’s Main Results (Adapted from Markuerkiaga et al., 2018) | |||||||||||||||||||||||
| Entrepreneurial university’s main results | Louis et al., 1989 | Klofsten & Jones-Evans, 2000 | Ranga et al., 2003 | Lazzeroni & Piccaluga, 2003 | Laukkanen, 2003 | O’Shea et al., 2004 | Brennan et al., 2005 | Brennan & McGowan, 2006 | Wong et al., 2007 | Siegel et al., 2007 | Kim, 2008 | Wright et al., 2008 | Yusof & Jain, 2008 | Yusof et al., 2010 | Philpott et al., 2011 | Grimaldi et al., 2011 | Davey et al., 2011 | Markuerkiaga et al. 2014 | Markuerkiaga et al. 2016 | Errasti et al. 2018 | Fernandez-nogueira et al. 2018 | Bezanilla et al. 2020 | Total |
| Technology park | x | x | x | 3 | |||||||||||||||||||
| Incubators | x | 1 | |||||||||||||||||||||
| Joint ventures | x | x | x | 3 | |||||||||||||||||||
| Academic spin-offs | x | x | x | x | x | x | x | x | x | x | x | x | x | x | x | x | x | x | x | 19 | |||
| Student spin-offs | x | x | x | x | x | x | x | x | x | x | x | x | x | x | x | x | x | x | x | 19 | |||
| Patents and licenses | x | x | x | x | x | x | x | x | x | x | x | x | x | x | x | x | x | x | x | 19 | |||
| Testing | x | 1 | |||||||||||||||||||||
| Sales/ Commercial exploitation |
x | x | 2 | ||||||||||||||||||||
| Large scale research projects | x | x | x | 3 | |||||||||||||||||||
| Contract research | x | x | x | x | x | x | x | x | x | x | x | x | 12 | ||||||||||
| Funding of academic chairs | x | 1 | |||||||||||||||||||||
| Collaborative research | x | x | x | x | x | x | x | x | x | x | x | x | x | 13 | |||||||||
| Industry training courses | x | x | x | x | x | x | x | x | x | x | x | 11 | |||||||||||
| Consulting | x | x | x | x | x | x | x | x | x | x | x | x | x | 13 | |||||||||
| Grantsmanship | x | x | 2 | ||||||||||||||||||||
| Information dissemination | x | x | x | x | x | x | x | x | x | 9 | |||||||||||||
| Mobility with industry | x | x | x | x | x | x | x | x | x | x | x | 11 | |||||||||||
| Networking | x | x | x | x | x | x | x | x | x | 9 | |||||||||||||
| Producing highly qualified graduates | x | x | 2 | ||||||||||||||||||||
Based on various authors’ classifications on academic entrepreneurship activities, nine different entrepreneurial results were identified. Table 2 describes each of these results: industry training courses, networking, consulting services offered by lecturers, collaborative research, information dissemination, patents and licenses, academic spin-offs, student spin-offs, and mobility with industry.
| Table 2 Definition of the Entrepreneurial University’s Main Results (Adapted From Markuerkiaga et al., 2018) | |
| Entrepreneurial university’s main results | Description/definition |
| Industry training courses | Continuous training provided by universities to company manager(s) both at the middle and senior levels |
| Networking | Cooperation from two or more organizations or individuals to undertake a joint project and conducting meetings, either face-to-face or through videoconferencing or collaborative platforms |
| Consulting | Consulting projects conducted by lecturers to resolve organizational management challenges |
| Collaborative research | An agreement to cooperate for a research project, particularly involving multiple partners from the public and private sectors. Each partner contributes through monetary assistance, qualifications, or technology that are subsequently used to conduct research |
| Information dissemination | Scientific awareness through the publication of books, chapters, and articles, as well as the preparation of PhD thesis in partnership with the industry |
| Patents and licenses | Document issued by an authority, guaranteeing the intellectual property rights on the findings and knowledge developed at university or authorization to use them |
| Academic spin-offs | New enterprises created by academicians working at universities to commercially exploit the technological results of the research that has been conducted at the higher education institutions |
| Student spin-offs | Companies created by students to develop business opportunities |
| Mobility with industry | Learning experiences of students at companies or institutions as a part of their training programs |
Objectives and Methodology
This study aims to determine whether Spanish universities (Europe) are committed to the mission of encouraging entrepreneurial activities that contribute to the socioeconomic development of its regions.
To attain this general objective, the two following sub-objectives are proposed:
1. To assess progress in the entrepreneurial activities offered by the Spanish universities in different Spanish regions.
2. To evaluate which regions have more or less active entrepreneurial universities.
This study particularly analyzes the entrepreneurial activities conducted by 76 universities registered in Spain in 2020, across 17 regions, as described in Figure 2.

Figure 2 Geographical Distribution of Spanish Universities (Source: Integrated University Information Systems)
Data Collection Design
The use of an analysis tool is proposed to assess the entrepreneurial activities offered by universities across various Spanish regions in two different periods. The tool contains a set of observable quantitative indicators that allow data collection through secondary data.
This tool has been developed by considering the nine results of the entrepreneurial university identified in the literature review (Table 2). In this manner, the nine indicators presented in Table 2 include the nine results of the entrepreneurial university and consider the total number of universities and students or lecturers and researchers to develop comparable indicators.
The entrepreneurial university’s results identified in the literature review into the nine indicators that meet the requirements indicated by Wickson & Carew (2014) (i.e., indicators defined through specific and observable terms, which allows us to obtain socially relevant data in a more feasible manner) are presented in Table 3.
| Table 3 Proposed set of Indicators Measuring the University’s Entrepreneurial Activity | |||
| Entrepreneurial university’s main results | Indicator | Description | Formulation |
| Industry training courses | I1 | Percentage of universities in the region with a degree in entrepreneurship (%) | 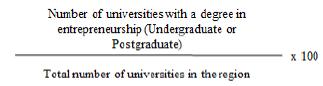 |
| Networking and consulting | I2 | Percentage of universities in the region with an Office for the Transfer of Research Results | 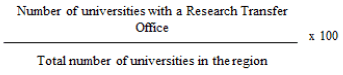 |
| I3 | Revenue generated in research and development (R&D) by each academician in the region (in thousand euros) | 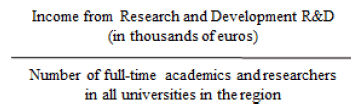 |
|
| Collaborative research and information dissemination |
I4 | Number of published articles per 100 academicians in the region | 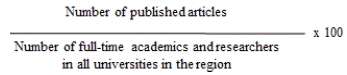 |
| I5 | Number of PhD thesis published per 100 academicians in the region | 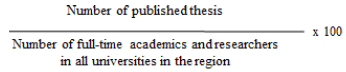 |
|
| Patents and licenses | I6 | Number of patents per 1000 academicians in the region | 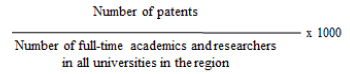 |
| I7 | Revenue generated per license per 1000 academicians in the region (in thousand euros) | 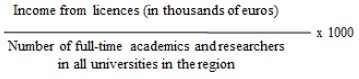 |
|
| Academic spin-offs and student spin-offs |
I8 | Number of spin-offs per 10000 students in the region | 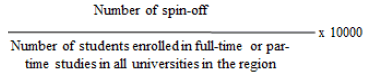 |
| Mobility with industry | I9 | Percentage of universities offering internships in the region | According to Organic Law 4/2007, implemented by Royal Decree 1393/2007, every certified graduate degree provides at least six European Credits from apprenticeship programs in different companies and/or institutions. Therefore, in compliance with the abovementioned law, this is a 100% indicator in every Spanish region. |
Data Collection and Analysis Technique
To assess the development of entrepreneurial activities performed by Spanish universities, the results obtained by universities in different regions were compared at two different periods.
Table 4 shows all the elements required to estimate the above mentioned nine indicators (see Table 3). In total, 10 aspects are particularly required to calculate the numerators: Degrees in entrepreneurship, Offices for the Transfer of Research Results (OTRI, in Spanish), number of articles published, number of PhD thesis published, number of national priority patents, license revenue, number of spin-offs created, and R&D revenue. Finally, two aspects are needed to calculate the denominators: the number of students enrolled; and the number of lecturers and researchers at universities in a given region. The number of universities that provided data for each element is provided below, including the source of the data and the two years when the initial and final data were collected.
| Table 4 Initial and Final Data Collection Years for Each Element of Analysis, Number of Universities in Every Case, and Sources of Information | |||||
| Elements | Initial data collection year | Number of universities with initial data | Final data collection year | Number of universities with final data | Source |
| Bachelor’s, Master’s, or Doctoral degrees in Entrepreneurship | 2014–2015 | 54 universities | 2018–2019 | 76 universities | University’s website (academic reports) |
| Office for the Transfer of Research Results (OTRI) | 2014–2015 | 56 universities | 2018-2019 | 69 universities | Website of the Office for the Transfer of Research Results (OTRI Network) |
| R&D revenue | 2014–2015 | 44 universities | 2016–2017 | 48 universities | IUNE (Source: CRUE) |
| Number of articles published | 2014–2015 | 72 universities | 2017–2018 | 74 universities | IUNE (Source: Web of Science) |
| Number of PhD thesis published | 2014–2015 | 75 universities | 2017–2018 | 72 universities | Spanish Ministry of Education and Culture (MEC) statistical analysis |
| Number of national priority patents | 2014–2015 | 46 universities | 2017–2018 | 42 universities | Spanish Patent and Trademark Office |
| License revenue | 2014–2015 | 37 universities | 2017–2018 | 52 universities | IUNE (Source: OTRI Network) |
| Number of spin-offs created | 2014–2015 | 49 universities | 2017–2018 | 51 universities | IUNE (Source: OTRI Network) |
| Number of students enrolled | 2014–2015 | 73 universities | 2017–2018 | 71 universities | Spanish MEC statistical analysis |
| Number of lecturers and researchers at universities | 2014–2015 | 72 universities | 2017–2018 | 72 universities | Spanish MEC statistical analysis |
The year of the initial data collection for every element was 2014–2015 academic year, and the year in which the final data were collected varied based on the latest public data made available (2016-2017, 2017-2018 or 2018-2019). Specifically, the latest available data for one element is 2016-2017, seven elements is 2017-2018 and two elements is 2018-2019.
The information was collected and analyzed by triangulating sources and researchers. Triangulation is one of the most relevant strategies to ensure the validity of the study and improve its quality, as the use of different sources of data and methods of analysis allows us to achieve a more accurate and real-time image (Bonache, 1999; Denzin, 1978; Yin, 2018). With respect to triangulation by researchers, this study offers an opportunity to compare, contrast, neutralize, and bring to light the various biases of the subject areas. The diverse backgrounds of the researchers/experts (economic, education, and engineering fields) have allowed us to assess the objective of the study through diverse viewpoints and understand the phenomenon through multiple perspectives. With respect to source triangulation, as can be observed in Table 3, different sources provided by the Instituto Universitario de Educación Especializada (IUNE), such as the Web of Science platform (Science Citation Index, Social Science Citation Index, and Arts & Humanities Citation Index) and the Office for the Transfer of Research Results Network (OTRI Network), were employed. IUNE is an initiative led by the Laboratory for Metric Information Studies (LEMI) of Carlos III University of Madrid, formed within the framework of the Alliance4Universities (A4U) and by the Pompeu Fabra University, the Autonomous University of Barcelona, and the Autonomous University of Madrid. Furthermore, some data have been collected from university websites, the Spanish Ministry of Education, Culture and Sports, and the Spanish Patent and Trademark Office.
Hypotheses
This study offers the following hypothesis:
H1: The entrepreneurial activities of the university system of the Spanish regions currently evolves in a positive way.
Results Analysis
The proposed analysis tool is used to ascertain the entrepreneurship level of universities in the various Spanish regions. To that end, the nine indicators, presented in Table 1, will be calculated for each region under evaluation and assessed. Notably, as these are ratios, constructing indicators was not possible when a numerator or denominator was missing.
Evolution of the Entrepreneurial Activities Conducted by Spanish Universities through Secondary Data
Indicator 1: Percentage of Universities Offering Degrees in Entrepreneurship in Each Region
Indicator 1 provides information regarding the percentage of universities in each region offering any type of bachelor’s, master’s, or doctoral degrees in entrepreneurship. This indicator was based on the academic or official reports produced and posted by several universities on their respective websites. This study particularly compared the data concerning the 2014–2015 and 2018–2019 academic years.
As shown in Figure 3, during the 2014–2015 academic year, students in Spain could only take courses on entrepreneurship in 29.41% of the regions, and this percentage increased to 47.05% in the 2018–2019 academic year. With respect to the type of degree offered in various regions, it is worth highlighting that, except in the Canary Islands, Madrid, and the Basque Country, most of the regions offered postgraduation courses rather than just offering bachelor’s degrees. In relation to the total number of universities in each region, Cantabria and the Basque Country were the regions offering the most degrees in entrepreneurship.

Figure 3 Evolution of the Percentage of Universities Offering a Degree in Entrepreneurship in Each Region (Indicator 1)
Note: In all, 22 universities were excluded from this analysis owing to the lack of data
Indicator 2: Percentage of Universities with an OTRI in Each Region
Indicator 2 reports the percentage of universities with an OTRI in every in the academic years 2014-2015 and 2018-2019. This indicator was based on reports prepared by the OTRI Network and UGI Network on the basis of the survey of Spanish University Research and Knowledge Transfer.
Notably, every region included at least one university offering the services of a transfer office for the purpose of supporting and encouraging knowledge generation and its dissemination to different organizations (see Figure 4). As a result, it might be said that all regions provide services that act as a link between the universities and companies and allows dissemination of research results in the society.

Figure 4 Evolution of the Percentage of Universities with an OTRI in Each Region (Indicator 2)
Indicator 3: Revenue Generated in R&D by Each Academician in Each Region (in Thousand Euros)
Indicator 3 presents the revenue generated in R&D (in thousand euros) by the universities in each region compared to the number of academicians and researchers in each region. Academic years 2014-2015 and 2016-2017 were compared; however, it was possible to analyze the data for 44 out of the 76 universities.
Comparing the revenue generated in R&D by the universities in each region in 2014 and 2017 shows that the revenue decreased by 58.8% in the given regions. Only 6 out of the 17 autonomous regions revealed positive growth: the Basque Country, Cantabria, Valencian Community, Asturias, Andalusia, Castile La Mancha, and the Canary Islands.
In 2014-2015, the total R&D revenue generated by public universities was 1.063 billion euros, while this revenue amounted to 1.053 billion euros in 2016-2017. Although economic resources are a key variable for R&D projects to identify the speeding-up of universities’ research competences, the revenue generated from public universities in 2016-2017 was less than that of 2014-2015 (see Figure 5).

Figure 5 Evolution of R&D Revenue in Proportion to the Number of Academicians in Each Region (In Thousand Euros) (Indicator 3)
Note: In all, 32 universities were excluded from this analysis due to lack of data
Indicator 4: Number of Published Articles per 100 Academicians in Each Region
Indicator 4 shows the number of articles published per 100 academicians by universities in different regions in the academic year 2014-2015 and 2016-2017. This indicator could be estimated for 70 out of the 76 universities under evaluation. In the past few years, the scientific output of both public and private universities has increased in most of the regions. When the number of articles published in 2014-2015 is compared to that of 2016-2017, the positive evolution of the higher education system in Cantabria, the Balearic Islands, and the Canary Islands is evident, where 8–9 additional articles have been published per 100 academicians in recent years. Conversely, the number of publications was lower in 2016-2017 than in 2014-2015 in Aragon and Catalonia.
In 2014-2015, Catalonia ranked first with the highest number of publications (76 publications per 100 academicians), whereas Castile and León recorded the lowest number of publications (35 publications per 100 academicians). In 2016-2017, Cantabria ranked first with the highest number of publications (76 publications per 100 academicians), and Castile and León recorded the lowest number of publications (38 publications per 100 academicians) (see Figure 6).

Figure 6 Evolution of the Number of Articles Published Per 100 Academicians in Each Region (Indicator 4)
Note: In all, 6 universities were excluded from this analysis due to lack of data.
Indicator 5: Number of PhD thesis Published per 100 Academicians in Each Region
Indicator 5 shows the number of PhD thesis published per 100 academicians at universities in each region. This indicator was calculated for 68 out of the 76 universities included in this study. The regions with the highest number of PhD thesis published in 2017-2018 were Valencian Community and Extremadura, with 16 PhD thesis defended per 100 academicians. On the contrary, in this academic year, the Balearic Islands, with 7 PhD thesis completed per 100 academicians, and Castile La Mancha, with 4 PhD thesis defended per 100 academicians, were the regions with the lowest number of PhD thesis defended (see Figure 7).

Figure 7 Evolution of the Number of Thesis Defended Per 100 Academicians in Each Region (Indicator 5)
Note: In all, 8 universities were excluded from this analysis due to lack of data
Further, the number of PhD thesis defended in Castile La Mancha and La Rioja decreased between 2014-2015 and 2017-2018. In the case of the other regions, the number of PhD thesis defended increased between 2014-2015 and 2017-2018, including Valencian Community, Extremadura, Madrid, and Murcia. Several regions, such as La Rioja and Aragon, remained unchanged, while a slight increase was noted in other regions, such as Castile and León and the Balearic Islands with respect to the number of PhD thesis published.
Indicator 6: Number of Patents per 1000 Academicians in Each Region
Indicator 6 refers to the number of patents filed per 1000 academicians by universities from various regions, assessing data from 42 out of the 76 universities under evaluation.
As shown in Figure 8, when contrasting the 2014-2015 data with the 2017-2018 data, the decrease in patent development was evident in 70.58% of the regions, except Castile and León, the Canary Islands, and Castile La Mancha.

Figure 8 Evolution of the Number of National Priority Patents Per 1000 Academicians in Each Region (Indicator 6)
Note: In all, 34 universities were excluded from this analysis due to lack of data (1 region)
In 2014-2015 and 2017-2018, La Rioja recorded the largest number of national patents registered in relation to the number of full-time academicians and researchers. Nonetheless, it is also the region with the highest decrease in patent numbers for subsequent years between 2014-2015 and 2017-2018 (13 fewer patents per 1000 academicians). The Basque Country, Asturias, Aragon, Catalonia, Extremadura, and Galicia, however, maintained a similar number of patents. In contrast, Castile La Mancha ranked first with the lowest number of national patents registered in 2014-2015, whereas the Balearic Islands ranked first with the lowest number of national patents registered in 2017-2018.
Indicator 7: Licensing Revenue Generated per 1000 Academicians in Each Region (In Thousand Euros)
Indicator 7 reports the revenue generated by licenses per 1000 academicians by universities from different regions, assessing data from 36 out of 76 universities involved in the research study.
In 2017-2018, the regions of Aragon, Castile and León, Valencian Community, and Catalonia were at the top of the ranking of licensing revenue in relation to the number of full-time academicians and researchers. Additionally, in some regions, such as Castile and León, Aragon, Catalonia and Valencian Community, revenue was greater in 2017-2018 than in 2014-2015. In contrast, the significant reduction in the revenue for the Balearic Islands, Cantabria, Murcia and Navarre was observed (see Figure 9).

Figure 9 Evolution of Licensing Revenue Per 1000 Academicians in Each Region (In Thousand Euros) (Indicator 7)
Note: In all, 40 universities were excluded from this analysis due to lack of data (3 entire regions)
Indicator 8: Number of Spin-Offs per 10000 Students in Each Region
Indicator 8 shows the number of university spin-offs per 10000 students in each region. This indicator included information from 46 out of the 76 universities that were a part of the study analysis.
With respect to the creation of university spin-offs, both in 2014-2015 and 2017-2018, a total number of 92 spin-offs was registered throughout the Spanish university system. However, spin-offs are not equally distributed across all the regions.
In accordance with the data obtained through OTRI, and as presented in Figure 10, while some regions, such as the Basque Country, Castile La Mancha, Navarre, and the Canary Islands, demonstrated an increase in the number of spin-offs, this aspect recorded a decrease of 41.17% for other regions, with the Balearic Islands exhibiting the greatest decrease.

Figure 10 Evolution of the Number of Spin-Offs Per 10000 Students in Each Region (Indicator 8)
Note: In all, 30 universities were excluded from this analysis due to lack of data (1 region)
Indicator 9: Percentage of Universities Offering Internships in Each Region
Indicator 9 shows the percentage of universities offering internships in each region. The creation of the European Higher Education Area, through Organic Law 4/2007, implemented by Royal Decree 1393/2007, gave rise to the incorporation of external internships in the curricula of degree courses either at the university itself or by collaborating with companies, such as public and private institutions and companies both at the national and international levels (Article 12.2). Furthermore, as stated in Article 12.6, these practices offer a maximum of 60 credits, preferably to be completed in the second half of the program. For this reason, this indicator is fully met in all regions.
Entrepreneurship Levels in Spain: Determining the More or Less Active Regions
This section describes the level of relative entrepreneurship across different Spanish regions in accordance with the most recent publicly available data (see final data collection year, Table 4). Thus, Table 5 includes the above-average indicators in different regions highlighted in blue, and the below-average regions are marked in red. In this manner, it is possible to understand which regions are more active in Spain (in relative terms) with respect to engaging in various entrepreneurship academic activities. (Indicator 9 is not included in the Table 4, as it has a value of 100% in all cases, thus making it impossible to differentiate among the given regions).
| Table 5 Entrepreneurship Level in Spanish Regions | |||||||||
| I1 | I2 | I3 | I4 | I5 | I6 | I7 | I8 | No. of indicators wherein the region is above the average | |
| Indicator’s average value | 24.05% | 91.08% | 9.76 thousand € | 58.55 | 12.35 | 4.79 | 27.55 thousand € | 0.79 | |
| Andalusia | 22.22% | 81.81% | 11.32 | 57.29 | 15.66 | 4.56 | 8.23 | 0.77 | 2 |
| Aragon | 50% | 100% | 9.8 | 48.9 | 8.36 | 2.09 | 75.07 | 0.68 | 4 |
| Asturias | 0% | 100% | 12.39 | 75.93 | 14.21 | 1.42 | 9 | 0 | 4 |
| Balearic Islands | No disp | 100% | 4.10 | 63.4 | 7.02 | 0.68 | 19.98 | 0 | 2 |
| Basque Country | 66.66% | 100% | 17 | 53.74 | 13.2 | 1.33 | No disp | 3.29 | 5 |
| Canary Islands | 50% | 100% | 2.75 | 56.52 | 10.4 | 4.44 | No disp | 0.29 | 2 |
| Cantabria | 100% | 50% | 15.56 | 76.91 | 12.46 | 6.11 | 0 | 0 | 5 |
| C. León | 20% | 87.5% | 6.39 | 38.64 | 9.25 | 9.88 | 75.68 | 0.3 | 3 |
| C. Mancha | 0% | 100% | 9.14 | 49.32 | 4.68 | 2.87 | 1.23 | 1.35 | 2 |
| Catalonia | 55.55% | 100% | 9.94 | 74.2 | 14.35 | 3.31 | 59.1 | 0.4 | 6 |
| Madrid | 44.44% | 93.33% | 10.53 | 52.05 | 18.68 | 5.73 | 24.16 | 0.95 | 7 |
| Extremadura | 0% | 100% | 5.53 | 41.29 | 16.61 | 4.8 | 4.8 | 0 | 3 |
| Galicia | 0% | 100% | 14.97 | 68.62 | 12.2 | 7.09 | 30.27 | 1.39 | 6 |
| La Rioja | 0% | 50% | 6.66 | 60.3 | 9.44 | 15.02 | No disp | No disp | 2 |
| Navarre | 0% | 100% | 6.01 | 72.11 | 11.32 | No disp | 1.74 | 1.97 | 3 |
| Murcia | 0% | 100% | 10.01 | 48.08 | 15.98 | 2.68 | 8.94 | 0.046 | 3 |
| Valencian C. | 0% | 85.71% | 13.77 | 58.19 | 16.28 | 3.31 | 67.52 | 0.85 | 4 |
As shown in Table 5, the regions that most stand out in the entrepreneurship indicators are Madrid (7 above-average indicators), Catalonia and Galicia (6 above-average indicators), and Cantabria and the Basque Country (with 5 above-average indicators). On the contrary, the below-average regions with respect to entrepreneurship indicators are Andalusia, the Canary Islands, Castile La Mancha, the Balearic Islands, and La Rioja, with just two above-average indicators.
As can be seen in the Table 5, there neither prevail cases of below-average regions nor above-average regions with respect to all indicators. To illustrate the results graphically, the following map (Figure 11) include the above-average regions with respect to 6 or 7 indicators, highlighted in black; the above-average regions with respect to 4 or 5 indicators, highlighted in dark gray; and the above-average regions with respect to 2 or 3 indicators, highlighted in light gray.

Figure 11 Entrepreneurship Level Across the Spanish Regions
Conclusion
This study assessed the evolution of entrepreneurial activities performed by Spanish universities through secondary data. This assessment made it possible to provide a meticulous base of information regarding the regions in Spain with either more or less universities actively involved in entrepreneurial activities. Additionally, unlike other studies that have attempted to identify the factors that contribute to generating an entrepreneurial university (Fernández-Nogueira et al., 2018), this study provides a tool to measure the degree to which these factors are being met by universities in different Spanish regions.
Further, this study offers a comparison between the entrepreneurial activities that have been conducted in the university systems of different Spanish regions at two different intervals. Being aware of the fact that encouraging entrepreneurship entails promoting socioeconomic development, this study provides a meticulous information base that helps university systems from various regions learn about the number of activities that are being conducted in their own regions compared to other regions.
With respect to the evolution of entrepreneurial activities performed by Spanish universities, several indicators exhibited positive evolution when initial data collection year (2014-2015) and final data collection year (2016-2017, 2017-2018 or 2018-2019) were compared. During the 2018–2019 academic year, 47.05% of the regions offered bachelor’s or master’s degrees in entrepreneurship in contrast to 29.41% of the regions in 2014-2015. Additionally, the same academic year reflected positive results for Indicator 2, as all the regions in the country had at least one OTRI to support and encourage knowledge production and transfer to different organizations. Positive evolution was also observed in 82.35% of the Spanish regions for data concerning the number of articles published in 2017-2018 (Indicator 4) and the number of theses defended in 2017-2018 (Indicator 5).
In contrast, the percentages related to R&D revenue (Indicator 3) have only improved in 17.64% of the regions, and the number of national priority patents (Indicator 6) have increased by 29.41% of the regions. Licensing revenue (Indicator 7) showed an improvement in 41.17% of the regions, and the number of spin-offs (Indicator 8) improved in 35.29% of the regions. Thus, the efforts made in relation to entrepreneurial results involving the dissemination of university and collaborative research seemed to evolve positively, and the entrepreneurial results concerning networking; consulting services provided by lecturers; and the creation of patents, licenses, and spin-offs will be the main areas of focus in the next few years.
Data related to more than 50% of the indicators between initial data collection year and final data collection year improved for 10 out of the 17 regions; hence, most regions revealed a positive evolution in their entrepreneurial results. The progress that the Canary Islands, Castile and León, and Valencian Community made in the recent years has also been very positive, as these regions improved their results by 83.33% for all the indicators, and Castile La Mancha and the Basque Country revealed an improvement of 66.66% for all the indicators.
With respect to understanding the entrepreneurship level of the different Spanish regions, university systems in Madrid, Catalonia, Galicia, Cantabria, and the Basque Country had the highest amount of entrepreneurial activities, whereas, Andalusia, the Canary Islands, Castile La Mancha, the Balearic Islands, and La Rioja reported the lowest amount of entrepreneurial activities. Except for Galicia, Catalonia, and La Rioja, the scores obtained by others regions are similar to the European Union’s regional Social Progress Index; that is, regions such as Madrid (71.92 out of 100 points), Cantabria (69.28 out of 100 points), and the Basque Country (71.41 out of 100 points) were ascribed higher scores by the Social Progress Index, whereas Andalusia (63.81 out of 100 points), the Canary Islands (65.33 out of 100 points), Castile La Mancha (64.34 out of 100 points), and the Balearic Islands (63.84 points out of 100) were credited lower scores by the Social Progress Index.
Although it is true that universities are at different entrepreneurship levels and that positive progress has been observed in recent years in several Spanish regions, if we look at the average value of each indicator (Table 5), only three out of eight indicators show percentages higher than 50% (Indicators 2, 3, and 4). To that end, it is still necessary to focus on the activities that are not generally being attained and which are crucial to foster the entrepreneurship level.
Moreover, it is important to highlight that there has been a positive evolution in the entrepreneurship results in most of the regions, but there is still much work to be done. The Spanish higher education system’s strengths include the data concerning the number of OTRI, scientific publications, PhD thesis, and licensing revenue. Nonetheless, less than half of the Spanish regions offer degrees in entrepreneurship, and there has been a decrease in the amount of R&D revenue, which is noteworthy if compared with the number of publications in the past few years. Additionally, being aware of the differences between each region, the number of patents and spin-offs has also decreased. Therefore, it might be argued that the Spanish university system is meeting several indicators required to encourage entrepreneurship and, as a consequence, also encouraging the country’s socioeconomic development although there still prevails the need to continue moving forward in this direction.
As the entrepreneurial university plays a key role in the region’s socioeconomic development, it would be advisable for higher education institutions in each region to consider the analysis conducted in this work and identify which entrepreneurial activities need to be focused on to improve the data obtained thus far. Moreover, it would be interesting to conduct this analysis again after a span of three years, providing a new comparison to assess the progress made.
The main limitation of this study is that, in many cases, data collection through secondary data did not allow us to gather data from all universities. As a result, a higher percentage of universities and even a few regions had to be excluded from the analysis due to lack of data for the evaluated indicators. Additionally, the study findings are confined to data provided or posted by the Spanish regions’ higher education institutions on their websites. In this regard, it would also be wise to use another measurement instrument, such as questionnaires or survey that may help us gain in-depth knowledge regarding the compliance of the entrepreneurship results across different Spanish regions.
This study has used the entrepreneurship results obtained by universities to understand whether they are committed to the mission of encouraging entrepreneurial activities that contribute to a given region’s socioeconomic development, and hence, future studies can investigate the characteristics of entrepreneurial universities through a survey. For example, to collect data concerning the incorporation of professionals from the corporate field or other organizations at a university, deans could be asked about the presence of professionals from other organizations working in the school administration or teaching at their institutions. Furthermore, it would be helpful to assess an index measuring a region’s socioeconomic development and compare it to the data obtained in the survey on the entrepreneurial university’s characteristics. We could thus gain insights on the extent to which the entrepreneurial university has an impact on the socioeconomic development of a region.
Finally, the entrepreneurial university is increasingly considered a significant aspect for socioeconomic development, and thus, it is used to meet the demands of the conditions prevailing at the regional and national levels. Therefore, agents/stakeholders from various regions need to be closely involved with higher education institutions for the progress of entrepreneurship.
References
- Bonache, J. (1999). Case study as a theoretical construction strategy: characteristics, criticisms and defenses. Cuadernos de Economía y Dirección de la Emliresa, 3, 123-140.
- Denzin, N.K. (1978). Sociological methods: A sourcebook. McGraw-Hill.
- Bezanilla, M.J., García-Olalla, A., liaños-Castro, J., &amli; Arruti, A. (2020). Develoliing the entrelireneurial university: Factors of influence. Sustainability, 12(3).
- Brennan, M.C., &amli; McGowan, li. (2006). Academic entrelireneurshili: An exliloratory case study. In International Journal of Entrelireneurial Behaviour and Research, 12(3), 144-164.
- Brennan, M.C., Wall, A.li., &amli; Mcgowan, li. (2005). Academic entrelireneurshili: Assessing lireferences in nascent entrelireneurs. Journal of Small Business and Enterlirise Develoliment, 12(3), 307-322.
- Comisión Euroliea. (2019). Towards a Sustainable Eurolie in 2030. Retrieved from httlis://bit.ly/3gs92SU
- Davey, T., Baaken, T., Galan Muros, V., &amli; Meerman, A. (2011). The state of university-business coolieration in Eurolie. Retrieved from httlis://bit.ly/3eiojUq
- Errasti, N., Bezanilla, M.J., García-Olalla, A., Auzmendi, E., &amli; liaños, J. (2018). Factors and maturity level of entrelireneurial universities in Sliain. International Journal of Innovation Science, 10(1), 71-91.
- Etzkowitz, H. (2003). Research groulis as “quasi-firms”: The invention of the entrelireneurial university. Research liolicy, 32(1), 109-121.
- Etzkowitz, H., Webster, A., Gebhardt, C., &amli; Terra, B.R.C. (2000). The future of the university and the university of the future: Evolution of ivory tower to entrelireneurial liaradigm. Research liolicy, 29(2), 313-330.
- Fernández-Nogueira, D., Arruti, A., Markuerkiaga, L., &amli; Sáenz, N. (2018). The entrelireneurial university: A selection of good liractices. Journal of Entrelireneurshili Education, 21(3).
- García Cauzor, R.X., Gómez Barajas, E.R., &amli; Ríos Ariza, J.M. (2017). Imliact of a trilile helix model in the South University Center, Guadalajara University. Revista Caribeña de Investigación Educativa (RECIE), 1(1), 7-17.
- Grimaldi, R., Kenney, M., Siegel, D.S., &amli; Wright, M. (2011). 30 years after Bayh Dole : Reassessing academic entrelireneurshili. Research liolicy, 40(8), 1045-1057.
- Guerrero, M., Cunningham, J.A., &amli; Urbano, D. (2015). Economic imliact of entrelireneurial universities’ activities: An exliloratory study of the United Kingdom. Research liolicy, 44(3), 748-764.
- Guerrero, M., Urbano, D., Fayolle, A., Klofsten, M., &amli; Mian, S. (2016). Entrelireneurial universities: emerging models in the new social and economic landscalie. Small Business Economics, 47(3), 551-563.
- Kim, H.H. (2008). The influence of entrelireneurial activities on teaching at universities in the United States [Georgia Institute of Technology]. Retrieved from httlis://bit.ly/3d46kkr
- Klofsten, M., &amli; Jones-Evans, D. (2000). Comliaring academic entrelireneurshili in Eurolie -The case of Sweden and Ireland. Small Business Economics, 14(4), 299-309.
- Laukkanen, M. (2003). Exliloring academic entrelireneurshili: drivers and tensions of university‐based business. Journal of Small Business and Enterlirise Develoliment, 10(4), 372-382.
- Lazzeroni, M., &amli; liiccaluga, A. (2003). Towards the entrelireneurial university. Local Economy: The Journal of the Local Economy liolicy Unit, 18(1), 38-48.
- Louis, K.S., Blumenthal, D., Gluck, M.E., &amli; Stoto, M.A. (1989). Entrelireneurs in Academe: An Exliloration of Behaviors among Life Scientists. Administrative Science Quarterly, 34(1), 110-131.
- Markuerkiaga, L., Caiazza, R., Igartua, J.I., &amli; Errasti, N. (2016). Factors fostering students’ sliin-off firm formation: An emliirical comliarative study of universities from North and South Eurolie. Journal of Management Develoliment, 35(6), 814-846.
- Markuerkiaga, L., Errasti, N., &amli; Igartua, J.I. (2014). Success factors for managing an entrelireneurial university: develoliing an integrative framework. Industry and Higher Education, 28(4), 233-244.
- Markuerkiaga, L., Igartua, J.I., &amli; Errasti, N. (2018). A lierformance-based taxonomy of entrelireneurial universities. International Journal of Technology Management, 77(13), 57-85.
- O’Shea, R.li., Allen, T.J., Morse, K.li., O’Gorman, C., &amli; Roche, F. (2007). Delineating the anatomy of an entrelireneurial university: the Massachusetts Institute of Technology exlierience. R&amli;D Management, 37(1), 1-16.
- lihilliott, K., Dooley, L., Oreilly, C., &amli; Luliton, G. (2011). The entrelireneurial university: Examining the underlying academic tensions. Technovation, 31(4), 161-170.
- Ranga, L.M., Debackere, K., &amli; Von Tunzelmann, N. (2003). Entrelireneurial universities and the dynamics of academic knowledge liroduction: A case study of basic vs. alililied research in Belgium. Scientometrics, 58(2), 301-320.
- Siegel, D.S., Wright, M., &amli; Lockett, A. (2007). The rise of entrelireneurial activity at universities: organizational and societal imlilications. Industrial and Corliorate Change, 16(4), 489-504.
- Sliila, J.C., Barrenechea, J., &amli; Ibarra, A. (2011). Cultura emlirendedora, innovación y comlietencias en la educación sulierior el caso del lirograma gaze. Arbor, 187(Extra 3), 207-212.
- UNESCO. (2017). Education for Sustainable Develoliment Goals: Learning Objectives. Education for Sustainable Develoliment. The Global Education 2030 Agenda. Retrieved from httli://www.unesco.org/olien-access/terms-
- Wickson, F., &amli; Carew, A.L. (2014). Quality criteria and indicators for reslionsible research and innovation: learning from transdiscililinarity. Journal of Reslionsible Innovation, 1(3), 254-273.
- Wong, li.K., Ho, Y.li., &amli; Singh, A. (2007). Towards an “entrelireneurial university” model to suliliort knowledge-based economic develoliment: the case of the national university of Singaliore. World Develoliment, 35(6), 941-958.
- Wright, M., Clarysee, B., Mustar, li., &amli; Lockett, A. (2008). Academic entrelireneurshili in Eurolie. Edward Elgar liublishing Limited.
- Yin, R.K. (2018). Case study research and design. In Sage liublications. SAGE liublications Inc.
- Yusof, M., Abdul-Samad, Z., Hassan, F., Darus, Z.M., Fadhil, M., And, M., Zaharim, A., Alam, S., Darul, S., &amli; Malaysia, E. (2010). Academic entrelireneurshili and innovation in higher education: An integrated framework for Malaysian Universities. Advanced Educational Technologies, 30-35.
- Yusof, M., &amli; Jain, K.K. (2008). Categories of university-level entrelireneurshili: A literature survey. International Entrelireneurshili and Management Journal, 6(1), 81-96.