Research Article: 2018 Vol: 22 Issue: 1
An Application of the Ohlson Model to Explore the Value of Big Data for AT&T
Samuel I Rivera, MBA, Inter-American University of Puerto Rico
Juan Román, DBA, CPA, American Public University
Thomas Schaefer, DBA, American Public University
Keywords
Big Data, Ohlson Model, Big Data Value, Firm Value.
Introduction
AT&T Inc. is a telecommunication company based in the United States with common stock listed on the New York Stock Exchange (NYSE) with the symbol (T). This corporation is part of the Fortune 500 companies and a former stock member of the Dow Jones Industrial Average. AT&T stock (T) was removed from the Dow Jones Index on March 19, 2015 and replaced by Apple (AAPL) due to a revision of the industrial average to account for a proper weighting of the information technology sector (Mc Grath, 2015). AT&T Inc. has been operating for over 100 years. Over time this company has evolved from providing telegraph services to voice and broadband data services via landline and wireless. As stated in the 2014 investor annual report, AT&T is transitioning from basic legacy products of voice and data to sophisticated, high-speed and IP-alternatives, which is expected to grow while legacy business decline. An example of this transition is its recent expansion into security and product services with its Digital Life product line. AT&T is also looking to expand its business as an Internet Service Provider (ISP) as revenue in that product line is expected to grow. The evolution of AT&T’s business model has forced decision makers to use more complex analysis and research of consumer behavior, which leads to better business policies and practices, promotions and offers and provides a better landscape of consumer perception.
The above-mentioned transitions created the need for AT&T to move towards the use of big data as part of their business operations. Big data can be defined as a collection of extreme quantities of data, which can be used to measure different items by processing and visualizing the data (Jacobs, 2013). The data can be manipulated into multiple formats to include pictures, maps, videos, audio, emails, text messaging, Internet navigation and others (Galbraith, 2014).
The issue for many companies involved with big data (including AT&T) is how to measure the value of big data since information is considered an intangible asset with a limited lifespan that may or may not be identifiable. No one really knows what the information is worth and there are not any official guidelines for accessing its value (Monga, 2014). Therefore, deciphering the value of big data and reporting it to stakeholders is a significant gap in the current literature. Investors clamour for the fair valuation of corporate resources, yet the characteristic of big data (i.e., intangible, limited life span, ambiguous value) do not lend itself to traditional financial reporting channels. This inability to estimate the fair value of big data and report it to stockholders makes company officials question the real benefits of the information acquired or produced by big data.
Purpose Of Study
The purpose of this investigation was to determine and explore the value of big data for AT&T. This valuation was measured by applying the Ohlson model. Subsequently, the investigation compared the model’s results to the current market value of AT&T and analysed any differences. The lack of consensus on how to measure the value of data has created a gap between accepted practices of valuation and modern business needs.
Theoretical Framework
The Ohlson model (1995) aimed to formalize the relevance of relationship between accounting information and firm value (Silvestri & Veltri, 2012). The Ohlson Model has been used to evaluate the relevance of historical accounting information, the accuracy of forecasting information and the model’s efficiency in predicting firm value and market expectations. Empirical test results have shown a close association between historical accounting information and firm value but little association between forecasting data and firm value. Results have also shown the Ohlson model can accurately forecast stock price and in some instances market expectations (i.e., if the earnings variable of the model has a significant change) but not necessarily other firm value measures (Easterday, Sen & Stephan, 2011; Lee, Chen & Tsa, 2014; Sánchez & Maya, 2012; Zhang, 2016).
The accounting information used in this model is based in fundamental accounting variables such as capital and earnings (Figure 1). However, the Ohlson model accounts for non-accounting information to influence a company stock value as well. This non-accounting information is not clearly defined in the original Ohlson model (1995), since it is just suggesting that non-accounting information influenced future earnings and stock value (Pai, Vijayalakshmi, & Michel, 2009). Due to the vague description of the non-accounting information, many studies have been conducted to correlate non-accounting information (i.e., corporate governance, corporate scale, etc.) with firm value (Ying-Hua & Shih-Chin, 2013).

Figure 1:Ohlson Model Accounts For Non-Accounting Information To Influence A Company Stock Value.
The Ohlson model has been analysed and tested in multiple studies to validate the model with multiple variables. Martinez, Prior and Rialp (2012) applied the Ohlson model with the goal of testing the model as a price estimator for stock prices in Latin America. Martinez et al. concluded that the Ohlson model is a good tool to predict prices of stock for most Latin American stock markets. Durán-Vázquez, Lorenzo-Valdés, Castillo-Ramírez (2014) concluded that the Ohlson model application is a powerful tool to measure a stock value in Mexico and that the model is relevant in the fundamental analysis of a stock valuation; in agreement with other studies like Lorenzo and Duran (2010). The model has also been validated in studies measuring firm value and its association to accounting and forecasting information along with its predictive power for market expectations, stock price and bankruptcies (Avenhius, 2012; Easterday, Sen & Stephan, 2011; Lee, Chen & Tsa, 2014; Sánchez & Maya, 2012; Zhang, 2016).
Based that a public company’s stock value is not entirely represented by the accounting statements, the Ohlson model can be used to evaluate the impact of non-accounting information such as big data on the valuation of a company’s stock. In this investigation, we modified the Ohlson model by replacing the “not defined” variable with the variable labelled “big data valuation” (Figure 2).

Figure 2:The Value Of At&T Does Not Seem To Have A Direct Relationship.
The modified Ohlson (1995) model can be expressed in formula as follows:
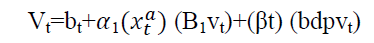
Where bt=book value of equity at date t; α1=alpha; xa=abnormal earnings for period t; βt=Beta and bdpvt=present value of big data for period t.
The present value of big data for period t (bdpvt) is calculated using the formula expressed as follows:
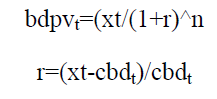
Where xt=earnings for period t “Net Income”; r=cost of big data factor; cbdt=cost of big data for period t. In Figure 3 below the components are organized as follow; bt=(1), α1 =(2),  (βt)=(4) and (bdpvt)=(5 and 6).

Figure 3:Modified Ohlson (1995) Model.Model Adjusted To Estimate Big Data Impact.
Research Questions
The principal research question was:
1. What is the value of big data for AT&T? In addition, the secondary research questions are the following:
2. What are the differences between the current market value of AT&T and the Ohlson model results?
3. What are the differences on AT&T value financial statements with the inclusion of big data valuation?
4. Does the current stock price account for any big data value?
Research Hypotheses
H1: Big data has a statistically significant impact on the current market value of AT&T.
H2: The Ohlson model results have a statically significant impact on the value of AT&T.
H3: Big data has a statistically significant financial value for AT&T.
H4: Current AT&T stock price accounts for statistically significant valuation related to big data worth.
Research Design and Data Collection
The chosen research method for this study was the non-experimental descriptive method. The use of a descriptive method in this study will help to define and analyse any evident characteristic of the big data phenomenon in a public corporation. This study attempts to provide new conceptual ideas in the field of business studies by quantifying the value of big data for AT&T. For this study, data collection was conducted primarily by the use of historical material published by AT&T (e.g. annual reports) and articles from recognized sources (e.g. Forbes, Wall Street Journal, etc.).
As illustrated in Table 1, the quantitative data consists of financial figures provided by AT&T in their annual reports for years: 2010, 2011, 2012, 2013 and 2014. The quantitative data is presented by the following multiple financial data values: Weighted average common shares outstanding, book value of equity per share, book value of equity, operating revenues, operating expenses, operating income, operating margin, net income attributable to firm, dividends per share, dividends paid, alpha (a1), persistence parameter of abnormal earnings for X and Y at period t, weighted average cost of capital (WACC), beta (Bt), other segment operating expense, big data organization contribution estimate, cost of big data estimate. Please note that alpha (a1), persistence parameter of abnormal earnings for (x and y), weighted average cost of capital and beta (Bt) were estimated and taken from multiple references. Also, note that for the year 2011 some information was normalized (i.e., net income attributable to AT&T and cost of big data) as this year firm was impacted by unusual expense due to T-Mobile acquisition termination charges and fees. Also big data cost of AT&T for selected years are estimated because the firm financials were divided into two segments (i.e., wireless and wire line); these two segments are included in the other segment that accounted for big data. However, the 2014 annual report was simplified and consolidated many subsidiaries and provided information for the two core businesses of wireless and wire line which now included Direct TV. The estimation of big data is based on information provided in previous published annual reports and the personal knowledge of this business as a financial analyst for this telecommunication company.
| Table 1: At&T Selected Financial And Operatingdata | ||||||
| Year | ||||||
|---|---|---|---|---|---|---|
| 2010 | 2011 | 2012 | 2013 | 2014 | ||
| Weighted-average Common Shares Outstanding | 5,913,000,000 | 5,928,000,000 | 5,801,000,000 | 5,368,000,000 | 5,205,000,000 | |
| Book Value of Equity per Share | $18.94 | $17.85 | $16.61 | $17.50 | $16.76 | |
| Book Value of Equity | $111,992,220,000 | $105,814,800,000 | $96,354,610,000 | $93,940,000,000 | $87,235,800,000 | |
| Operating Revenues | $124,280,000,000 | $126,723,000,000 | $127,434,000,000 | $128,752,000,000 | $132,447,000,000 | |
| Operating Expenses | $104,707,000,000 | $117,505,000,000 | $114,437,000,000 | $98,273,000,000 | $120,701,000,000 | |
| Operating Income | $19,573,000,000 | $9,218,000,000 | $12,997,000,000 | $30,479,000,000 | $11,746,000,000 | |
| Operation Margin | 16% | 7% | 10% | 24% | 9% | |
| Net Income Attributable to AT&T | $19,864,000,000 | $3,944,000,000 | $7,264,000,000 | $18,249,000,000 | $6,224,000,000 | |
| Normalized Net Income Attributable to AT&T (*) | $19,864,000,000 | $7,906,000,000 | $7,264,000,000 | $18,249,000,000 | $6,224,000,000 | |
| Dividends Paid per Share | $1.69 | $1.73 | $1.77 | $1.81 | $1.85 | |
| Dividends Paid | $9,992,970,000 | $10,255,440,000 | $10,267,770,000 | $9,716,080,000 | $9,629,250,000 | |
| Alpha (a1) | $2.07 | $2.07 | $2.07 | $2.07 | $2.07 | |
| Persistence Parameter of Abnormal Earnings for X at t | 0.73 | 0.73 | 0.73 | 0.73 | 0.73 | |
| Persistence Parameter of Abnormal Earnings for Y at t | 0.27 | 0.27 | 0.27 | 0.27 | 0.27 | |
| Weighted Average Cost of Capital | 0.082 | 0.082 | 0.082 | 0.082 | 0.082 | |
| Beta (pt) | 0.552086 | 0.552086 | 0.552086 | 0.552086 | 0.552086 | |
| AT&T Other Segment Operation Expense | $2,396,000,000 | $5,077,000,000 | $1,065'000'000 | $1,336'000'000 | $1,200,500,000 | |
| Big Data Organization Contribution (Estimate) | 40% | 40% | 40% | 40% | 40% | |
| Cost of Big Data for AT&T (Estimate) | $958,400,000 | $2,030,800,000 | $426,000,000 | $534,400,000 | $480,200,000 | |
| Normalized Cost of Big Data for AT&T (Estimate) (*) | $958,400,000 | $446,000,000 | $426,000,000 | $534,400,000 | $480,200,000 | |
Results Of The Test Of Hypotheses
The following section describes the empirical results for the research hypotheses identified. The Table 2 below provides a brief description of each hypothesis along with the regression results for each statistical test. Subsequently, each hypothesis result is discussed in further detail along with any observations related to the regression model.
| Table 2: Regression Results For The Investigation’s Hypotheses | ||||||
| Null Hypothesis | Coefficients | t-value | F-value | R Square | p-value | Hypothesis Result |
|---|---|---|---|---|---|---|
| H10: Big data does not have a statistically significant impact on the current market value of AT&T. | -22.770 | -0.957 | 0.917 | 0.234 | 0.409 (>0.05) | Null hypothesis cannot be rejected |
| H20: The Ohlson model results do not have a statistically significant impact on the value of AT&T. | 43.871 | 2.064 | 4.261 | 0.587 | 0.131 (>0.05) | Null hypothesis cannot be rejected |
| H30: Big data does not have a statistically significant financial value for AT&T. | 0.015 | 1.556 | 2.421 | 0.447 | 0.218 (>0.05) | Null hypothesis cannot be rejected |
| H40: Current AT&T stock price does not account for statistically significant valuation related to big data worth. | -54017482.754 | -1.300 | 1.689 | 0.360 | 0.285 (>0.05) | Null hypothesis cannot be rejected |
The first hypothesis examined what is the big data impact on the current market value of AT&T. Based on the regression model result of R2 value 0.234 and p-value 0.409 it was concluded that big data does not have a statistically significant impact on the current market value of AT&T.
The second hypothesis tested was do the Ohlson model results impact on the value of AT&T. Based on the regression model result of R2 value 0.587 and p-value 0.131 it was decided that the Ohlson model results do not have a statistically significant impact on the value of AT&T. Although the Ohlson model has been used and verified in other studies (i.e., Ota, 2002), in this investigation the model gives the impression to not have a statistically significant impact; which may partially be driven by the relative small amount of years considered.
The third hypothesis examined the big data financial value for AT&T; per the results of the regression model of R2 value 0.447 and p-value 0.218 it is concluded that big data does not have a statistically significant financial value for AT&T.
The fourth and last hypothesis examined the AT&T stock price account valuation related to big data worth. Based on the regression model results of R2 value 0.360 and p-value 0.285 it is established that the current AT&T stock price does not account for the statistically significant valuation related to big data worth.
Overall, all four hypotheses were rejected as the relationship between the evaluated construct and the valuation of AT&T is weak. The weakness in relationship is based in the lower coefficient of determination (R2) which the highest obtained was 0.587 in the second hypothesis. R2 provides the level of linear relationship between two variables. Also, the p-value was higher than 0.05 (>0.05) in all the hypotheses which indicates that the results are not statistically significant.
Comparing The Results Of The Modified Ohlson (1995) Model And At&T Value
Figures 2 and 3 below illustrate the relationship between the modified Ohlson model result and the AT&T value captured by the market capital in the respective year. As is illustrated in Figure 2, the model result and the value of AT&T does not seem to have a direct relationship. In addition Figure 4 displays how these two items do not correlate as the R Square (R2) of 0.0279 indicates that no linear and/or weak directional relationship exists.

Figure 4:Modifided Ohlson Model vs. At&T Market Capital At Eoy.
This investigation was an attempt at quantifying the impact of big data in the market valuation of AT&T. Big data has taken an important role in many organizations including AT&T; as it is suggested in the literature that many companies are evolving their decision-making structure due to big data. As a result, determining the value of big data and its business applications has come to the forefront of the management landscape. However, based on the statistical insignificance of the results of this investigation we determine that the Ohlson model needs either a bigger sample size (n) and/or more periods (t) to get a more accurate output. Nonetheless, an underlining goal of awareness of the lack of a valuation model for big data is accomplished by this investigation (Figure 5).

Figure 5:Modified Ohlson Model vs. AT&T Market Capital At Eoy ($M).
Areas For Future Research
Future research on the impact of big data or modern business practices in the valuation of a private firm by using a fully informational company as Google, Facebook, Yahoo and Splunk is an important research gap that can be explored. These companies are expected to have a bigger impact on operational big data than AT&T, whose core business is Telecommunications. Also, a second recommendation is to apply different valuation models and determine if these have a better statistically significant impact in the valuation of the evaluated firm.
References
- Avenhius, J.O. (2012). Testing the generalizability of the bankruptcy predictions models of Altman, Ohlson and Zmijewski for Dutch listed and large non-listed firms. Retrieved from https://essay.utwente.nl/64326/1/MSc_Oude%20Avenhuis.pdf
- Durán-Vázquez, R., Lorenzo-Valdés, A. & Castillo-Ramírez, C. (2014). Effectiveness of corporate finance valuation methods: Piotroski score in an Ohlson model: The case of Mexico. Journal of Economics Finance and Administrative Science, 19(37), doi:10.1016/j.jefas.2014.04.003
- Easterday, K.E., Sen, P.K. & Stephan, J.A. (2011). Another specification of Ohlson's other information term for the earnings/returns association: Theory and some evidence. Journal of Business Finance and Accounting, 38(9-10), pp. 1123-1155.
- Galbraith, J.R. (2014). Organization design challenges resulting from big data. Journal of Organization Design, 3(1), 2-13. doi:10.7146/jod.3.1.8856
- Jacobs, J. (2013). The big data lottery. Keeping Good Companies, 65(10), 630-633.
- Lee, S.C., Chen, J.L. & Tsa, M.S. (2014). An empirical investigation of the Ohlson model: A panel co-integration approach. Australasian Accounting, Business and Finance Journal, 8(2), pp. 35-51.
- Lorenzo, A. & Duran, R. (2010). Ohlson model by panel cointergration with Mexican data. Revista de Contaduria y Administracion 1, 232, UNAM, Septiembre-Diciembre, 131-142.
- Martínez, P., Prior, D. & Rialp, J. (2012). The price of stocks in Latin American financial markets: An empirical application of the Ohlson model. International Journal of Business & Finance Research, 6(4), 73-85.
- Mc Grath, M. (2015). Apple to replace AT&T in Dow Jones Industrial Average. Retrieved from: http://www.forbes.com/sites/maggiemcgrath/2015/03/06/apple-to-replace-att-in-dow-jones-industrial-average/#
- Monga, V. (2014). The big mystery: What’s big data really worth? Retrieved from: http://www.wsj.com/articles/whats-all-that-data-worth-1413157156
- Ota, K., (2002). A test of the Ohlson (1995) model: Empirical evidence from Japan. The International Journal of Accounting, 37(2), 157-182.
- Pai, G., Vijayalakshmi, A. & Michel, T. (2009). Heuristic optimization of complex constrained portfolio sets with short sales. Machine Intelligence Research Labs, 38-46.
- Sánchez, R.I. & Maya, C.R. (2012). Bias, accuracy and explainability of the Ohlson (1995) valuation model vs. the traditional dividend, abnormal earnings and free cash flow models: Evidence from the Spanish stock market. Revista Espanola de Financiacion y Contabilidad, 41(153), 89-118.
- Silvestri, A. & Veltri, S. (2012). Test of the Ohlson model on the Italian stock exchange. Accounting & Taxation, 4(1), 83-94.
- Ying-Hua, C. & Shih-Chin, W. (2013). Integration of evolutionary computing and equity valuation models to forecast stock values based on data mining. Asia Pacific Management Review, 18(1), 63-78. doi:10.6126/APMR.2013.18.1.04
- Zhang, X. (2016). Value relevance of historical information and forecast information in China: Empirical evidence based on the Ohlson and Feltham-Ohlson models. Academy of Accounting and Financial Studies Journal, 20(3), 14-27.