Research Article: 2018 Vol: 22 Issue: 6
An Overview of U.S. Property-liability Insurer Earnings Management via Loss Reserves
In Jung Song, Hankuk University of Foreign Studies, Korea
Abstract
This study provides an overview of U.S. property-liability insurers’ earnings management using estimated liabilities for unpaid claims called loss reserves. With three aspects of loss reserves: direction, magnitude, and volatility, this paper compares insurer’s earnings management with real activity measurement and discretionary/non-discretionary accruals. The current literature suggests various incentives such as income smoothing, tax, financial weakness, regulatory scrutiny avoidance, contracts, capital markets, external monitoring and executive compensation motivations. In this paper, we offer not only a thorough review but also an empirical analysis to investigate those motivations and show consistent evidence with prior studies. Future researchers in this area will benefit from this paper as it merits its need and potential research areas to explore.
Keywords
Property-Liability Insurers, Insurance Accounting, Loss Reserves, Accounting Discretion, Earnings Management.
Introduction
Managerial accounting discretion is a critical issue in both accounting and insurance industry. While majority of studies on this subject is discussed in the accounting literature, a growing stream of literature uses the property and liability insurance industry as a perfect laboratory to investigate accounting discretion using insurer’s specific reserves called loss reserves.
Loss reserves are insurer’s estimated liabilities for unpaid claims. Under Statutory Accounting Principles (SAP)1, insurers are required to disclose the gradual settlement of claims over time and record all changes of the loss reserves estimates. As claims occur and are reported, insurers revise their original loss reserve estimates for each year. These revisions are known as “development”.
Comparing insurer’s loss reserve development to the initial estimate creates a direct measure of managerial accounting discretion which is widely used as a measure of earnings management in the insurance industry (Weiss, 1985; Petroni, 1992; Beaver et al., 2003; Eckles & Halek, 2010; Grace & Leverty, 2010:2012).
Watts and Zimmerman (1978) stated that earnings management occurs when managers have a discretionary behavior related to accounting numbers to maximize the value of the company. In fulfilling this object, managers may set loss reserve estimates relatively higher or lower for many reasons including earnings smoothing (Smith, 1980; Weiss, 1985; Grace, 1990; and Beaver et al., 2003, Lichtblau & Lindemann, 2004), tax purpose (Grace, 1990; Gaver & Peterson, 2001; Grace & Leverty, 2012), financial weakness (Petroni, 1992; Petroni & Beasley, 1996; Gaver & Paterson, 2004), regulatory scrutiny avoidance (Nelson, 2000; Petroni, 1992; Gaver & Paterson, 2004; Grace & Leverty, 2012), contracting motivations (DeAngelo et al., 1994; Jaggi & Lee, 2002), capital market (Teoh et al., 1998), external monitoring (Petroni & Beasley, 1996; Gaver & Patterson, 2001), and executive compensation incentives (Eckles & Halek, 2010; Eckles et al., 2011).
The implications of insurer’s earnings management affect shareholders, regulators, and rating agencies. These parties have an interest in knowing the integrity of financial reporting through loss reserve error direction, magnitude, and variability. Shareholders and regulators often focus on loss reserve as it may reflect the financial weakness of a firm (Petroni, 1992; Nelson, 2000). Also, rating agencies appear to consider reserve error variability when they assign the insurer ratings (Carson et al., 2016).
This paper provides an overview of property and liability insurer earnings management using insurer’s loss reserves. The next section defines insurer’s loss reserve in details and how other areas explain earnings management. Then insurer earnings management calculations such as loss reserves direction, magnitude, and variability are introduced. Also, real activity measurement and discretionary/non-discretionary accruals are compared. The following section thoroughly discusses motivations, incentives, and outcomes of insurer’s loss reserves in the literature. This paper then suggests the potential research areas and the last section concludes.
Loss Reserve
Definition
Loss reserves, the insurer’s estimated liability for unpaid claims, normally are the largest liability item on a property and liability insurer’s balance sheet. National Association of Insurance Commissioners (NAIC) mandates all insurance companies to follow accounting procedures under Statutory Accounting Principles (SAP), insurers report their loss reserves amount on firm’s annual statutory filings on Part 2 of Schedule P. An excerpt from Schedule P of AllState can be found in Tables 1 and 2. Table 1 is reported in raw numbers while Table 2 is reported in percentage scale. These data are used to construct the loss reserve error for firm i for year t.
| Table 1 Excerpt From Schedule P-Part 2 (Raw Data) |
||||||||||
| Excerpt from the 2014 Annual Statement of Allstate Co. NAIC Property-Liability Annual Statement: Schedule P- Part 2- Summary Incurred Net Losses and Defense and Cost Containment Expenses Reported at Year End ($000 omitted) | ||||||||||
| 1 | 2 | 3 | 4 | 5 | 6 | 7 | 8 | 9 | 10 | 11 |
| Accident year | 2005 | 2006 | 2007 | 2008 | 2009 | 2010 | 2011 | 2012 | 2013 | 2014 |
| 2005 | 6,272,478 | 5,990,778 | 5,939,564 | 6,017,995 | 6,018,642 | 6,011,589 | 6,031,622 | 6,011,793 | 5,993,376 | 5,982,286 |
| 2006 | 3,117,831 | 3,180,001 | 3,155,815 | 3,146,762 | 3,105207 | 3,116,859 | 3,119,816 | 3,110,894 | 3,103,433 | |
| 2007 | 3,559,936 | 3,582,914 | 3,454,441 | 3,397,649 | 3,372,169 | 3,371,113 | 3,360,762 | 3,360,377 | ||
| 2008 | 5,123,413 | 5,015,695 | 5,004,200 | 4,994,097 | 4,983,896 | 4,972,306 | 4,971,199 | |||
| 2009 | 4,485,357 | 4,493,276 | 4,429,414 | 4,410,022 | 4,399,809 | 4,394,878 | ||||
| 2010 | 4,513,807 | 4,469,395 | 4,416,695 | 4,400,742 | 4,394,778 | |||||
| 2011 | 5,546,676 | 5,399,445 | 5,361,817 | 5,353,291 | ||||||
| 2012 | 4,026,652 | 4,103,588 | 4,109,686 | |||||||
| 2013 | 3,215,898 | 3,290,189 | ||||||||
| 2014 | 3,758,984 | |||||||||
Note: This table shows the raw data from 2014 Annual National Association of Insurance Commissioners’ (NAIC) annual statutory filing of Allstate Co. Schedule P-Part 2. A firm’s reserve error is calculated by incurred losses in year t minus incurred losses in year t+n, IncurredLossest–IncurredLossest+n, where n=5. At the end of 2009, estimated losses for all years up to and including 2009 totaled $22,120,897 million (the sum of the italicized values in Part 2, column 6–2009). By the end of 2014, the estimate for the same loss period had been increased to $21,812,173 million (the sum of the italicized values in Part 2, column 11–2014). To capture the revised estimate 5 years in the future, annual statement data from 2001 is used. Initial over- (under-) reserving yields a positive (negative) reserve error since the revised estimate of total losses incurred 5 years in the future is greater (less) than the initial estimate. Accordingly, reserve error for Allstate Co. in 2009 is $308,724 million ($22,120,897 million minus $21,812,173 million), indicating that Allstate Co. overestimated their reserves by $308,724 million.
| Table 2 Excerpt From Schedule P-Part 2 (Percentage Data) |
||||||||||
| Excerpt from the 2014 Annual Statement of Allstate Co. NAIC Property-Liability Annual Statement: Schedule P-Part 2 Summary Incurred Net Losses and Defense and Cost Containment Expenses Reported at Year End ($000 omitted) | ||||||||||
| 1 | 2 | 3 | 4 | 5 | 6 | 7 | 8 | 9 | 10 | 11 |
| Accident year | 2005 | 2006 | 2007 | 2008 | 2009 | 2010 | 2011 | 2012 | 2013 | 2014 |
| 2005 | - | -4.4910% | -0.8549% | 1.3205% | 0.0108% | -0.1172% | 0.3332% | -0.3288% | -0.3063% | -0.1850% |
| 2006 | 1.9940% | -0.7606% | -0.2869% | -1.3206% | 0.3752% | 0.0949% | -0.2860% | -0.2398% | ||
| 2007 | 0.6455% | -3.5857% | -1.6440% | -0.7499% | -0.0313% | -0.3070% | -0.0115% | |||
| 2008 | -2.1025% | -0.2292% | -0.2019% | -0.2043% | -0.2325% | -0.0223% | ||||
| 2009 | 0.1766% | -1.4213% | -0.4378% | -0.2316% | -0.1121% | |||||
| 2010 | -0.9839% | -1.1791% | -0.3612% | -0.1355% | ||||||
| 2011 | -2.6544% | -0.6969% | -0.1590% | |||||||
| 2012 | 1.9107% | 0.1486% | ||||||||
| 2013 | 2.3101% | |||||||||
| 2014 | - | |||||||||
Note: This table reports the percentage data from 2014 Annual National Association of Insurance Commissioners’ (NAIC) annual statutory filing of Allstate Co. Schedule P-Part 2. Table 2 is constructed using the raw data from Table 1. In year 2009, estimated loss changed from $6,017,995 million in 2008 to $6,018,642 million in 2009 is shown as a percentage change of 0.0108% for an accident year of 2005. Similarly, in year 2009, estimated loss changed from $3,155,815 million in 2008 to $3,146,762 million in 2009 is shown as a percentage change of -0.2869% for an accident year of 2006.
Estimation of loss reserves is not solely a formulaic process.2 Rather it requires subjective consideration and managerial judgement. In general, a firm’s actuaries suggest a recommended range of acceptable loss reserves with management choosing the ultimate loss reserve amount for a given year.3
Each year, insurers re-estimate prior years’ loss estimates to reflect actual payments made and any changes in estimates as claims occur and are reported. Insurers update their original loss reserve estimates for each year and call it development. Sometimes losses are overestimated and sometimes losses are underestimated. Whether or not loss reserves are initially underestimated or overestimated can be determined over time.4 These over and under estimates of future losses are estimation errors and are referred to as reserve errors.
Figure 1 illustrates insurer’s loss reserve error trends by year using all property-liability insurance companies in U.S. from 1996 to 2014. Panel (A) represents reserve error scaled by assets while Panel (B) represents reserve error scaled by developed reserves. We can notice that insurer’s reserve errors are concentrated around zero generally ranged from -1 to 1.5
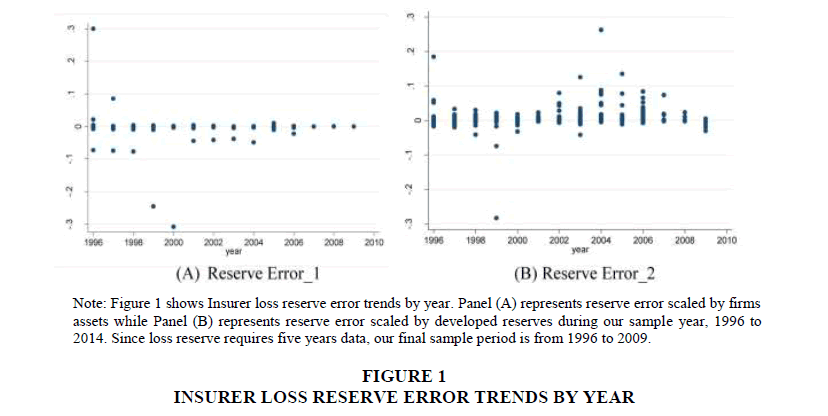
Figure 1: Insurer Loss Reserve Error Trends By Year
Three aspects of insurer’s managerial accounting discretion using loss reserves are: direction, magnitude, and variability. Reserve error direction shows if insurers initially overreserved or underreserved while magnitude indicates the size of reserve error. The bigger the size, the larger the error is. In addition to the size and direction of the reserve error, the variability of an insurers reserve errors is also informative. Higher loss reserve error variability suggests inconsistency of reserve errors and uncertainty of firm information whereas lower loss reserve error variability suggests consistency of error and more certainty of firm information. Most of existing studies deal with insurers reserve error direction and size (Grace, 1990; Petroni, 1992; Gaver & Paterson, 2001:2004; Beaver et al., 2003; Eckles & Halek, 2010; and Eckles et al., 2011; Grace & Leverty, 2012) although variability is recently introduced as a new type of risk called information risk (Eckles et al., 2014; Carson et al., 2016). Table 3 illustrates the descriptive statistics for U.S. property and liability insurer loss reserve error with respect to its direction, magnitude, and variability.
| Table 3 Descriptive Statistics For Insurer Loss Reserve Direction, Magnitude, And Variability |
||||
| Mean | Std. Dev. | Min | Max | |
| Reserve Error_1i,t | 0.0000159 | 0.0028579 | -0.3076422 | 0.3003923 |
| Reserve Error _2i,t | 0.0000797 | 0.0029726 | -0.2832222 | 0.2633334 |
| Abs (Reserve Error _1i,t) | 0.0000926 | 0.0028565 | 0.0000 | 0.3076422 |
| Abs (Reserve Error_2i,t) | 0.0001995 | 0.0029669 | 0.0000 | 0.2832222 |
| Vol (Reserve Error_11i,t) | 0.0000936 | 0.0027205 | 0.0000 | 0.2452254 |
| Vol (Reserve Error _21i,t) | 0.0003013 | 0.0040569 | 0.0000 | 0.232587 |
| Vol (Reserve Error _12i,t) | 0.0001776 | 0.0041783 | 0.0000 | 0.2686476 |
| Vol (Reserve Error _22i,t) | 0.0005747 | 0.0060134 | 0.0000 | 0.2542521 |
Note: This table describes insurer’s loss reserve with respect to its direction, magnitude, and variability. In total there are 3,508 (3,181) unique insurers with 38,301 (34,148) firm-year observations for Reserve Error_1 (Reserve Error_2). A firm’s reserve error direction is calculated by incurred losses in year t minus incurred losses in year t+5, scaled by total assets (Reserve Error_1) and scaled by developed reserve (Reserve Error_2). A firm’s reserve error magnitude is measured by the absolute value of firm’s reserve error. Abs (Reserve Error_1) is the absolute value of firm’s reserve error scaled by assets and Abs (Reserve Error_2) is the absolute value of firm’s reserve error scaled by developed reserves. A firm’s reserve error variability is measured by standard deviation of firm’s reserve errors for three and five years. Vol (Reserve Error_11) is the three-year standard deviation of firm’s reserve errors scaled by firm’s assets and Vol (Reserve Error_12) is the five-year standard deviation of firm’s reserve errors scaled by firm’s assets. Similarly, Vol (Reserve Error_21) is the three-year standard deviation of firm’s reserve errors scaled by firm’s developed reserves and Vol (Reserve Error_22) is the five-year standard deviation of firm’s reserve errors scaled by firm’s developed reserves.
Other Measures
In accounting literature, earnings management relies on estimates of unexpected or abnormal accruals based on regression residuals (Jones, 1991; Burgstahler & Dichev, 1997; Degeorge et al., 1999). Fundamentally, firm’s total accruals, the difference between reported net income and cash flows from operations, are regressed on various variables and unexpected accruals are thus the residual components of total accruals.6
Studies of bank loan loss provisions are similar but more focused on a strategic timing of the realization of gains/losses on investment securities (Moyer, 1990; Wahlen, 1994; Beatty et al., 1995; Collins et al., 1995; Liu et al., 1997). Another approach using deferred tax valuation allowance is severely criticized by Visvanathan (1998) since it easily fails to forecast tax benefit that is unexpected to be used. He finds a little evidence of earnings management using deferred tax valuation allowances.
Several articles introduce real activity manipulation as a proxy for earnings management instead of accruals-based strategies. The advantage of using real activities is that it requires less regulatory and audit scrutiny than accruals (Gunny, 2010). However, some studies oppose to real activities because it is accomplished by changing the firms underlying operations and managers sacrifice future cash flows for current period income such as research and develop expenditures. Sales pricing, cost reduction, and overproduction are some examples.
This paper examines the insurance industry as it provides an excellent setting to study managerial accounting discretion not only because it offers a relatively homogeneous sample of firms but also because insurer-specific accruals i.e., loss reserves to measure the actual error in accruals. Insurer loss reserve is a robust measure of earnings management with numerous advantages over other measures traditionally used in other areas (McNichols, 2000).
Earnings Management Calculations
Accuals-based measurement
Jones (1991) model measures firm’s total accruals as the difference between reported net income and cash flows from operations. It has both discretionary and nondiscretionary accruals. However, nondiscretionary component of accruals can be easily identified using Ordinary Least Square (OLS) regression-based estimates of current accruals on the change in sales from the previous year for all non-sample firms.
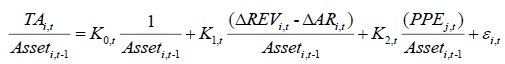 (1)
(1)
Where, TA is firm i’s total accruals in year t, Assets is firm i’s total asset in year t, ΔREV is a change in revenues and ΔAR is a change in accounts receivable. PPE denotes firm’s gross value of property plant and equipment in year t. Parameters from Equation (1) are then used to estimate normal level of accruals (NA) as follows.
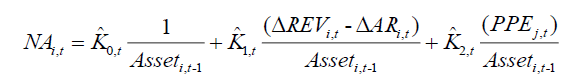 (2)
(2)
Then abnormal accruals (AM) are the difference between the actual value of total accruals and normal level of accruals. Accounting literature frequently uses unexpected or abnormal accruals based on regression residuals (Jones, 1991; Burgstahler & Dichev, 1997; Degeorge et al., 1999) while insurance industry uses insurer’s specific accruals estimation error, loss reserves. There are three aspects when calculating insurers loss reserves: direction, magnitude, and variability.
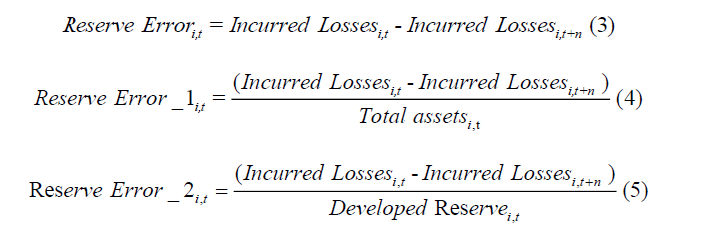
Direction: First and foremost, insurer loss reserve errors are measured as the initial loss reserve estimates in year t minus the total incurred losses in year t+n where n equals to 5 (Grace, 1990; Petroni, 1992; Gaver & Paterson, 2001:2004; Beaver et al., 2003; Eckles & Halek, 2010; and Eckles et al., 2011; Grace & Leverty, 2012). Reserve error direction calculation is shown in Equation (3). As shown in Table 1, we construct reserve errors by taking the sum of the bold values in column 6 and subtract from that total the sum of the bold values in column 11. The difference is the five-year reserve error, which is $308,724 million.7
The reserve error is positive if an insurer over-reserved and negative if an insurer underreserved, in this example, Allstate over-reserved in 2009. Figure 2 represents the density function of insurer’s loss reserve error direction using all property and liability insurance companies in U.S. from 1996 to 2014. Panel (A) refers to the density function of reserve error scaled by assets and Panel (B) represents the density function of reserve error scaled by developed reserves. The errors are concentrated around zero. Two scaling factors, total assets and developed reserves, are presented in Equation (4) and (5) correspondingly.
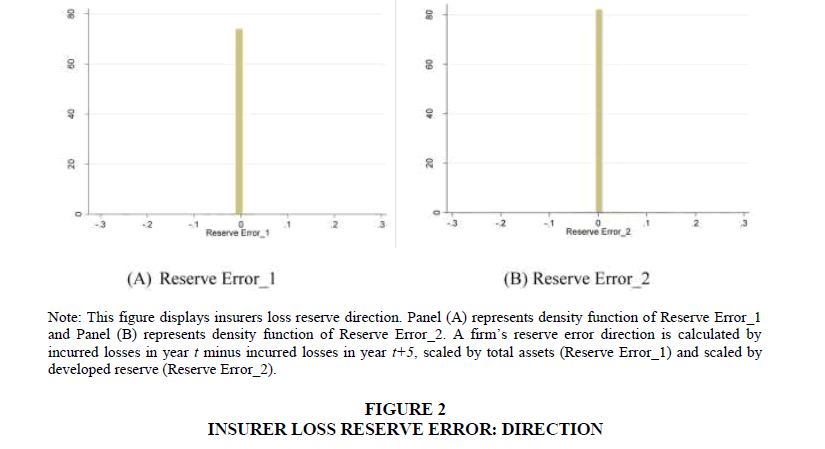
Figure 2: Insurer Loss Reserve Error: Direction
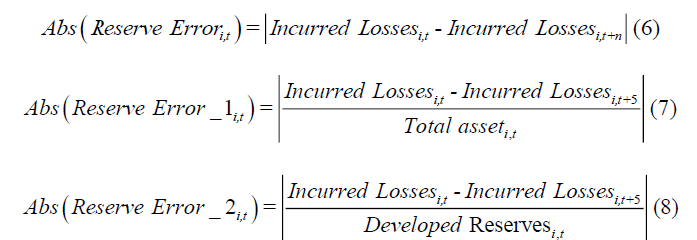
Magnitude: In addition to reserve error direction, the size of reserve error is also an important issue to consider. This type of error is measured as the absolute value of initial loss reserve estimates in year t minus the total incurred losses in year t+n where n equals to 5 as shown in Equation (6). By taking an absolute value, the degree of reserve error can be measured regardless of whether insurer underestimate or overestimate. This obtained degree represents the insurers earnings management size. The bigger the absolute value of reserve error difference, the more earnings management insurers involve in. In opposite, the smaller the absolute value of reserve error difference, the less earnings management insurers involve in. Likewise, we use total assets and developed reserves as scaling factors in Equation (7) and (8). The density functions of the magnitude of reserve errors are shown in Figure 3. Panel (A) refers to the density function of reserve error scaled by assets and Panel (B) represents the density function of reserve error scaled by developed reserves. Because the original distribution function is positively skewed, we take a logarithm function to its value.
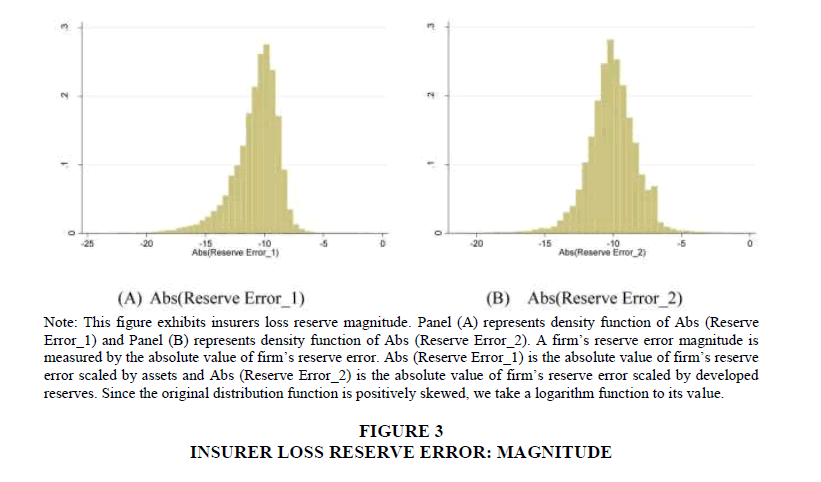
Figure 3: Insurer Loss Reserve Error: Magnitude
Variability: Lately, the variability of an insurer’s loss reserve errors gets researchers’ attention. It can be obtained as the standard deviation of reserve error over certain years as indicated in Equation (9) and (10).8 Insurers reserve error variability can be considered as firm’s information risk which refers to the potential for inaccurate or incomplete firm information (Eckles et al., 2014). High loss reserve error variability suggests inconsistency of reserve errors and uncertainty of firm information and thus relatively high information risk. Conversely, low loss reserve error variability suggests consistency of error and more certainty of firm information and therefore relatively lower information risk. Recent study finds evidence that rating agencies appear to consider reserve error variability when they assign the insurer ratings and results in rating penalty (Carson et al., 2016).
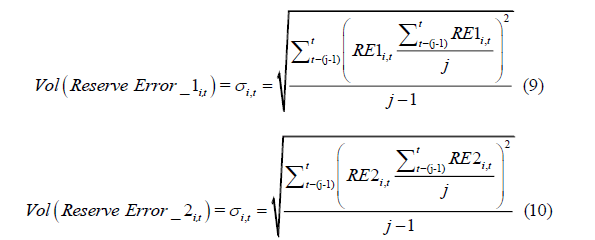
Figure 4 exhibits the density function of insurer’s loss reserve variability. Panel (A) and represents the density functions of three-year standard deviation of firm’s reserve errors scaled by firm’s assets, Vol (Reserve Error_11), and five-year standard deviation of firm’s reserve errors scaled by firm’s assets, Vol (Reserve Error_12). Panel (C) and (D) represent the density functions of three-year standard deviation of firm’s reserve errors scaled by firm’s developed reserves, Vol (Reserve Error_21), and five-year standard deviation of firm’s reserve errors scaled by firm’s developed reserves, Vol (Reserve Error_22). We take a logarithm function to its original distribution since it is positively skewed.
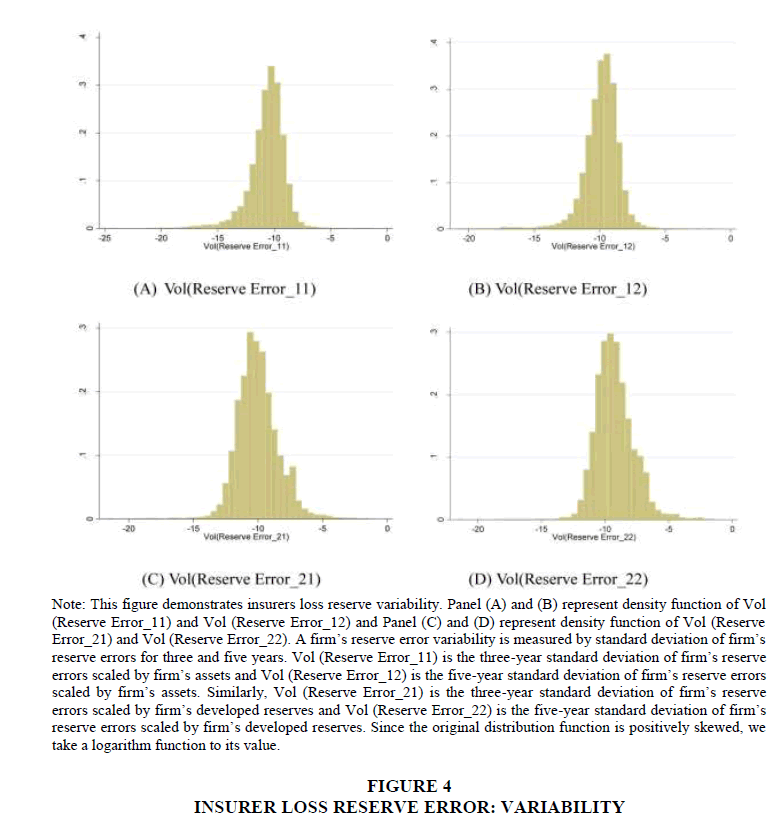
Figure 4: Insurer Loss Reserve Error: Variability
Real-Activity Measurement
Another method to measure earnings management is using real activity. Real activity management is defined as a management that deviates from normal business practices undertaken with the main goal of achieving certain earnings through manipulation on operating cash flow, expenses and costs. Firms can involve in earnings management by price discount (Roychowdhury, 2006), overproduction of lower Cost of Goods Sold (COGS) scale (Lin, Radhakrishnan & Su, 2006; Roychowdhury, 2006), advertisement, and/or reduction and Research and Develop (R&D) expenditures (Cohen et al., 2008).
Mangers prefer real activity manipulation to accruals based manipulation because accruals are more likely to get regulatory and audit scrutiny (Gunny, 2010) although it is often criticized because it may change firms underlying operations and requires some sacrifices. Also, it may decrease profitability and valuation of the firm (Cohen & Zarowin, 2010) in a long run. Roychowdhury (2006) measures operating cash flow as below.
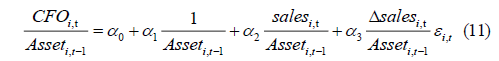
Where, CFO is firm i’s operating cash flow in year t. Asset is prior year total assets and ΔSales is a change in sales for a firm i in year t. This normal cash flow is then subtracted from the actual cash flow to obtain abnormal cash flow. Further we estimate Cost of Goods Sold (COGS) and inventory (ΔINV) based on the following regressions.
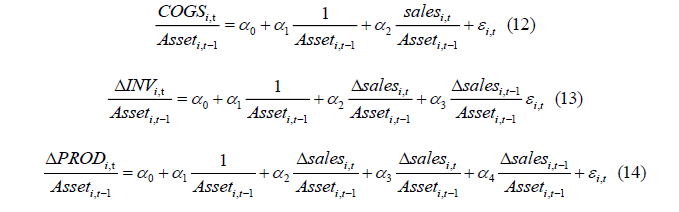
Where, COGS is firm i’s cost of goods sold in year t. ΔINT is the change in inventory in year t. Other variables are previously defined. ΔPROD is a sum of the COGS and ΔINV from Equation (12) and (13).
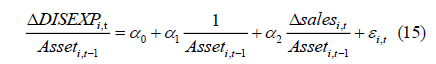
Also, a firm may involve in earnings management by reducing discretionary expenses including R&D expenditures or advertising expenses. Then normal discretionary expense can be measured as in Equation (15) with ΔDISEXP, the change in discretionary expense, and then compute the abnormal discretionary expense previously. Normally, real activity is considered the above procedures together as an aggregate measure.
Discretionary vs. Non-discretionary
Earnings management has both discretionary and non-discretionary parts. Discretionary accruals are related to adjustment to cash flows carried out by managers while non-discretionary accruals are related to adjustments to the companies’ cash flows stated by accounting standard. Conventional measure to distinguish these two are using regression residuals (Jones, 1991) and firms current working capital accruals that are abnormal compared to industry peer (Dechow et al., 1995; Teoh et al., 1998a:1998b).
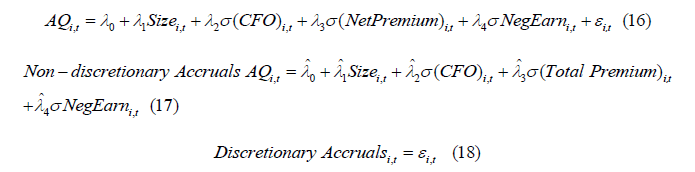
In insurance industry, similar methodology is adopted to the insurance context according to Eckles et al. (2014) which estimates the following regressions. For firm i in year t, AQi,t, is a measure of accruals quality, Sizei,t, is the log of total admitted assets, σ(CFO)i,t is the standard deviation of firm i’s operating cash flows, σ(NetPremium)i,t is the standard deviation of firm i’s net premiums written, and NegEarni,t, is the number of times firm i reported negative earnings. Then, it decomposes AQ into its non-discretionary and discretionary components.
Insurers’ loss reserves are not entirely reflecting managerial manipulation but partially due to the random formulaic errors during computational process such as Chain Ladder Method (CLM). Eckles et al. (2011) suggest using firm-level fixed effect in the empirical testing to control for this unintended estimation errors.
Having actuaries present a reliable range of adequate loss reserve estimates, insurers perform managerial discretion choosing the actual loss reserve via its direction, magnitude and variability to achieve firms’ various objectives.
Motivations, Incentives, and Outcomes
Since the 1970s, a rich body of literature on managerial accounting discretion has developed. As stakeholders use information on firm’s accounting statements to make decisions, managers have several earnings management motivations as follows.
Earnings smoothing
Earlier studies find that insurance companies use loss reserve management to smooth their income (Weiss, 1985; Grace 1990). The idea of “income smoothing” is that firms can manage reserves to make earning appear more consistent over time. Weiss (1985) shows a negative relation between insurance companies’ underwriting profitability measured by the inverse of the combined ratio and the loss reserve errors. With U.S. automobile liability lines, she indicates that insurance companies tend to (over) underreserve when profits are (high) low. Grace (1990) further finds that firms’ average income over the past three years scaled by premiums earned is positively related to under-reserving. With non-insurance company’s data, Burgstabler & Dicbev (1997) show evidence that firms with small pre-managed earnings decreases exercise discretion to report earnings increases and firms with slightly negative premanaged earnings exercise discretion to report positive earnings which is consistent with earnings smoothing motivation.
Distribution of earnings also matters. Beaver et al. (2003) investigate insurer reserving practices across the entire distribution of earnings. They sort earnings into four categories: large negative earnings, small negative earnings, small positive earnings and large positive earnings. They conclude that insurers in the left tail of the earnings distribution under-state reserves relative to those in the right tail of the earnings distribution. Grace & Leverty (2010) support the same outcomes and Chaney & Lewis (1995) use a valuation model that demonstrates high-value firms smooth income and involve in income-increasing accounting activities relative to other firms using non-insurance company’s data.
Financial weakness/insolvency
Firms may understate their loss reserve during periods of financial weakness (Petroni, 1992; Petroni & Beasley, 1996; Gaver & Paterson, 2000:2004). In general, financial weakness is measured using Insurance Regulatory Information System (IRIS) ratio.9 Petroni (1992) and Gaver & Paterson (2004) study whether firms manage loss reserves to avoid triggering a fourth IRIS ratio violation because violating the fourth ratio may lead to increased regulatory intervention. Both studies find evidence that insurer that are close to violating a fourth IRIS ratio tend to under-reserve to prevent violating four or more ratios. Grace & Leverty (2012) argue that IRIS ratio may not be a decent measure because firms under-reserving is not necessarily solely to avoid regulatory scrutiny. Thus, they rather use the probability of insolvency as an alternative measure of financial weakness and find evidence that weak insurer’s under-reserve which is a consistent with prior studies.
Tax
Generally, insurer’s loss reserves are pre-tax deductions from their earnings. By overestimating future losses to current premiums, insurers can increase its reserves thus reduces associated tax liability. In this way, insurers can postpone the tax payments until future periods when final losses are realized. Grace (1990) finds that insurers overreserve to minimize their tax burden and Petroni (1992) and Eckles & Halek (2010) show insurers overreserve to delay its current tax liability.
There are two ways to measure tax incentive. First, Grace (1990) introduces Tax Shield as an insurer’s net income plus developed reserves, scaled by assets whereas other studies (Petroni, 1992; Nelson 2000) use indicator variable which is one if the insurer has a high tax rate, and zero otherwise. Other academic areas also find equivalent results using non-insurance companies (Boynton et al., 1992; Maydew, 1997; Calegari, 2000; Poterba et al., 2007)
Rate regulation
Several studies examine whether regulatory scrutiny increases the likelihood of earnings management. Jones (1991) showed that firms defer income when seeking import relief and Cahan (1992) finds that firms under investigation for anti-trust violations report incomedecreasing abnormal accruals.
Insurers also involve in earnings management using loss reserves to avoid regulatory scrutiny. Firms’ incentive regarding their insolvency regulation is discussed previously.10 Another regulatory scrutiny that insurers are subjected to is rate regulation. Nelson (2000) demonstrates that firms subject to stringent rate regulation under reserve to convince regulators that they can charge a lower price. Conversely, Grace & Leverty (2010) propose that strictly regulated firms tend to over reserve to persuade regulator that higher rates are required to continue offering insurance which is an opposite hypothesis to Nelson (2000). Grace & Leverty (2010) claim that this may be a result of rate regulation suppressing prices below the cost of providing insurance in certain states and lines.
Capital markets
Managers have incentives to manipulate earnings to influence the current capital markets (Teoh et al., 1998a:1998b; Erickson & Wang, 1999; Myers et al., 2007). Mikhail et al. (1999) and Ball & Shivakumar (2005) argue that private companies experience higher asymmetry information and lower monitoring thus they involve in more earnings manipulation than public companies.
Property-liability insurers are composed of three types of ownership structure: publicly traded stock company, privately-held stock company, and mutual company. Stock companies are owned by stockholders while mutual companies’ owners are policyholders. Beaver et al. (2003) indicate that public and mutual companies manage reserves to avoid loss, but they find no evidence for privately held stock companies.
Other studies focus on timing of capital market such as initial public offers, seasoned equity offer, and acquisitions. Teoh et al. (1998a) show that managers’ increase reported earnings close to Initial Public Offerings (IPOs). Also, this happens similarly with seasoned equity offers (Teoh et al., 1998b). Earning management in the capital markets is also used to beat or meet analysts’forecasts (Burgstahler & Dichev, 1997; Graham et al., 2005; Lee et al., 2006; Keung et al., 2010) and to help management buyouts by understating earnings (DeAngelo et al., 1994).
Executive compensation
Another important incentive of earnings management is manager’s compensation. Managers are willing to engage in earnings manipulation to increase their compensation or bonus plans (Healy, 1985; Gaver et al., 1995; Holthausen et al., 1995; Shuto, 2007). Using noninsurer data, Gaver et al. (1995) show evidence that managers below the bonus threshold engage in income-increasing discretionary accruals as opposed to “taking a bath”.11
Insurance industry also links earnings manipulation to executive compensation (Browne et al., 2009; Eckles & Halek, 2010; Eckles et al., 2011). Browne et al. (2009) investigate whether managers have an incentive to manipulate reserves if they receive a higher level of equity compensation. They show evidence that managers who have more exposure to movements in stock price engage in income-increasing discretion although executive long-term incentive plans do not influence. Eckles & Halek (2010) argue that managers manipulate reserves to increase their compensation through bonus pay. Specifically, they find that managers of firms that are ineligible for a bonus tend to over resereve while managers receiving bonuses tend to under reserve. They also show that managers holding more restricted stock tend to under reserve to inflate earnings to sell their restricted stocks. Moreover, Eckles et al. (2011) inspect whether the earnings management in the insurance industry may be tempered by stronger governance board structure. In addition to finding a consistent relation with earnings management and executive compensation as Eckles & Halek (2010), they conclude that strong governance can mitigate the ability of managers to manipulate their reserve. In a corporate governance setting, Achleitner et al. (2014) show that family firms are more engaged in accrual manipulation than other firms.
Contracts
Although managers contracting motivation is not heavily discussed in the insurance literature, accounting literature examines firm’s earnings management with contracting motivations including debt covenants, dividend constraint, and lending contracts. Studies find that managers engage in earnings management to avoid violating lending contracts particularly those firms that are close to lending covenants (Healy & Palepu, 1990; DeAngelo et al., 1994). DeAngelo et al. (1994) investigate if firms close to dividend constraint change accounting estimates to avoid cutting dividends and find weak firms tend to manage cash flow by restructuring their contractual relations. Sweeney (1994) argues that managers’ incomeincreasing changes were made to reduce the likelihood of future covenant violations. Similarly, studies show that managers with debt covenants tend to manage earnings to avoid its cancellation or renegotiation (DeAngelo et al., 1994; Dechow et al., 1995; Jaggi & Lee, 2002).
External monitoring
Firms rely on the advice of a qualified auditor when reporting financial statements. Becker et al. (1998) shows that clients of non-Big Six auditors report income-increasing earnings more than clients of Big Six auditors.12 Big Six auditors usually offer highly conservative external monitoring services and are more attuned to the company’s liability exposures.
Using insurer’s data, Petroni & Beasley (1996) fail to find evidence that reserve accuracy differs among Big Eight auditors. Then Gaver & Patterson (2001) expand the parallel research questions as Petroni & Beasley (1996) with not only auditors but also actuaries as additional external monitors for insurers. Their results show that high quality auditing by Big Six auditors is not enough to mitigate reserve errors but under-reserving by weak insurers is eliminated when firms use auditors and actuaries that are both from Bix Six firms. Further, managerial accounting discretion can be constrained by the oversight provided by an independent auditor who depends on the advice of an external actuary according to Gaver & Patterson (2001).
Data And Methodology
Our initial data comes from National Association of Insurers Commissioners (NAIC) from 1996 to 2014.13 This is 19 years-long data.14 Consistent with the existing literature, we use a five-year estimation window to calculate incurred losses of insurance companies (Grace, 1990; Petroni, 1992; Beaver et al., 2003; Gaver & Paterson, 1994; Eckles & Halek, 2010; Eckles et al., 2011; Grace & Leverty, 2012). Thus, our final data to run the analysis is from 1996 to 2009. In total there are 3,508 (3,181) unique insurers with 38,301 (34,148) firm-year observations for Reserve Error_1 (Reserve Error_2). Table 3 demonstrates descriptive statistics for direction, magnitude, and variability of insurer loss reserve error. In general, insurers over-reserve on average.
This paper generally tests the above motivations using Ordinary Least Square (OLS) regression with adjusted standard errors for clustering with firm i in year t. It is a vector of year fixed effects, Jt is a vector of firm fixed effects and ε is a random error term.
REi,t is the 5-year reserve error scaled by either total assets or developed reserves. SMOOTHi,t is calculated as the average return on assets over the previous three years to proxy for earnings smoothing incentive (Grace, 1990). WEAKi,t, equals to 1 if an insurer has more than four unusual Insurance Regulatory Information System ratios (IRIS) and 0 otherwise (Petroni, 1992; Grace and Paterson, 2004). For tax purpose motivations, TAXi,t is included as the sum of net income and estimated reserve over total assets (Grace, 1900; Grace and Leverty, 2012). REGi,t is measured as a percentage of business written subject to stringent rate regulation (Nelson, 2000). PUBLICi,t is an indicator variable coded equal to one for public insurers and zero for private insurers and a proxy for capital market incentives while STOCKi,t is one for stock insurers and zero for mutual insurers which possible represents potential stock options and bonuses that managers receive. LEVERAGEi,t is a ratio of surplus to asset which refers to firm’s potential exposure to debt covenants. SIZEi,t is the natural logarithm of firm’s total assets serving as a rough proxy for external monitoring since “Big Four” accounting companies typically audit the almost of (i.e. 96%) all the companies in the FTSE 250 index.
To control the firm characteristics, the vector of the following variables are included in, Xi,t.GROUPi,t is 1 for if firm is affiliated within a group form and 0 if unaffiliated single firm. REINSURANCEi,t is the ratio of reinsurance ceded minus reinsurance assumed divided by total net premiums written. Geo-Herfi,t is a geographic Herfindahl index, which captures geographical diversification and is calculated as the sum of the squared percentage of net premiums written across the 50 states and the District of Columbia. Product-Herfi,t is a product Herfindahl index, which measures line-of-business diversification and is calculated as the sum of the squared percentages of premiums earned across the different business lines.
Empirical Results
Table 4 reports the predicted sign and regression results from Equation (19). Our explained variable for column (1) is RE1 and column (2) is RE2. While RE1 is calculated by incurred losses in year t minus incurred losses in year t+5 scaled by total assets, RE2 is scaled by developed reserve. We render the following conclusions consistent with previously discussed motivations and incentives in the current literature.
| Table 4 Regression Results |
|||
| Predicted | (1) | (2) | |
| Variable | Sign | (RE1) | (RE2) |
| SMOOTH | + | 0.0237*** (5.16) |
0.0363*** (7.44) |
| WEAK | - | -0.0806*** (-6.39) |
-0.0722*** (-8.80) |
| TAX | + | 0.0048*** (3.57) |
0.0059*** (3.71) |
| REG | -,+ | -0.0344 (-1.51) |
-0.0675* (-1.92) |
| PUBLIC | - | -0.0169* (-1.85) |
-0.0098* (-1.73) |
| STOCK | - | -0.0072*** (-2.83) |
-0.0165*** (-3.95) |
| LEVERAGE | - | -0.0030** (-2.12) |
-0.0016** (-1.98) |
| SIZE | n/a | 0.0145 (0.37) |
-0.0253 (-0.83) |
| GROUP | n/a | -0.0052 (-1.19) |
-0.0028 (-0.74) |
| GEO-HERF | n/a | -0.0204*** (-3.66) |
-0.0253*** (-3.87) |
| PRODUCT-HERF | n/a | -0.0475*** (-4.86) |
-0.0319*** (-4.25) |
| CONSTANT | n/a | -0.0039 (0.81) |
-0.0047 (0.96) |
| Year fixed effect | Yes | Yes | |
| Firm fixed effect | Yes | Yes | |
| Clustered Std. Error | Yes | Yes | |
| R-squared | 0.3527 | 0.3892 | |
| N | 38,301 | 34,148 | |
Note: This Table presents the results from Equation (19). Data is from all property-liability insurers in the United States. Insurer characteristics are from insurers’ annual statutory filings of NAIC from 1996 to 2014. Since the reserve errors calculation requires five-year data, our final sample is from 1996 to 2009. In total there are 3,508 (3,181) unique insurers with 38,301 (34,148) firm-year observations for Reserve Error_1 (Reserve Error_2). Dependent variable for column (1) is, RE1, is calculated by incurred losses in year t minus incurred losses in year t+5, scaled by total assets. Column (2), RE2, is the same except it is scaled by developed reserve. SMOOTHi,t is calculated as the average return on assets over the previous three years. WEAKi,t is equals to 1 if an insurer has more than four unusual Insurance Regulatory Information System ratios (IRIS) and 0 otherwise. TAXi,t is the sum of net income and estimated reserve over total assets. REGi,t is measured as a percentage of business written subject to stringent rate regulation. PUBLICi,t,?? is an indicator variable coded equal to one for public insurers and zero for private insurers. STOCKi,t is one for stock insurers and zero for mutual insurers. LIVERAGEi,t is a ratio of surplus to asset. SIZE,t is the natural logarithm of firm’s total assets. GROUPi,t is one for if firm is affiliated within a group form and zero if unaffiliated single firm. GEO-HERFi,t is a geographic Herfindahl index, which captures geographical diversification and is calculated as the sum of the squared percentage of net premiums written across the 50 states and the District of Columbia. PRODUCT-HERFi,t is a product Herfindahl index, which measures line-of-business diversification and is calculated as the sum of the squared percentages of premiums earned across the different business lines. All models control for year and firm fixed effects and adjusted for clustered standard errors. t-statistics are in parentheses. * p<0.05, ** p<0.01, *** p<0.00.
First, SMOOTHi,t is positive and significant indicating that firms over-estimate their reserves when the average return on assets over the previous three years is high. Thus, insurers use loss reserves as a tool to smooth their earning (Grace, 1990). Second, the coefficient for WEAKi,t is strongly associated with under-reserving practice of insurers. Consistent with prior studies (Petroni, 1992; Petroni & Beasley, 1996; Gaver & Paterson, 2000:2004), our outcome supports that insurer’s under-estimate their reserve during the financially weak period to possibly increase their income. Third TAXi,t shows a significantly positive relation with over-reserving. When insurers increase their reserves, their tax liability is reduced. By overestimating future losses to current premiums, insurers can delay the tax payments supporting current findings (Petroni, 1992; Eckles & Halek, 2010). Fourth, although REGi,t does not show significant results, it has two-fold. One aspect is that firms subject to stringent rate regulation under-estimate their reserves to convince regulators that they can charge a lower price (Nelson, 2000). Another aspect is that strictly regulated firms tend to over reserve to persuade regulator that higher rates are required to continue offering insurance (Grace & Leverty, 2010). Fifth PUBLICi,t is used to proxy for capital markets while STOCKi,t is used to proxy for executive compensation. These two variables show negative coefficients indicating that public companies with lower asymmetric information and higher monitoring tend to under-reserve to avoid losses. Similarly, managers with more exposure to movements in stock price involve in income-increasing discretion. Next, LEVERAGEi,t measures the contracting motivation such as debt covenants. We find that firms with higher leverage exposures tend to under-reserve pursuing a good financial standing of the company so that it can avoid its cancellation or renegotiation (Jaggi & Lee, 2002). Last, insignificant coefficients for SIZEi,t infer that the high quality auditing by Big Six auditors is not enough to reduce reserve errors and can be constrained by the oversight provided by an independent auditor (Gaver & Patterson, 2001)
For control variables, Group i,t does not show consistent results perhaps because affiliated firms may offer other mechanisms of managing capital (i.e. internal reinsurance) in addition to loss reserving practice. Also, GEO-HERFi,tand PRODUCT-HERFi,t have negative and significant outcomes suggesting that diversified companies may inject their reserves to help certain business lines or particular states. All our models have year and firm fixed effect and their standard errors are clustered and adjusted for heteroskedasticity. To sum up, our results show consistent evidence with the current literature (Grace, 1990; Petroni, 1992; Petroni & Beasley, 1996; Nelson, 2000; Gaver & Paterson, 2000:2004; Jaggi & Lee, 2002; Eckles & Halek, 2010).
Potential Research Areas
Managerial accounting discretion in the insurance industry certainly lacks and needs to be examined in a thorough manner. It merits substantial discussions in the following possible areas.
Firstly, capital market motivations for insurers are not heavily discussed in the current literature mainly because there are not many stock insurers. It causes a small sample problem when analysing the data. However, with a longer period of data, insurer’s incentives to manipulate earnings to influence the current capital markets can be carefully inspected. Some of the recommended extents include but not limited to timing around different equity offering, company buyouts, merger and acquisitions, and demutualization.15
Second, crisis period can be a thought-provoking time to investigate firms’ earnings management. During those crises, companies that are struggling tend to manipulate results more than companies in an acceptable position. Those companies can blame the economic situation for such a tragedy. This phenomenon relates to insurers underwriting cycle issue especially when insurer is in a hard market condition, also known as crisis.16
Third, we learn how Sarbanes and Oxley Act (SOX) improves accounting quality (or constrains earnings management) in early 2002.17 Also, there have been some studies examining the effect of SOX on insurer's reserve management (Brandt et al., 2013). Although they find that the patterns of setting loss reserves of public property and liability insurers have not changed post-SOX, it is necessary to see how such legislation reforms affect companies, customers, investors, and industries. For instance, accounting standard are frequently strengthened and mandatory adoptions like International Financial Reporting Standards (IFRS) are announced. As those legislation reforms are adopted, it is researcher’s opportunity to ask associated questions.
Fourth, majority of studies are limited to the domestic companies. Multinational enterprises and earnings management has received only a little attention. As firms globalized, it will be worth to look at the cultural differences in different nation’s regulatory system and manager’s background and managerial style.
Fifth, insurers’ purposes of earnings management can be short-term or long-term. Studies find several short-term manipulation incentives, but it is possible that firms bring a fundamental change to the firm. This is a long-term effect of earnings management. Normally, life insurer’s contracts are long-term comparing to property and liability insurers contracts. For that reason, liquidity is a main concern for property liability insurers and almost all studies focus on property liability insurers but not on life insurers to our knowledge.
Last but not least, the association between earning management and Enterprise Risk Management (ERM) is key to investigate. ERM is a business strategic of managing all integrated risks and its impact on the company in a holistic manner. Those enterprise risks include financial, operational, strategic, compliance, governance, and reputational risks in both internally and externally. As ERM incorporates all those risks, it is likely to improve accounting numbers as it represents firm’s high accrual quality. Potential relationship will exist with ERM adoption, the marginal cost of risk reduction via ERM and economic value ERM brings in.
Concluding Remarks
This paper serves as an overview of property and liability insurers’ managerial accounting discretion using insurer’s specific reserve, loss reserve. While accounting literature focuses on the estimates of abnormal accruals and real activities, insurance literature uses insurers estimated liability for unpaid claims as an actual error in accruals. It proposes a better tool to measure earnings management over various traditional measures used in other areas.
Insurer’s loss reserve error provides the information regarding firms’ earnings management direction, magnitude, and variability. The direction of the insurers loss reserve shows whether insurers over-reserved or under-reserved previously. By taking an absolute value of loss reserve development, the magnitude of earnings management can be inspected. In addition to its direction and magnitude, the variability is also important as it indicates how volatile firms accounting information is.
Using U.S. property and liability insurance companies from National Association of Insurers Commissioners (NAIC) from 1996 to 2014, this paper generally examines the manager’s motivations and incentives involve in earnings management. Our results show consistent evidence with the current literature as the following conclusion is drawn.
First, insurance companies use loss reserves as a tool to smooth their earning. Second, they under-estimate their reserve during the financially weak period to possibly increase their income. Third, under-reserving reduces tax liability and delay tax payments of the insurers. Fourth, public companies with lower asymmetric information and higher monitoring tend to under-reserve to avoid losses. Fifth, managers exposed to movements in stock price involve in income-increasing discretion. Last, leveraged insurers tend to under-reserve pursuing a good financial standing of the company so that they can avoid its cancellation or renegotiation. (Grace, 1990; Petroni, 1992; Petroni & Beasley, 1996; Gaver & Paterson, 2000:2004; Jaggi & Lee, 2002; Eckles & Halek, 2010).
In this paper, various future research areas are suggested including but not limited to capital markets motivations, underwriting cycle in crisis period, legislation reforms, multinational firms, short-term vs. long-term, Enterprise Risk Management (ERM). Future researchers interested in this area will find this paper as a guidance of insurer’s managerial accounting discretion via loss reserves.
Endnote
1. Like Generally Accepted Accounting Principles (GAAP) that most businesses use, Statutory Accounting Principles (SAP) is an accounting procedure used in the insurance industry. National Association of Insurance Commissioners (NAIC) mandate all insurance companies follow SAP.
2. Actuaries generally use the following formulaic processes including Judgement Method (JM), Average Payment Method (APM), Chain Ladder Method (CLM), Bornhuetter-Ferguson Method (BFM), and Stochastic Chain Ladder Method (SCLM). This paper focuses on insurer managerial accounting discretion using loss reserve errors not the way it is computed formulaically.
3. The regulatory body concerns about the level of insurer’s loss reserve. The Internal Revenue Service (IRS) states that insurers’ loss reserves are developed by credentialed actuaries and are fully consistent with professional actuarial standards as IRS agents and in-house IRS actuaries are on the lookout for insurer’s loss reserves. The Statement of Statutory Accounting Principles (SSAP) No. 55 states that “management’s best estimate” of the liability for these items be recorded in the company’s statutory financial statements. Yet, 10% “add-on” is included in the reserve not developed in accord with actuarial standards and the risk margin is based on the difference between the expected economic value and a level such as the 75th percentile.
4. Consistent with the existing literature, we use a five-year estimation window (Grace, 1990; Petroni, 1992; Beaver et al., 2003; Gaver & Paterson, 1994; Eckles & Halek, 2010; Eckles et al, 2011; Grace & Leverty, 2012).
5. Based on Cook’s distance and DFFITIS test, firms with reserve error outliers are winsorized in upper and lower 1% of the reserve error distribution or with Cook’s distance value greater than 4/n or DFFITIS value greater than 
6. See the next section “Earnings Management Calculation” for the detailed steps.
7. In Table 1, the raw data from 2014 Annual National Association of Insurance Commissioners’ (NAIC) annual statutory filing of Allstate Co. Schedule P-Part 2 is shown. A firm’s reserve error is calculated by incurred losses in year t minus incurred losses in year t+n, IncurredLossest–IncurredLossest+n, where n=5. At the end of 2009, estimated losses for all years up to and including 2009 totaled $22,120,897 million (the sum of the italicized values in Part 2, column 6–2009). By the end of 2014, the estimate for the same loss period had been increased to $21,812,173 million (the sum of the italicized values in Part 2, column 11– 2014). To capture the revised estimate years in the future, annual statement data from 2001 is used. Initial over- (under-) reserving yields a positive (negative) reserve error since the revised estimate of total losses incurred 5 years in the future is greater (less) than the initial estimate. Accordingly, reserve error for Allstate Co. in 2009 is $308,724 million ($22,120,897 million minus $21,812,173 million), indicating that Allstate Co. overestimates their reserves by $308,724 million.
8. We use three and five year’s standard deviation of reserve error.
9. Insurance Regulatory Information System (IRIS) ratio is an early warning system to detect insurers in financial difficulty. There are total 12 IRIS ratios and each ratio has its usual range. If an insurer has four or more ratios outside the usual range, they are subjected to further regulatory scrutiny. Studies find that 8 of them are shown to be improved with earnings management.
10. See “2. Financial Weakness/Insolvency” motivation for more details.
11. The terminology, “take a bath”, means that firms sustain a significant loss and the goal of current year is to show increased net income in the future year.
12. Big six auditors are defined as the largest accounting firms that provide audit, assurance, taxation, consulting, advisory, and legal services to the clients worldwide. It used to be “Big Eight” and was reduced to “Big Six” and then “Big Five” and now it is “Big Four” now. Currently, “Big Four” companies are Deloitte, PricewaterhouseCoopers (PwC), Ernst & Young (EY), and KPMG. They audit 99% of the companies in the Financial Times Stock Exchange (FTSE) 100, and 96% of the companies in the FTSE 250 index.
13. During our studied period, there are legislation changes such as Sarbanes–Oxley Act, Terrorism risk insurance
14. Act, Paid Family Leave, Flood Insurance Reform Act. To deal with those legislation changes during our studies period, our main analysis is run with year fixed effect which will pick up any variations in the outcome that happen over time and that is not attributed to our other explanatory variables. It will perform within transformation using specified panel in time (i.e. year) fixed effect. Moreover, we include several indicator variables and two Herfindahl index measures to control for state-wise and product-wise differences such as workers compensation, flood, and terrorism.
15. Demutualization refers to the mutual insurance company converting its organizational form to stock insurance company. It can be done thru pure conversion, merger, and mutual holding company. Pure conversion is when a mutual insurer amends its articles of incorporation and reorganized as stock insurers while merger refers to both mutual and stock insurers join together as a single company where stock insurer is a survivor. Mutual holding company is owned by mutual insurer but owns a major stake at its stock subsidiary and issues common stocks.
16. Insurance industry tends to follow an underwriting cycle of rising and falling and it is often referred to a repeating series of market condition measured in reported profit. “Hard market” refers to when insurance prices are high and coverage supply is restricted while soft market refers to when prices are low and coverage is readily available while “soft market” is the opposite.
17. After Enron Scandal in 2002, U.S. Congress passes an act, Sarbanes-Oxley Act (SOX), to protect investors from accounting fraud and encourage corporation’s reliable financial disclosures.
References
- Achleitner, A.K., Guenther, N., Kaserer, C., & Siciliano, G. (2014). Real earnings management and accrual-based earnings management in family firms. The European Accounting Review, 23(3), 431-461.
- Ball, R., & Shivakumar L. (2005). Earnings quality in UK private firms: Comparative loss recognition timeliness. Journal of Accounting and Economics, 39(1), 83-128.
- Beatty, A., Chamberlain, S., & Magliolo, J. (1995). Managing financial reports of commercial banks: The influence of taxes, regulatory capital and earnings. Journal of Accounting Research, 33(2), 231-261.
- Beaver, W.H., McNichols, M.F., & Nelson, K.K. (2003). Management of the loss reserve accrual and the distribution of earnings in the property-casualty insurance industry. Journal of Accounting and Economics, 35(3), 347-376.
- Becker, C.L., DeFond, M.L., Jiambalvo, J., & Subramanyam, K.R. (1998). The effect of audit quality on earnings management. Contemporary Accounting Research, 15(1), 1-24.
- Boynton, C.E., Dobbins, P.S., & Plesko, G.A. (1992). Earnings management and the corporate alternative minimum tax. Journal of Accounting Research, 30, 131-153.
- Brandt, E., Ma, Y., & Pope, N. (2013). The impact of Sarbanes-Oxley on property-casualty insurer loss reserve estimates. Working Paper, Illinois State University.
- Browne, M.J., Ma, Y.L., & Wang, P. (2009). Stock-based compensation and reserve errors in the property and casualty insurance industry. Journal of Insurance Regulation, 27(4), 35-54.
- Burgstahler, D., & Dichev, I. (1997). Earnings management to avoid earnings decreases and losses. Journal of Accounting and Economics, 24(1), 99-126.
- Cahan, S. (1992). The effect of antitrust investigations on discretionary accruals: A refined test of the political cost hypothesis. The Accounting Review, 67, 77-9.
- Calegari, M.J. (2000). The effect of tax accounting rules on capital structure and discretionary accruals. Journal of Accounting and Economics, 30(1), 1-31.
- Carson, J.M., Eastman, E.M., & Eckles, D.L. (2016). Ratings: It's accrual world. Journal of Risk and Insurance, 85(3), 787-809.
- Chaney, P.K., & Lewis, C.M. (1995). Earnings management and firm valuation under asymmetric information. Journal of Corporate Finance, 1(3-4), 319-345.
- Cohen, D.A., & Zarowin, P. (2010). Accrual-based and real earnings management activities around seasoned equity offerings. Journal of Accounting and Economics, 50(1), 2-19.
- Cohen, D.A., Dey, A., & Lys, T.Z. (2008). Real and accrual-based earnings management in the pre-and post Sarbanes-Oxley periods. The Accounting Review, 83(3), 757-787.
- Collins, J., Shackelford, D., & Wahlen, J. (1995). Bank differences in the coordination of regulatory capital, earnings and taxes. Journal of Accounting Research, 33(2), 263-291.
- DeAngelo, E., DeAngelo, H., & Skinner D. (1994). Accounting choices of troubled companies. Journal of Accounting and Economics, 17(1-2), 113-143.
- Dechow, P.M., Sloan, R.G., & Sweeney A.P. (1995). Detecting earnings management. The Accounting Review, 70(2), 193-225.
- Degeorge, F., Patel, J., & Zeckhauser, R. (1999). Earnings management to exceed thresholds. The Journal of Business, 72(1), 1-33.
- Eckles, D.L., & Halek M. (2010). Insurer reserve error and executive compensation. Journal of Risk and Insurance, 77(2), 329-346.
- Eckles, D.L., Halek, M., & Zhang R. (2014). Information risk and the cost of capital. Journal of Risk and Insurance, 81(4), 861-882.
- Eckles, D.L., Halek, M., He, E., Sommer, D.W., & Zhang R. (2011). Earnings smoothing, executive compensation, and corporate governance: Evidence from the property-liability insurance industry. Journal of Risk and Insurance, 78(3), 761-790.
- Erickson, M., & Wang S. (1999). Earnings management by acquiring firms in stock for stock mergers. Journal of Accounting and Economics, 27(2), 149-176.
- Gaver, J.J., & Paterson J.S. (1999). Managing insurance company financial statements to meet regulatory and tax reporting goals. Contemporary Accounting Research, 16(2), 207-241.
- Gaver, J.J., & Paterson J.S. (2001). The association between external monitoring and earnings management in the property-casualty insurance industry. Journal of Accounting Research, 39(2), 269-282.
- Gaver, J.J., & Paterson J.S. (2004). Do insurers manipulate loss reserves to mask solvency problems? Journal of Accounting and Economics, 37(3), 393-416.
- Gaver, J.J., Gaver, K.M., & Austin J.R. (1995). Additional evidence on bonus plans and income management. Journal of Accounting and Economics, 19(1), 3-28.
- Grace, E.V. (1990). Property-liability insurer reserve errors: A theoretical and empirical analysis. Journal of Risk and Insurance, 57(1), 28-46.
- Grace, M.F., & Leverty J.T. (2010). Political cost incentives for managing the property liability insurer loss reserve. Journal of Accounting Research, 48(1), 21-49.
- Grace, M.F., & Leverty J.T. (2012). Property-liability insurer reserve error: Motive, manipulation, or mistake. Journal of Risk and Insurance, 79(2), 351-380.
- Graham, J.R., Harvey, C.R., & Rajgopal, S. (2005). The economic implications of corporate financial reporting. Journal of Accounting and Economics, 40(1-3), 3-73.
- Gunny, K.A. (2010). The relation between earnings management using real activities manipulation and future performance: Evidence from meeting earnings benchmarks. Contemporary Accounting Research, 27(3), 855-888.
- Healy, P.M., & Palep, K.G. (1990). Effectiveness of accounting-based dividend covenants. Journal of Accounting and Economics, 12(1-3), 97-124.
- Healy, P.M. (1985). The e?ect of bonus schemes on accounting decisions. Journal of Accounting and Economics, 7(1-3), 85-107.
- Holthausen, R.W., Larcker, D.F., & Sloan, R.G. (1995). Annual bonus schemes and the manipulation of earnings. Journal of Accounting and Economics, 19(1), 29-74.
- Jaggi, B., & Lee, P. (2002). Earnings management response to debt covenant violations and debt restructuring. Journal of Accounting, Auditing & Finance, 17(4), 295-324.
- Jones, J.J. (1991). Earnings management during import relief investigations. Journal of Accounting Research, 29, 193-228.
- Keung, E., Lin, Z.X., & Shih, M. (2010). Does the stock market see a zero or small positive earnings surprise as a red flag? Journal of Accounting Research, 48(1), 91-121.
- Lee, Y.J., Petroni, K.R., & Shen, M. (2006). Cherry picking, disclosure quality, and comprehensive income reporting choices: The case of property?liability insurers. Contemporary Accounting Research, 23(3),655-692.
- Lin, S., Radhakrishnan, S., & Su, L.N. (2006). Earnings management and guidance for meeting or beating analysts' earnings forecasts. Working Paper.
- Liu C., Ryan, S., & Wahlen, J. (1997). Differential valuation implications of loan loss provisions across banks and fiscal quarters. The Accounting Review, 72(1),133-146.
- Maydew, E.L. (1997). Tax-induced earnings management by firms with net operating losses. Journal of Accounting Research, 35(1), 83-96.
- McNichols, M.F. (2000). Research design issues in earnings management studies. Journal of Accounting and Public Policy, 19(4-5), 313-345.
- Mikhail, M.B., Walther, B.R., & Willis, R.H. (1999). Does forecast accuracy matter to security analysts? The Accounting Review, 74(2), 185-200.
- Moyer, S. (1990). Capital adequacy ratio regulations and accounting choices in commercial banks. Journal of Accounting and Economics, 12(2), 123-154.
- Myers, J.N., Myers, L.A., & Skinner, D.J. (2007). Earnings momentum and earnings management. Journal of Accounting, Auditing & Finance, 22, 249-284.
- Nelson, K.K. (2000). Rate regulation, competition, and loss reserve discounting by property casualty insurers. The Accounting Review, 75, 115-138.
- Petroni, K., & Beasley, M. (1996). Errors in accounting estimates and their relation to audit firm type. Journal of Accounting Research, 34, 151-171.
- Petroni, K.R. (1992). Optimistic reporting in the property-casualty insurance industry. Journal of Accounting and Economics, 15, 485-508.
- Poterba, J., Rauh, J., Venti, S., & Wise, D. (2007). Defined contribution plans, defined benefit plans, and the accumulation of retirement wealth. Journal of Public Economics, 91, 2062-2086.
- Roychowdhury, S. (2006). Earnings management through real activities manipulation. Journal of Accounting and Economics, 42, 335-370.
- Shuto, A. (2007). Executive compensation and earnings management: Empirical evidence from Japan. Journal of International Accounting, Auditing and Taxation, 16, 1-26.
- Smith, B. (1980). An analysis of auto liability loss reserves and underwriting results. Journal of Risk and Insurance, 47, 305-320.
- Sweeney, A.P. (1994). Debt-covenant violations and managers' accounting responses. Journal of Accounting and Economics, 281-308.
- Teoh, S.H., Welch, I., & Wong T.J. (1998a). Earnings management and the post-issue performance of seasoned equity offerings. Journal of Financial Economics, 50, 63-99.
- Teoh, S.H., Welch, I., & Wong T.J. (1998b). Earnings management and the long-term market performance of initial public offerings. Journal of Finance, 53, 1935-1974.
- Visvanathan, G. (1998). Deferred tax valuation allowances and earnings management. Journal of Financial Statement Analysis, 3, 6-15.
- Wahlen, J. (1994). The nature of information in commercial bank loan loss disclosures. The Accounting Review, 455-478.
- Watts, R.L., & Zimmerman, J.L. (1978). Towards a positive theory of the determination of accounting standards. The Accounting Review, 53, 112-134.
- Weiss, M. (1985). A multivariate analysis of loss reserving estimates in property-liability insurers. Journal of Risk and Insurance, 52, 199-221.