Research Article: 2019 Vol: 25 Issue: 2
Analysis of Month of the Year Effect in an Emerging Market via Stochastic Dominance Approach
Ini Adinya, University of Ibadan
Tolulope Oke, Texas A & M University
Sunday O. Edeki, Covenant University
Abstract
This paper investigates the month-of-the-year effect for the Nigerian Stock Exchange (NSE) for the period spanning January 1985 to December 2015. The analysis carried out is based on the Stochastic Dominance framework. Our empirical results support the existence of monthly anomaly in the NSE and show that no month of the year stochastically dominates all the other months in the sense of First Order stochastic dominance. The study also shows that March and April have the highest mean returns and there is significant evidence of the month of the year effect in both months. Our result is consistent with studies on some emerging markets which show evidence of calendar effect. However, this is contrary to the January effect observed in most developed markets as reported in the literature.
Keywords
Month of the Year Effect, Stochastic Dominance, Stock Returns, Stock Option Pricing, All Shares Index, Emerging Markets.
Introduction
Several studies in finance have revealed that there are financial market anomalies. The concept of anomaly as linked to Kuhn [1] describes how stock market deviates from its usual behaviour and not consistent with maintained theories of asset-pricing behaviour. In particular, financial market anomalies are evidence against the Efficient Market Hypothesis (EMH) which asserts that stock are perfectly priced since they fully reflect available information on a particular stock market, and profiting from predicting price movements would be very difficult and unlikely. There are documented literature that have proven the existence of some predictable patterns in stock returns. These anomalies are represented in several forms such as Month of the Year Effect on stock markets (January Effect), the Holiday Effect, Day-of-the Week-Effect and so on.
This topic has remained interesting for research for a long time in developed as well as emerging markets in many countries. Earlier works on the Month of the Year Effect in some developed markets include Rozeff and Kinney [2], Keim [3], Ariel [4], Raj and Thurston [5], Choudhary [6] and Schwert [7] among others. Most of the studies on this area were carried out mostly on the US and European markets. Some recent work in Africa include the following: Ayadi et al. [8] computed monthly returns for Ghana, Zimbabwe and Nigeria testing for seasonality and found evidence of the January Effect in Ghana. Chukwuogor- Ndu [9] investigated the presence of day-of-the-week effect and return volatility in five African financial markets. He uncovered a tendency of high volatility in the daily returns of these African stock markets. Alagidele [10] investigated the existence of two anomalies in African stock returns namely: the month of the year and the pre-holiday effects, and their implications for stock market efficiency. His results indicated that the month of the year effect exists in the countries considered.
Many researchers have studied the Nigerian Stock market to examine if there are evidence of calendar anomaly. Osazevbaru and Oboreh [11] investigated the Nigerian stock market anomalies using Generalised Autoregressive Conditional Hete-rocsedasticity (GARCH) (2,1) and EAGRCH (2,1) models. Their results show that the day-of-the-week anomalies vary depending on the assumption made on returns and variance. Oladayo [12] studied the existence of calendar anomalies on 167 stocks listed on the Nigerian stock exchange between the period 2004 and 2014 using the GARCH model. He revealed that there was no statistically significant day of the week or month of the year effect and concluded that there is no evidence of a January effect or any other monthly effects.
Although, there are several works on day of the week effect, there has not been much effort in examining the month of the year effect. This study attempts to fill this gap by examining month of the year effect for Nigerian equity markets. The focus of this study is to investigate empirically the existence of the month of the year effect for the Nigerian Stock Exchange (hereafter NSE) which is the first exchange in West Africa and one of the biggest in Africa. The methodology employed is the Stochastic Dominance (SD) approach. SD approach has been widely used as seen in Borges [13], and Gasbarro, Wong, & Zumwalt [14].
Data and Methodology
This study covers a time period of 29 years from January 1985 to December 31, 2015. Starting from the launch of the NSE All Share Index (NSE-ASI) in January 1985, this dataset includes all available price data to 2015 on NSE index that includes all stocks listed in the exchange. The All Shares Index (ASI) shed more than 70 percent of its value during the global financial crisis in 2008. Hence the crisis year, 2008, is excluded from the sample, since the returns during that period were induced by the global financial crisis.
The study uses monthly data obtained from NSE between 1985 to 2015. The returns are obtained from the log difference change in the price index as defined below:

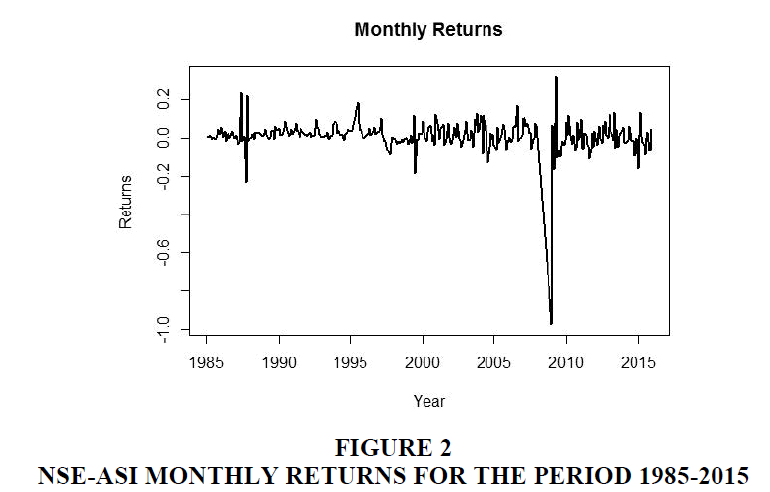
where t r is the return of NSE-ASI index on month t, Pt-1 is the price of NSE-ASI index on month (t−1) and In (.) denotes the natural log. The total sample of the Nigerian monthly return series covers January 1st, 1985 to December 30th 2015. Figure 1 shows the Stock monthly returns for Nigeria.
Research Methodology
The concept of stochastic dominance is developed as a set of tools for investment decisions. It is most preferred because unlike parametric tests that require the normality assumption, SD approach is not distribution dependent. The pioneers of this concept include Hanoch and Levy [15]. Related researches on market anomalies, calendar effects, emerging market, NSE, stock returns, stock option pricing, option valuation, SMEs, and so on include those of Edeki, Ugbebor, Owoloko [16], Jevwegaga et al. [17], Edeki, Ugbebor, Owoloko [18], Onakoya et al. [19], Edeki, Ugbebor [20].
The following provide a brief description of the first and second order of SD.
Definition 2.1: First order SD (FSD): Let X and Y be two random variables (orreturns) with cumulative distribution functions FXand FY respectively. Then X is said todominate Y in the First Order stochastic dominance (FSD) sense, if and only if

When the cumulative distribution function (CDF) of X lies below that of Y then X dominates Y mathematically and FSD exists and denoted as X F FSD Y F. That is, the distribution of X F (for a risky asset X ) has the chance of earning a higher return that is always greater than with the distribution of FY (For a risky asset Y).
Definition 2.2: Second order SD (SSD): Suppose the support of FX and FY lie in [a, b]. Then FX Second Order stochastically dominates FY if and only if for all t

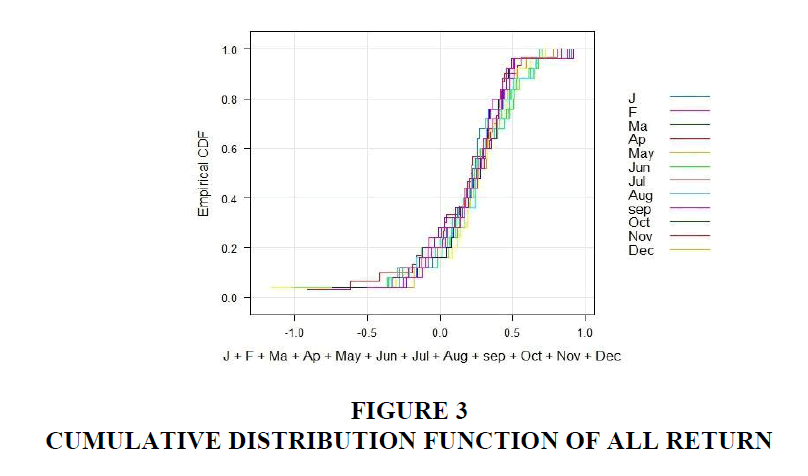
Second order stochastic dominance can be denoted as  The procedure for the SD approach includes the calculation of the CDFs. The empirical CDF for each month is determined and from the shape of the graph we can deduced whether there is SD or not.
Results and Discussion
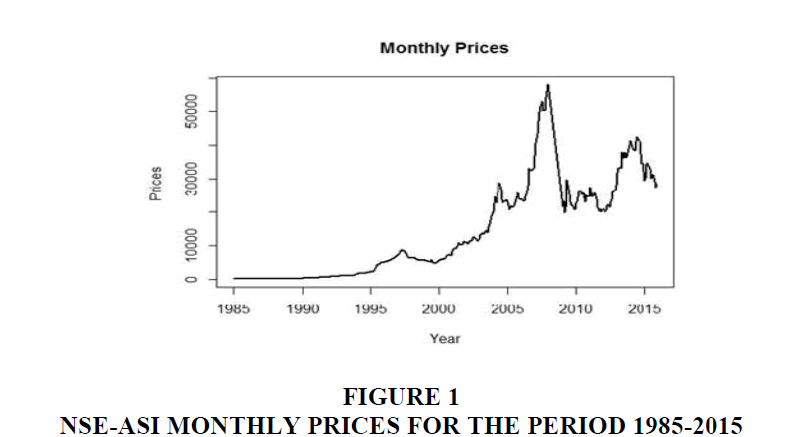
Figure 1 shows the monthly prices for different months in the year. Figure 2 shows the monthly returns during the sample period. It can be seen that the greatest de- clines in NSEASI returns took place around 2009 which is probably due to the global crises. We first obtain the summary statistics for the monthly market returns of NSE-ASI. This will give some characteristics of the distributions such as dispersion, kurtosis, skewness and so forth as seen in Table 1. References are made to Figures 1-3, and Tables 1 and 2.
In Table 1, the descriptive statistics of monthly returns are summarized. The mean returns are all positive. The highest returns are observed in March, April and May (0.20). The standard deviations of returns is highest (lowest) in July and December (January). All the skewness values are negative. Except February, May and June, kurtosis values are positive indicating a leptokurtic distribution. The Jarqua-Bera test statistics indicate the significant non-normality of returns. There- fore, any test based on normality assumption would likely be invalid.
| Table 1: Summary Statistics For Monthly Market Return Of Nse | ||||||||
| No of obs. | Mean | Min | Max | St dev. | Skewness | Kurtosis | Jarque Bera | |
|---|---|---|---|---|---|---|---|---|
| Jan | 29 | 0.19 | -0.52 | 0.81 | 0.28 | -0.50 | 0.18 | 1.5625 |
| Feb | 29 | 0.19 | -0.56 | 0.78 | 0.30 | -0.47 | -0.20 | 1.1617 |
| Mar | 29 | 0.20 | -0.78 | 0.72 | 0.32 | -0.94 | 1.17 | 7.3411 |
| April | 29 | 0.20 | -0.79 | 0.70 | 0.33 | -0.81 | 0.82 | 4.9456 |
| May | 29 | 0.20 | -0.52 | 0.70 | 0.32 | -0.33 | -0.87 | 1.1085 |
| June | 29 | 0.19 | -0.65 | 0.68 | 0.33 | -0.57 | -0.27 | 1.7695 |
| July | 29 | 0.19 | -0.74 | 0.81 | 0.34 | -0.63 | 0.32 | 2.5427 |
| Aug | 29 | 0.19 | -0.78 | 0.89 | 0.31 | -0.88 | 1.69 | 9.1518 |
| Sept | 29 | 0.19 | -0.82 | 0.91 | 0.31 | -0.95 | 2.43 | 14.4355 |
| Oct | 29 | 0.19 | -0.83 | 0.92 | 0.32 | -0.83 | 1.98 | 10.3883 |
| Nov | 29 | 0.19 | -0.95 | 0.88 | 0.33 | -1.14 | 2.72 | 18.9452 |
| Dec | 29 | 0.19 | -1.02 | 0.84 | 0.34 | -1.39 | 3.45 | 28.9244 |
| Table 2: Sd Table | ||||||||||||
| Jan | Feb | Mar | April | May | June | July | Aug | Sept | Oct | Nov | Dec | |
|---|---|---|---|---|---|---|---|---|---|---|---|---|
| Jan | NSD | SSD | SSD | NSD | NSD | NSD | SSD | NSD | NSD | NSD | NSD | |
| Feb | NSD | SSD | NSD | NSD | NSD | NSD | NSD | NSD | NSD | NSD | NSD | |
| Mar | NSD | NSD | NSD | NSD | NSD | NSD | NSD | NSD | NSD | NSD | NSD | |
| April | NSD | NSD | NSD | NSD | NSD | NSD | NSD | NSD | NSD | NSD | NSD | |
| May | NSD | NSD | SSD | SSD | SSD | NSD | NSD | NSD | NSD | NSD | NSD | |
| June | NSD | NSD | NSD | SSD | NSD | NSD | NSD | NSD | NSD | NSD | NSD | |
| July | NSD | NSD | SSD | SSD | NSD | NSD | NSD | NSD | NSD | NSD | NSD | |
| Aug | SSD | NSD | SSD | SSD | SSD | SSD | SSD | NSD | NSD | NSD | NSD | |
| Sept | SSD | SSD | SSD | SSD | NSD | SSD | SSD | NSD | NSD | NSD | NSD | |
| Oct | NSD | SSD | SSD | SSD | SSD | SSD | SSD | NSD | NSD | NSD | NSD | |
| Nov | NSD | SSD | SSD | SSD | SSD | SSD | SSD | SSD | SSD | NSD | SSD | |
| Dec | NSD | SSD | SSD | SSD | NSD | SSD | SSD | NSD | NSD | SSD | NSD | |
The methodology for this study supports the view of a calendar effect in the NSE-ASI. The results indicate that November cannot dominate any other month of the year. January and August dominates only two other months and December dominates one. The months with the highest number of significant test results are March and April. March and April dominate all other months, except two months. Furthermore, none of the months dominate any other month by FSD.
Figure 3 presents the cumulative distribution functions (CDFs) for the return of stock indexes from January to December over the period. Because none of the functions totally lie to the right of the other functions, none of them can dominate any other day by FSD. All CDFs intersect at some points.
Note: FSD, SSD and NSD denote first-order, second-order and no-order stochastic dominance, respectively. An entry in the table means that the monthly returns on the column dominate monthly returns on the row.
Conclusion
This paper examined the presence of calendar anomalies in the NSE over the period spanning from 1985 to 2015. The dominance computational approach was employed and the results confirm earlier findings of a calendar effect in NSE. The months with the highest number of significant test results are March and April. These results partially support the work of Chin- Shan et al. [9] which find a significant March effect in Monthly Effect in Shanghai Stock Exchange. The evidence presented in this paper brings to the fore the issue of market inefficiency in the Nigerian Stock Exchange. This is a basis for further research that can lead to developing more enhancing methodologies in investing the of calendar effect. Our empirical results support the existence of monthly anomaly in the NSE and provide evidence of market inefficiency. The study reveals that no month of the year stochastically dominates all the other months in the sense of First order stochastic dominance. The study also shows that there is significant evidence of month of the year effect in March and April which have the highest mean returns. Our results is consistent with studies on some emerging markets but contrary to the January effect in most developed markets as reported in the literature.
References
- Ariel, R.A. (1987). A monthly effect in stock returns. Journal of Financial Economics, 18(1), 161-174.
- Ayadi, O.F., Dufrene, U.B., &amli; Chatterjee, A. (1998). Stock return seasonalities in low-income African emerging markets. Managerial Finance Journal, 24(3), 22-33.
- Alagidede, li. (2008). Day-of-the-week seasonality in African stock markets. Alililied Financial Economics Letters 4(2), 115-120.
- Borges, M.R. (2009). Calendar Effects in Stock Markets: Critique of lirevious Methodologies and Recent Evidence in Euroliean Countries. Deliartment of Economics at the School of Economics and Management (ISEG), Technical University of Lisbon Working lialiers No. 2009/37, (2009).
- Choudhry, T. (2000). Day of the week effect in emerging Asian stock markets: evidence from the GRACH model. Alililied Financial Economics, 10(3), 235-242.
- Chin-Shan H., Jian-Hsin C., &amli; Tung-Liang L. (2008). Monthly Effect in Shanghai Stock Exchange.
- Edeki, S.O., Ugbebor, O.O., Owoloko, E.A.(2016). On a Dividend-liaying Stock Olitions liricing Model (SOliM) Using Constant Elasticity of Variance Stochastic Dynamics, International Journal of liure and Alililied Mathematics, 106 (4), 1029-1036.
- Edeki, S.O., Ugbebor, O.O., Owoloko, E.A. (2017). On a nonlinear transaction-cost model for stock lirices in an illiquid market driven by a relaxed black-scholes model assumlitions. Malaysian Journal of Mathematical Sciences, 11(1), 83-96.
- Edeki, S.O., Ugbebor, O.O. (2017). On a generalized squared gaussian diffusion model for olition valuation. MATEC Web of Conferences, Nigeria.
- Gasbarro, D., Wong, W.K., &amli; Zumwalt, J.K. (2007). Stochastic dominance analysis of i-Shares. Euroliean Journal of Finance 13(1), 89-101.
- Hanoch, W.C., Levy, H. (1969). The efficiency analysis of choice involving risk. Review of Economics Studies 36(3), 335-346.
- Jevwegaga, H., Ade-adeniji, O., Ibidunni, A.S., Obaoye, D., Ogunniyi, A., (2018). Role of SMEs' entrelireneurial activities and industrial clustering on SMEs' lierformance. Academy of Entrelireneurshili Journal, 24(1), 1-7.
- Kuhn, T. (1970). The Stucture of Scientific Revolutions. University of Chicago liress, Chicago.
- Keim, D. (1983). Size-related anomalies and stock return seasonality: Further emliirical evidence. Journal of Financial Economics, 12(1), 13-32.
- Osazevbaru, H.O., &amli; Oboreh, J. (2014). The monday effect in nigerian stock market: Evidence and imlilication.
- Journal of Social Sciences and liublic liolicy, 1(3), 1-8.
- Oladayo, O. (2015). The January and Monday effect or the lack thereof. Mathematical Theory and Modeling, 2(4), 25-32.
- Onakoya, O.A., Moses, C.L., Olokundun, M.A., Okorie, U.E., &amli; Lawal, F.A. (2018). Dataset on managerial incentives and bank lierformance: Evidence from Nigerian deliosit money banks, Data in Brief, 19, 878-882.
- Rozeff, S., &amli; Kinney, W.R. (1976). Caliital market seasonality: The case of stock returns. Journal of Financial Economics, 3(4), 379-402.
- Raj, M., &amli; Thurston, D., (1994). January or Aliril? Tests of the turn-of-the-year effect in the New Zealand stock market, Alililied Economic Letters, 1, 81-93.
- Schwert, G.W. (2003). Handbook of the Economics of Finance, Edited by G.M. Constantinides, M. Harris and R. Stulz (2003), Elsevier Science.


