Research Article: 2023 Vol: 27 Issue: 6S
Analysis of Non-Performing Loan and Net Interest Margin on The Performance of Credit Card Issuing Banks in Indonesia
Eddy Winarso, Jenderal Achamad Yani University
Fitri Sukmawati,Widyatama University - UTAMA
Citation Information: Winarso,E., & Sukmawati, F., (2023). Rationality and behavioural factors effects on investors investment decision making in psx. Academy of Accounting and Financial Studies Journal, 27(S6), 1-26.
Abstract
Credit cards have many benefits, so nowadays the use of credit cards is increasingly popular and the number of credit card holders is increasing in number. For the management of the credit card issuing bank, they feel that the credit card business is very potential because it provides a very large profit margin. Credit cards circulating in Indonesia are issued from several principals including: Visa Card, Master Card, American Express Card and Diner Club which compete to gain a lucrative market share. With the compliance of credit card holders in fulfilling their obligations to pay and repay credit cards, it is expected that the issuing bank's non-performing loans will be maintained at the standards determined by Bank Indonesia so that it is expected that the profitability of credit card issuing banks will increase. Likewise, with low Non-Performing Loans, management can increase the Net Interest Margin so that profitability will increase and bank performance will obtain a good Return on Assets. Based on these problems, the researcher wants to know whether Non-Performing loans and Net Interest Margin affect the Return on Assets of credit card issuing banks in Indonesia. The number of credit card issuing banks in Indonesia is 23 companies with a year of observation from 2016 to 2021 processing data using SPSS, the results obtained that Non-Performing Loans have a negative effect on Return on Assets of 0.410 while Net Interest Margin has a positive effect of 0.419. Simultaneously, Non-Performing Laon and Net Interest Margin have an effect of 41.20% on Return on Assets.
Keywords
Credit Card, Non-Performing Loan, Net Interest margin, Return on Assets.
Research Background
In the current era of digitalization, to carry out business transactions, you can use various payment facilities, ranging from conventional ones to the most modern ways. In line with the development of information technology found the most efficient and effective way to make payment transactions using a plastic card or known as a debit card or credit card that serves as a means of payment instead of cash. Debit cards circulating in Indonesia have reached 237.35 million pieces as of April 2022 while credit cards circulating in the same period reached 16.56 million pieces or 6.97% compared to debit cards in circulation, this is because debit cards were introduced earlier. Compared to a credit card and for applying for a credit card requires quite a lot of requirements.
The number of debit cards in circulation is 14.8 times the number of credit cards, but since 2013 the number of users and the number of credit card transactions have not decreased despite the high inflation rate which has impacted people's purchasing power. The development of debit cards and credit cards can be seen in the following table 1, table 2, table 3 & table 4:
| Table 1 Debit Cards in Circulation and Transaction Volume in Indonesia | |||||||
| Year | Credit Card (Millions of Units) | Transaction Volume (in Thousands IDR) | |||||
| Cash Transaction | Shopping Transaction | ||||||
| Domestic | International | Total | Domestic | International | Total | ||
| 2013 | 15,09 | 3.310 | 93 | 3.403 | 218.834 | 16.862 | 235.696 |
| 2014 | 16,04 | 3.675 | 102 | 3.777 | 231.377 | 19. 1 | 250.543 |
| 2015 | 16,86 | 6.289 | 318 | 6.607 | 252.560 | 22. 159 | 274.719 |
| 2016 | 17,41 | 7.221 | 169 | 7.390 | 264.590 | 33.072 | 297.590 |
| 2017 | 17,24 | 7.697 | 119 | 8.086 | 282.49 | 36.801 | 319.292 |
| 2018 | 17,28 | 8.071 | 131 | 8.202 | 295.984 | 34.162 | 330. 146 |
| 2019 | 17,49 | 8.840 | 124 | 8.964 | 300.993 | 39.256 | 340.249 |
| 2020 | 16,94 | 6.413 | 60 | 6.473 | 233. 187 | 35.023 | 268.210 |
| 2021 | 16,51 | 4.803 | 47 | 4.850 | 240. 164 | 36.887 | 277.05 |
| 2022*) | 16,56 | 1.641 | 5 | 1.646 | 103.9 17 | 2.369 | 106.286 |
Source: www.bi.go.id/id/statistik/ekonomi-keuangan/spip/Default.aspx
| Table 2 Debit Cards in Circulation and Transaction Value in Indonesia | ||||||
| Year | Debit Card (Millions of tmit) | Transaction Value (in billions of IDR) | ||||
| Cash | Shopping | Interbank Trf | Trf Between Bank | Total | ||
| 2013 | 89,46 | 1.674.2 10 | 147. 113 | 1.507.368 | 468.679 | 3.797.370 |
| 20 14 | 105,83 | 1.920.781 | 180.64 1 | 1.705. 170 | 638.482 | 4.445.073 |
| 20 15 | 120,28 | 2. 100.785 | 210.386 | 1.847.494 | 739. 128 | 4.897.794 |
| 20 16 | 136,15 | 2.353.443 | 251.847 | 2. 121.258 | 897.365 | 5.623.913 |
| 20 17 | 164,48 | 2.528.879 | 286.2 14 | 2.3 17.678 | 1.067.666 | 6.200.438 |
| 20 18 | 161,33 | 2.837.544 | 292.830 | 2.586.868 | 1.209.577 | 6.926.8 19 |
| 20 19 | 183,43 | 3.204.459 | 332.906 | 2.648.794 | 1.288.665 | 7.474.824 |
| 2020 | 213,61 | 2.990.972 | 284.781 | 2.455.4 10 | 1.185.710 | 6.916.875 |
| 2021 | 226,30 | 3.143.608 | 336. 110 | 2.866.5 16 | 1.330.950 | 7.677. 185 |
| 2022*) | 237,35 | 1.358.7 11 | 172.540 | 690.9 12 | 400.4 18 | 2.622.58 1 |
Source: www.bi.go.id/id/statistik/ekonomi-keuangan/spip/Default.aspx
| Table 3 Credit Cards in Circulation and Transaction Volume in Indonesia | |||||||
| Year | Credit Card (Millions of Units) | Transaction Volume (in Thousands IDR) | |||||
| Cash Transaction | Shopping Transaction | ||||||
| Domestic | International | Total | Domestic | International | Total | ||
| 2013 | 15,09 | 3.310 | 93 | 3.403 | 218.834 | 16.862 | 235.696 |
| 20 14 | 16,04 | 3.675 | 102 | 3.777 | 231.377 | 19.166 | 250.543 |
| 20 15 | 16,86 | 6.289 | 318 | 6.607 | 252.560 | 22. 159 | 274.7 |
| 20 16 | 17,4 1 | 7.221 | 169 | 7.390 | 264.590 | 33.072 | 297.590 |
| 20 17 | 17,24 | 7.697 | 119 | 8.086 | 282.49 1 | 36.801 | 319.292 |
| 20 18 | 17,28 | 8.071 | 131 | 8.202 | 295.984 | 34. 162 | 330. |
| 20 19 | 17,49 | 8.840 | 124 | 8.964 | 300.993 | 39.256 | 340.249 |
| 2020 | 16,94 | 6.413 | 60 | 6.473 | 233. 187 | 35.023 | 268.2 |
| 2021 | 16,51 | 4.803 | 47 | 4.850 | 240. 164 | 36.887 | 277.05 |
| 2022*) | 16,56 | 1.641 | 5 | 1.646 | 103.9 17 | 2.369 | 106.286 |
Source: www.bi.go.id/id/statistik/ekonomi-keuangan/spip/Default.aspx
| Table 4 Credit Cards in Circulation and Transaction Value in Indonesia | |||||||
| Year | Credit Card (Millions of Units) | Transaction Value (in billions of IDR) | |||||
| Cash Transaction | Shopping Transaction | ||||||
| Domestic | International | Total | Domestic | International | Total | ||
| 2013 | 15,09 | 4.070 | 273 | 4.343 | 194.27 | 24.756 | 219.027 |
| 2014 | 16,04 | 4.694 | 186 | 4.880 | 222. 158 | 28.020 | 250.178 |
| 2015 | 16,86 | 6.927 | 475 | 7.402 | 243.502 | 29.640 | 273. 142 |
| 2016 | 17,41 | 7.683 | 387 | 8.070 | 242.329 | 30.621 | 272.950 |
| 2017 | 17,24 | 8.478 | 370 | 8.848 | 254.326 | 34.587 | 288.913 |
| 2018 | 17,28 | 8.677 | 416 | 9.093 | 267.338 | 37.863 | 305.201 |
| 2019 | 17,49 | 9.626 | 412 | 10.038 | 290.483 | 42.162 | 332.645 |
| 2020 | 16,94 | 7.226 | 124 | 7.350 | 210.593 | 20.960 | 231.553 |
| 2021 | 16,5 1 | 6.667 | 100 | 6.767 | 214.272 | 23.477 | 237.749 |
| 2022*) | 16,56 | 2.428 | 15 | 2.443 | 93.129 | 1.641 | 94.770 |
Source: www.bi.go.id/id/statistik/ekonomi-keuangan/spip/Default.aspx
The community welcomes the existence of an easy and practical means of payment in transactions because there is no need to carry a lot of cash when traveling far, just bring a credit card. The credit card industry is one of the banking services that have grown very rapidly since its launch around 1989 until now showing an increasing trend from year to year. Therefore, it is an opportunity for the banking sector to develop the credit card business because it generates profitable margins.
Based on data from Bank Indonesia, the number of credit cards per 2013 reached 15.09 million pieces. This figure has increased until 2019 to 17.49 million pieces, an increase of 15.90% then in 2020 it decreased this was due to Bank Indonesia Regulation (PBI) No. 14/27/DAAP/2012, where BI limits credit card ownership, i.e. customers with incomes below IDR 10 million are allowed to have a maximum of two credit cards from two issuing banks. In 2021, according to a report by Bank Indonesia, the value of transactions with credit cards was IDR 25.91 trillion as of December 2021, an increase of 10.39% from November's IDR 24.47 trillion. Meanwhile, the volume of transactions with credit cards increased in December 2021 by 27.85 million transactions, up 5.57% from November's 26.38 million transactions.
In 2022, in the third year of the COVID-19 pandemic, the credit card business grew again, the volume grew 2.63% year on year to 281.9 times throughout 2021. In nominal terms the credit card business was able to grow 2.35% year on year to IDR 244.51 trillion last year. Meanwhile, the number of credit cards in circulation decreased by 2.52% year to year to 16.51 million pieces. This means that customers are starting to increase their transactions even though the pandemic is entering its third year. Bank Indonesia observes that payment transactions using cards are still able to grow in early 2022. In fact, digital economic and financial transactions are growing rapidly in the midst of the pandemic. Governor of Bank Indonesia (BI) Perry Warjiyo said payment transactions using ATM, Debit and credit cards also grew 14.39% year on year (YOY) to reach IDR 711.2 trillion in January 2022.
Seeing this potential, banking companies tried their luck and entered the business of providing credit card services. According to the General Manager of the Indonesian Credit Card Association (AKKI) Steve Marta, credit cards actually have fewer enthusiasts than debit cards. This happens because credit cards have more in-depth procedures and analysis for card holders. Steve also said that next year, AKKI projects that the number of credit card users will increase by 15 percent, reaching 16 million to 16.5 million and the transaction could increase by around 5 percent,” he added.
Credit cards circulating in Indonesia from Table 5 principals are as follows:
| Table 5 List of Credit Card Principals | ||
| No. | Principal Name | Network Name |
| 1 | PT. JCB INTERNATIONAL INDONESIA | JCB |
| 2 | PT. MASTERCARD INDONESIA | MasterCard |
| 3 | PT. VISA WORLDWTDE INDONESIA | Visa card |
| 4 | PT. UNION PAY INDONESIA | CUP |
| 5 | AMERICAN EXPRESS | Amex |
Since it was first issued in Indonesia, the number of credit cards has always increased from year to year. Accurately, the Indonesian Credit Card Association (AKKI) recorded that from 2009 to 2021 the number of cards, the number of transactions and the transaction value of card users in Indonesia always increased from year to year, which can be seen in tables 1 to 4.
Of the five principals of credit cards circulating in Indonesia, Indonesian people like Master card and Visa card because they are easy to use and work closely with Merchants in Indonesia. In transactions using cards, the required infrastructure is: 1. ATM machine, 2. EDC machine, and 3 Marchant.
Along with the increasing demand and increasingly consumptive in shopping, of course, banking companies as financial institutions have a very important role. This is an opportunity for banks to increase their income in the form of Net Interest Margin (NIM). Thus, the performance of the banking sector will increase. However, the banking sector must also pay attention to the assets quality of banking, the possible negative impact of using credit cards, namely the card owner does not pay on time and may not pay at all so that it will cause bad debts or Non-Performing Loans (NPL) which affect the bank's performance. Based on this background, the authors conducted a study entitled Analysis of asset quality and Net Interest Margin on the performance of credit card issuing banks.
Terms Related to Credit Cards
Visa
Visa is a credit card issuer that is recognized internationally. Is a Citigroup subsidiary that produces Citibank Visa is the largest credit card company in the world.
Master Card
MasterCard is one of the recognized credit card issuers in the international network. This credit card issued by Bank of America is one of the largest credit card companies in the world.
American Express
American Express is one of the recognized credit card issuers in the international network
Interest Rate
Interest is compensation/reward for services to lenders provided by borrowers of funds
Limit
The limit is the maximum amount set by the credit card for shopping which has been set by the credit card issuing bank. This limit can be increased but there will be an over limit fee
Over Limit
Over limit occurs when the credit card limit that has been spent is at its maximum. If the credit card user has used more than the credit card limit, an additional fee will be charged.
Annual Fee
Annual fee is a fee that credit card users must pay every year. Each credit card issuing bank has its own fee policy. And the dues that credit card users pay are different for each limit level.
Monthly Fee
Monthly fee is a fee that must be paid by credit card users every month. Usually this fee will be automatically accumulated with the total credit card bill each month. Each bank has a different policy in collecting fees from credit card users, this can be done on a monthly basis (Monthly Fee) or annually (Annual Fee).
Card Holder
Card Holder is the owner or credit card holder.
Withdraw Credit Card / Cash Advance
Cash Advance is one of the facilities of a credit card to withdraw money in cash by cutting the limit from the credit card. This cash advance can be made at ATMs or branch offices of the credit card issuing bank. However, keep in mind for those who want to make a cash advance, the interest charged will be higher.
Swipe Cash
Cash swipe is a withdrawal activity carried out by credit card users at certain merchants. So, it is as if the credit card holder makes a transaction through a credit card merchant. However, what the merchant provides the cash swipe service provider does not provide goods but cash.
Additional card
Supplementary Card is one of the bank facilities provided for family members of credit card users.
Credit Shield
Credit Shield is an additional facility for credit card holders if the credit card owner has an accident / dies so they cannot pay off the credit card bill. Credit Shield will make all bills on the credit card paid off, so that relatives or relatives do not need to pay off credit card bills.
Transfer Balance
Transfer Balance is the transfer of credit card bills to other credit cards in the same owner. Balance transfers can be made if the credit card owner wants to close his old credit card. Combined Limit Credit Combined Credit Limit is the limit amount for the main and additional credit cards.
Non-Performing Loans (NPL)
Non-performing loan is a comparison between non-performing loans and the total amount of loans disbursed to the community as a whole. According to Hariyani (2010) the NPL ratio is a ratio that shows the ability of bank management to manage bad loans provided by banks. The higher the NPL, the worse the credit quality of the bank which causes the bank to be in a bigger problem condition.
One of the risks faced by banks is the risk of non-payment of loans that have been given to debtors or called credit risk. According to Ghozali in Adicondro & Pangestuti (2015) credit risk is: "The risk faced by banks due to uncertainty or failure of installment payments (counterparties) in fulfilling their obligations".
Credit risk can be divided into 3 risks, namely:
1. Default Risk,
2. Exposure Risk and
3. Recovery Risk. Credit risk includes non-performing loans.
Non-performing loan (NPL) is a non-performing loan where the debtor is unable to meet the payment of loan arrears and interest within the timeframe as agreed in the agreement.
This is also explained in Financial Accounting Standard No. 31 (revised 2000) which states that: "Non-performing loans are generally loans for which the payment of principal/or interest installments has passed ninety days or more after maturity or loans whose timely payment is highly doubtful."
According to Iswi Hariyani (2010) the ratio of NPL or non-performing loans is a ratio that shows the ability of bank management to manage non-performing loans provided by banks. The higher the NPL, the worse the quality of bank credit which causes the number of non-performing loans to increase.
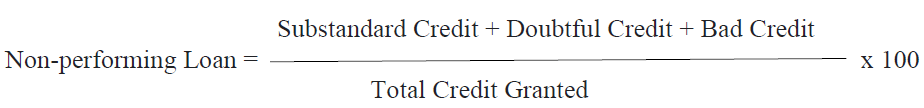
According to Mudrajad et al., (2011) based on the codification of Bank Indonesia Regulations: NPL is a ratio that measures the ratio of the number of non-performing loans to total loans, namely:
1. Credit is credit given to third parties (not including credit to other banks)
2. Non-performing loans are loans with substandard quality (KL), doubtful (D), and bad (M).
3. Non-performing loans are calculated on a gross basis.
4. Figures are calculated per position (not annualized)
Non-performing loans describe a situation where the approval of credit returns is at risk of failure, and even tends to lead to or experience potential losses. Please note that it is wrong to assume that non-performing loans are always due to customer error. Nonperforming loans can be caused by various things originating from customers, from internal conditions and credit providers in table 6.
| Table 6 Non-performing Loan | ||
| Rating | Criteria | Description |
| I | NPL < 2 % | Very Good |
| 2 | 2%< NPL <5% | Good |
| 3 | 5%< NPL < 8% | Faorly Good |
| 4 | 8%< NPL < l 2% | Poor |
| 5 | NPL > 12% | Not Good |
Included in non-performing loans are substandard loans, doubtful loans and bad loans. According to Bank Indonesia Circular No. 13/30/DPNP on December 16, 2011 , Non- Performing Loans can be calculated by the formula:
NPL assessment criteria according to Bank Indonesia regulation no. 15/2/PBI/2013 as follows:
The increase in NPL in large numbers can cause problems for the health of banks, therefore banks are required to always maintain credit that is not in a high NPL position in table 7.
| Table 7 Assessment of Non-Performing Loan Ratio | ||
| Predicate | NPL Ratio (%) | Credit Value (%) |
| Healthy | 00,00 -NPL < 10,35 | 81- 100 |
| Fairly Healthy | 10,35 < NPL < 12,60 | 66 < 81 |
| Un Healthy | 12,60 < NPL < 14.85 | 51 < 66 |
| Not Healthy | NPL >14,85 | 00 < 51 |
In order to determine the fair or healthy level, an appropriate standard measure for NPL is determined. In this case, Bank Indonesia stipulates that a reasonable level of NPL is 5% of the total loan portfolio.
Net Interest Margin (NIM)
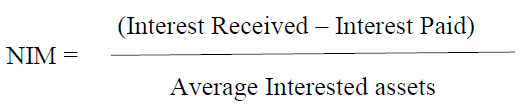
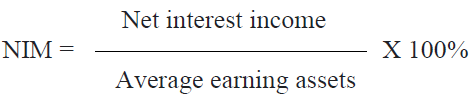
Net Interest Margin is a ratio used to measure the ability of bank management in managing its productive assets to earn net interest. According to Riyadi & Slamet (2006) Net Interest Margin is the ratio between Interest Income (bank interest income) minus interest expense (bank interest costs that become expenses) divided by Average Interest Earnings assets (average earning assets used). The greater the NIM, the higher the interest income obtained, according to the standards set by Bank Indonesia, the NIM ratio is > 6%.
Net Interest margin (NIM) is the ratio of Net Interest Income to interest assets is also known as “net yield on interest earnings assets”
Or
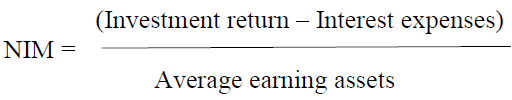
Federal Financial Institutions Examination Council (FFIEC) release average NIM for all U.S. bank average 3,8% James (2018).
Based on the circular letter of Bank Indonesia No. 6/23/DPNP dated May 31, 2004 NIM is calculated by the formula:
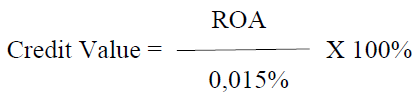
NIM Credit Value = NIM Value
Positive NIM means the Investment strategy pays more interest than it cost. If NIM negative means the investment strategy cost more than it makes in table 8.
| Table 8 Criteria for Determining the Net Interest Margin (NIM) Level | |||
| Rating | Ratio | Definition | Description |
| 1 | NIM>3% | The net interest margin is very high, meaning the NIM level is Very healthy | Very Healthy |
| 2 | 2%< NIM =3% | High net interest margin, meaning a healthy NIM level |
Healthy |
| 3 | 1,5% < NIM = 2% | The- net interest margin is quite high, meaning that the NIM level is quite healthy |
Healthy Enough |
| 4 | 1% < NIM = 1,5% | Low net interest margin leads to negative, meanin2 that the NIM level is unwell |
Unwell |
| T5 | NIM = 1% | Net interest margin is very low or negative, meanin2 that the NIM level is not healthy | Not Healthy |
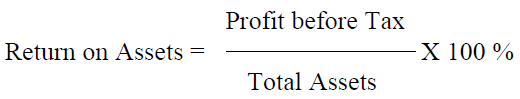
Bank Financial Performance
The bank's financial performance is measured by profitability/profitability, namely the bank's ability to generate profits to support expansion and cover risks as well as the level of efficiency or measure the level of efficiency and effectiveness of management in carrying out bank operations in table 8, table 9, table 10 & figure 1. In accordance with Bank Indonesia Regulation Number 91/PBI/2007 the components of profitability are:
| Table 9 Criteria for Deter Mining Return on Assets (ROA) | ||
| Rating | Criteria | Description |
| 1 | ROA = O% | Inadequate profitability |
| 2 | 0% < ROA = 0,5% | Low profitability is sufficient |
| 3 | 0,5% < ROA = 1,25% | Profitability is quite adequate |
| 4 | 1,25% < ROA = 1,5% | Adequate profitability |
| 5 | ROA > 1,5% | Profitability is very adequate |
| Table 10 Nilai Kredit DA Predikat ROA | ||
| ROA (%) | Credit Value BI Standard | Predicate |
| = 1,2 15 | 81 - 100 | Healthy |
| = 0,99 - < 1,215 | 66 = 81 | Healthy Enough |
| = O, 765 -< 0.999 | 51 = 66 | Un well |
| < 0,765 | 0 = 51 | Not Healthy |

Figure 1 Framework
1. The ability to generate profits, the ability to support expansion and cover risks, as well as the level of efficiency.
2. Diversification of income includes the ability of banks to earn fee-based income, and diversification of investment funds, as well as the application of accounting principles in revenue and expense recognition.
In this study used Return on Assets with the formula:
Framework and Hypothesis Design
Hypothesis Design:
H1: Non-Performing Loans (NPL) have a significant negative effect on the performance of Credit Card Issuing Banks.
H2: Net Interest Margin (NIM) has a significant positive effect on the performance of Credit Card Issuing Banks
H3: Non-Performing Loans (NPL) and Net Interest Margin (NIM) have a significant effect on the performance of Credit Card Issuing Banks
Partially:
1) Y = a + β1X1 +εo 2) Y = a + β2X2 +εo
Y = Performance of Credit Card Issuing Banks
a = Constant
β1 = Non-Performing Loan determination coeficiente
X1 = Non-Performing Loan
β2 = Net Interest Margin determination coeficiente
X2 = Net Interest Margin
Simultaneously:
Y = a + β1X1 + β2X2 + εo
Y = Performance of Credit Card Issuing Banks
a = Constant
β1 = Non-Performing Loan determination coeficiente
X1 = Non-Performing Loan
β2 = Net Interest Margin determination coeficiente
X2 = Net Interest Margin
εo = Other factors not studied
Effect of Non-Performing Loan (NPL) on Profitability (ROA)
Credit is the main source of income for banks, good bank performance is indicated by the smooth distribution of bank credit to the public. However, the high credit disbursement carried out by banks will also provide a high risk for banks, namely the occurrence of nonperforming loans and high NPLs.
If the debtor is unable to repay the credit loan, it will pose a risk of non-performing loans or non-performing loans. The high NPL ratio owned by the bank will affect the value of the bank's assets and the bank's ability to generate profits, it will have an impact on the profitability of the bank itself. Lukman Dendawijaya (2005) suggests that the consequences of the emergence of non-performing loans can be in the form of:
1) With the existence of non-performing loans, banks will lose the opportunity to earn income from the loans they provide, thereby reducing profits and adversely affecting bank profitability or profitability.
2) Return on Assets (ROA) decreased.
Based on the description above, it can be seen that non-performing loans affect bank profitability as measured by the rate of return on assets (ROA). So that if there is a nonperforming loan (Non-Performing Loan) where the debtor cannot repay the loan, this can disrupt the composition of the company's assets which causes disruption of the smooth running of the bank's business activities. Then the design hypothesis is
H1: Non-Performing Loans have a significant negative effect on Banking Performance
This agrees with the research conducted by:
(1) Besimir & Muhamet Aliu (2021) research results show that Non-Performing Loans have a significant negative effect on bank profitability, Likewise research conducted by (2) Adamu Yahaya et al., (2021) in Nigeria gives the results that Non-Performing Loans and Net Interest margin significant effect on bank performance in sub-Saharan African Economies, (3) Stefano & Dewi (2022), (4) Barus (2016) analysis Non-Performing Loan on Public Bank in Indonesia , (5) Ferreira (2022), (6) Chowdhury(2020), Non-Performing Loan in Bangladesh and Adisaputra (2012) , Analysis Non-Performing Loan factors in Bank Mandiri.
The Effect of Nim on Bank Performance
NIM is used to measure management's ability to manage its productive assets so that it has a positive relationship with bank performance, the hypothesis design is:
H2: NIM has a significant positive effect on bank performance
This is in line with research conducted by: (1) Barus (2016) in Analysis Non- Performing Loan on Public Bank in Indonesia, (2) Adisaputra (2012), (3) Saksonova (2014), Alnabulsi et al., (2013), (4) Stefano & Dewi (2022) and (5) Listyorini (2012) Analysis the influence of CAMEL to Public Bank.
The Influence of NPL and NIM on Bank Performance
Non-Performing Loans and Net Interest Margin simultaneously affect bank performance, so the hypotheses are designed as follows:
H3: NPL and NIM have a positive and significant effect on bank performance
Research Results
The credit card issuing banks that have obtained permission from Bank Indonesia are as follows in table 11:
| Table 11 List of Bank Issuing Credit Card Issuers | |||
| No. | Name of Bank Issuing Credit Card | No. | Nameof Bank Issuing Credit Card |
| 1 | BANK BUKOPIN | 14 | BANK PERMATA |
| 2 | BANK CENTRAL ASIA | 15 | BANK QNB INDONESIA |
| 3 | BANK CIMB NIAGA | 16 | BANK RAKYAT INDONESIA |
| 4 | BANKDANAMON INDONESIA | 17 | BANK SINARMAS |
| 5 | BANK DBS INDONESIA | 18 | BANK UOB INDONESIA |
| 6 | BANK HSBC INDONESIA | 19 | BANK SYARIAH INDONESIA |
| 7 | BANK MNC INTERNASIONAL | 20 | CITIBANK |
| 8 | BANK ICBC INDONESIA | 21 | PAN INDONESIA BANK |
| 9 | BANKMANDIRI(Persero) | 22 | STANDARD CHARTERED |
| 10 | BANK MAYBANK INDONESIA | 23 | BANK MAYAPADA |
| 11 | BANK MEGA | 24 | PT. AEON CREDIT SERVICES |
| 12 | BANK NEGARA INDONESIA | 25 | PT. SHINHAN INDO FINAN CE |
| 13 | BANK OCBC NISP | ||
Of the 25-bank issuing credit card, 1 non-bank company, namely PT Aeon Credit Service and 1 bank, namely Bank Syariah Indonesia, were excluded in this study because they used a different basis. So, the number of credit card issuers is 23 credit card issuing banks with the year of observation from 2016 to 2021.
Statistics of descriptive Non-Performing Loan Bank issuing Credit card as follows:
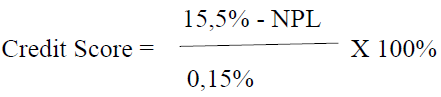
Based on table 12 and Figure 2, it can be seen that the NPL of credit card issuing banks still meets the standards applied by Bank Indonesia, which is still below 5%, an average of 1.6 and the highest of 6.37 occurred at KB Bukopin bank in 2017 and the lowest of 0.01 occurred at Bank CIMB Niaga in 2019 using the credit scoring calculation formula, all obtained a score of 1, meaning that they were still in the healthy predicate category.
| Table 12 Non-Performing Loans of Bank Issuing Credit Card in 2016 – 2021 | ||||||||||||
| No | Bank Issuing Credit Card | Non – Performing Loan ( NPL ) | AVG | Credit Score | Descripti on | Predicate | ||||||
| 2016 | 201 7 |
201 8 |
2019 | 2020 | 2021 | |||||||
| 1 | BRI | 1,09 | 0,88 | 0,9 2 |
1,04 | 0,80 | 0,70 | 0,91 | 97,30 | Very Good |
Healthy | |
| 2 | MANDIRI | 1,38 | 1,06 | 0,6 7 |
0,84 | 0,43 | 0,41 | 0,80 | 98,01 | Very Good |
Healthy | |
| 3 | BCA | 0,31 | 0,45 | 0,4 5 |
0,47 | 0,74 | 0,78 | 0,53 | 99,78 | Very Good |
Healthy | |
| 4 | BNI 46 | 0,44 | 0,70 | 0,8 5 |
1,25 | 0,95 | 0,73 | 0,82 | 97,87 | Very Good |
Healthy | |
| 5 | MAYBANK | 2,37 | 1,83 | 1,5 7 |
2,11 ER |
2,52 | 2,82 | 2,20 | 88,64 | Good | Healthy | |
| 6 | PANIN | 0,47 | 0,52 | 0,7 4 |
0,97 | 0,50 | 0,90 | 0,68 | 98,78 | Very Good |
Healthy | |
| 7 | CIMB NIAGA |
2,19 | 2,17 | 0,0 2 |
0,01 | 1,42 | 1,17 | 1,16 | 95,58 | Very Good |
Healthy | |
| 8 | DANAMON | 1,96 | 1,88 | 2,0 5 |
2,15 | 0,91 | 0,37 | 1,55 | 92,98 | Very Good |
Healthy | |
| 9 | PERMATA | 2,24 | 1,67 | 1,7 3 |
1,34 | 1,04 | 0,69 | 1,45 | 93,66 | Very Good |
Healthy | |
| 10 | MEGA | 2,59 | 1,41 | 1,2 7 |
2,25 | 1,07 | 0,81 | 1,57 | 92,89 | Very Good |
Healthy | |
| 11 | CITIBANK | 0,94 | 0,54 | 0,5 2 |
0,45 | 0,42 | 0,46 | 0,56 | 99,63 | Very Good |
Healthy | |
| 12 | UOB IND | 2,61 | 0,93 | 0,8 9 |
1,19 | 1,51 | 2,22 | 1,56 | 92,94 | Very Good |
Healthy | |
| 13 | OCBC NISP | 0,77 | 0,72 | 0,8 2 |
0,78 | 0,79 | 0,91 | 0,80 | 98,01 | Very Good |
Healthy | |
| 14 | HSBC IND | 3,90 | 1,70 | 1,2 2 |
1,22 | 0,94 | 0,79 | 1,63 | 92,48 | Very Good |
Healthy | |
| 15 | STANDCH ART |
1,44 | 1,11 | 0,4 9 |
0,98 | 0,43 | 0,48 | 0,82 | 97,86 | Very Good |
Healthy | |
| 16 | ICBC IND | 2,09 | 2,06 | 2,4 7 |
1,77 | 2,88 | 2,53 | 2,30 | $ 8,00 | Good | Healthy | |
| 17 | KB BUKOPIN |
2,79 | 6,37 | 4,7 5 |
4,45 | 4,95 | 4,91 | 4,70 | 71,98 | Good | Healthy | |
| 18 | MNC | 2,38 | 2,82 | 3,4 3 |
3,57 | 3,63 | 2,81 | 3,11 | 82,62 | Good | Healthy | |
| 19 | SINAR MAS |
1,47 | 2,34 | 2,7 3 |
4,33 | 1,39 | 1,18 | 2,24 | 88,40 | Good | Healthy | |
| 20 | QNB IND | 2,94 | 1,14 | 1,4 7 |
4,45 | 1,21 | 0,04 | 1,88 | 90,83 | Very Good |
Healthy | |
| 21 | MAYAPAD A |
1,22 | 4,20 | 3,2 6 |
1,63 | 1,60 | 2,17 | 2,35 | 87,69 | Good | Healthy | |
| 22 | DBS INDONESI A |
1,62 | 0,98 | 0,9 4 |
1,04 | 1,32 | 0,77 | 1,11 | 95,92 | Very Good | Healthy | |
| 23 | SHINHAN INDO |
0,92 | 0,74 | 0,4 3 |
1,98 | 4,24 | 2,95 | 1,88 | 90,82 | Very Good |
Healthy | |

Figure 2 Chart Non Performing Loan Bank Issuing Credit Card 2016 – 2021
Source: https://www.ojk.go.id (processed)
Statistical Descriptive Net Interest Margin of the bank issuing credit card as follows:
Based on table 13 and Figure 3, it is found that the average Net Interest Margin of credit card issuing banks is 4.54%, which is still above the Bank Indonesia regulation, which is 3%. The highest NIM was achieved by Bank Rakyat Indonesia at 8.27% in 2016 and the lowest was experienced by Bank CIMB Niaga at 0.05 in 2018 and 2019. Based on the credit score, it was obtained that there were 2 banks in rating 2, namely the NIM ratio in the range of 2 % < NIM < 3% with healthy category, namely bank ICBC Indonesia and KB Bukopin. There is 1 bank that is in rating 3, namely NIM in the range of 1.5% < NIM < 2% with a fairly healthy category, namely QNB Indonesia bank, while 20 other banks have a rating of 1 which is very healthy.
| Table 13 Net Interest Margin of Bank Issuing Credit Card Issuing for 2016 – 2021 | |||||||||||
| NO | Bank Issuing Credit Card | Net Interest Margin (NIM ) | AVG | Credit Score | Description | Predicate | |||||
| 2016 | 2017 | 2018 | 2019 | 2020 | 2021 | ||||||
| 1 | BRI | 8,27 | 7,93 | 7,45 | 6,98 | 6,00 | 6,89 | 7,25 | 7,25 | Very Healthy | 1 |
| 2 | MANDIRI | 6,29 | 5,63 | 5,52 | 5,46 | 4,48 | 4,73 | 5,35 | 5,35 | Very Healthy | 1 |
| 3 | BCA | 6,81 | 6,19 | 6,13 | 6,24 | 5,70 | 5,10 | 6,03 | 6,03 | Very Healthy | 1 |
| 4 | BNI 46 | 6,17 | 5,50 | 5,29 | 4,92 | 4,50 | 4,67 | 5,18 | 5,18 | Very Healthy | 1 |
| 5 | MAYBANK | 4,59 | 4,49 | 4,35 | 4,14 | 3,79 | 3,95 | 4,22 | 4,22 | Very Healthy | 1 |
| 6 | PANIN | 4,94 | 4,49 | 4,61 | 4,63 | 4,46 | 4,88 | 4,67 | 4,67 | Very Healthy | 1 |
| 7 | CIMB NIAGA | 5,47 | 5,45 | 0,05 | 0,05 | 4,75 | 4,71 | 3,41 | 3,41 | Very Healthy | 1 |
| 8 | DANAMON | 7,36 | 7,03 | 6,22 | 5,31 | 5,02 | 5,19 | 6,02 | 6,02 | Very Healthy | 1 |
| 9 | PERMATA | 3,93 | 3,99 | 4,11 | 4,39 | 4,56 | 4,02 | 4,17 | 4,17 | Very Healthy | 1 |
| 10 | MEGA | 7,01 | 5,80 | 5,19 | 4,90 | 4,42 | 4,75 | 5,35 | 5,35 | Very Healthy | 1 |
| 11 | CITI BANK | 6,24 | 6.36 | 5,79 | 5,91 | 4,80 | 4,03 | 5,52 | 5,52 | Very Healthy | 1 |
| 12 | UOB IND | 4,30 | 3,85 | 3,79 | 3,65 | 3,82 | 3,81 | 3,87 | 3,87 | Very Healthy | 1 |
| 13 | OCBC NISP | 4,62 | 4,47 | 4,15 | 3,95 | 3,96 | 3,82 | 4,16 | 4,16 | Very Healthy | 1 |
| 14 | HSBC IND | 5,43 | 5,25 | 4,64 | 4,39 | 4,03 | 3,36 | 4,52 | 4,52 | Very Healthy | 1 |
| 15 | STANDCHART | 4,87 | 4,26 | 4,38 | 4,32 | 2,95 | 1,94 | 3,79 | 3,79 | Very Healthy | 1 |
| 16 | ICBC IND | 3,24 | 2,99 | 2,35 | 2,00 | 1,96 | 2,36 | 2,48 | 2,48 | Healthy | 2 |
| 17 | KB BUKOPIN | 3,88 | 2,89 | 2,83 | 2,08 | 0,61 | 1,25 | 2,26 | 2,26 | Healthy | 2 |
| 18 | MNC | 3,28 | 3,04 | 4,10 | 4,17 | 4,01 | 3,80 | 3,73 | 3,73 | Very Healthy | 1 |
| 19 | SINAR MAS | 6,44 | 6,46 | 7,61 | 7,31 | 6,25 | 5,79 | 6,64 | 6,64 | Very Healthy | 1 |
| 20 | QNB IND | 2,25 | 1,22 | 1,73 | 2,56 | 1,61 | 2,34 | 1,95 | 1,95 | Healthy Enough | 3 |
| 21 | MAYAPADA | 5,16 | 4,26 | 4,09 | 3,61 | 0,47 | 0,69 | 3,05 | 3,05 | Very Healthy | 1 |
| 22 | DBS IND | 4,96 | 5,21 | 5,35 | 5,25 | 5,53 | 5,13 | 5,24 | 5,24 | Very Healthy | 1 |
| 23 | SHINHAN INDO | 5,05 | 5,31 | 4,47 | 3,32 | 2,42 | 2,32 | 3,82 | 3,82 | Very Healthy | 1 |

Figure 3 Chart Net Interest Margin Bank Issuing Credit Card Year 2016 – 2021
Source: http://www.ojk.go.id (processed)
Descriptive Statistics Return on Assets of Bank Issuing Credit Card 2016 – 2021
Based on table 14 and Figure 4, it is obtained that the average Return on Assets within a period of 6 years is 1.22%, maximum 4.67% and minimum -8.56%. Based on the standard credit score of Bank Indonesia, 10 banks were declared very adequate, 2 banks were declared adequate, 6 banks were declared enough adequate, 4 banks were declared inadequate and 1 bank was less adequate.
| Table 14 Return on Assets of Bank Issuing Credit Card 2016 – 2021 | |||||||||||
| N o |
Bank Issuing Credit card | Return on Assets (ROA ) | AV G | Credit Score | Description | Predicate | |||||
| 201 6 |
201 7 |
201 8 |
201 9 |
202 0 |
202 1 |
||||||
| 1 | ICBC IND | 3,84 | 3,6 9 |
3,6 8 |
3,50 | 1,98 | 2,7 2 |
3,24 | 215,67 | Very Adequate | Healthy |
| 2 | MANDIRI | 1,95 | 2,7 2 |
3,1 7 |
3,03 | 1,64 | 2,5 3 |
2,51 | 167,11 | Very Adequate. |
Healthy |
| 3 | BCA | 3.93 | 3,8 9 |
4,0 1 |
4,02 | 3,32 | 3,4 1 |
3,76 | 250,89 | Very Adequate |
Healthy |
| 4 | BNI 46 | 2,69 | 2,7 5 |
2,7 8 |
2,42 | 0,54 | 1,4 3 |
2,10 | 140,11 | Very Adequate |
Healthy |
| 5 | MAYBANK | 1,48 | 1,2 3 |
1,4 8 |
1,09 | 0,82 | 1,0 0 |
1,18 | 78,89 | Adequate | Enough healthy |
| 6 | PANIN | 1,68 | 1,8 7 |
2,2 5 |
2,09 | 2,08 | 1,7 3 |
1,95 | 130,00 | Very Adequate |
Healthy |
| 7 | CIMB NIAGA | 1,19 | 1,6 7 |
0,0 2 |
0,02 | 0,99 | 1,7 5 |
0,94 | 62,67 | Enough Adequate |
Enough healthy |
| 8 | DANAMON | 2,26 | 3,0 0 |
2,9 9 |
2,95 | 0,87 | 1,0 2 |
2,18 | 145,44 | Very Adequate |
Healthy |
| 9 | PERMATA | 4,89 | 0,6 1 |
0,7 8 |
1,30 | 0,97 | 0,7 3 |
0,08 | 5,56 | Inadequate | Not healthy |
| 1 0 |
MEGA | 2,36 | 2,2 4 |
2,4 7 |
2,90 | 3,64 | 4,2 2 |
2,97 | 198,11 | Very Adequate |
Healthy |
| 1 1 |
CITI BANK | 4,14 | 4,3 4 |
3,2 2 |
4,67 | 3,91 | 1,5 6 |
3,64 | 242,67 | Very Adequate |
Healthy |
| 1 2 |
UOB IND | 0,77 | 0,3 2 |
0,7 1 |
0,87 | 0,70 | 0,7 1 |
0,68 | 45,33 | Enough Adequate |
Unwell |
| 1 3 |
OCBC NISP | 1,85 | 1,9 6 |
2,1 0 |
2,22 | 1,47 | 1,5 5 |
1,86 | 123,89 | Very Adequate |
Healthy |
| 1 4 |
HSBC IND | 0,47 | 1,7 8 |
1,1 3 |
2,72 | 1,56 | 1,5 3 |
1,53 | 102,11 | Very Adequate |
Healthy |
| 1 5 |
STANDCHART | 0,58 | 0,3 2 |
1,2 6 |
0,70 | 1,82 | 0,6 3 |
0,89 | 59,00 | Enough Adequate | Unwell |
| 1 6 |
ICBC IND | 1,61 | 0,8 3 |
0,2 8 |
0,22 | 0,05 | 0,9 6 |
0,66 | 43,89 | Enough Adequate |
Not healthy |
| 1 7 |
KB BUKOPIN | 1,38 | 0,0 9 |
0,2 2 |
0,13 | - 4,61 | - 4,9 3 |
- 1,29 | 85,78 | Inadequate | Not healthy |
| 1 8 |
MNC | 0,11 | - 7,4 7 |
0,7 4 |
0,27 | 0,15 | 0,1 8 |
- 1,00 | I 66,89 | Inadequate | Not healthy |
| 1 9 |
SINAR MAS | 1,72 | 1,2 6 |
0,2 5 |
0,23 | 0,30 | 0,3 4 |
0,68 | 45,56 | Enough Adequate |
Not healthy |
| 2 0 |
QNB IND | - 3,37 |
3,7 2 |
0,1 2 |
0,02 | 1,24 | 8,5 0 |
2,78 | 185,44 | Inadequate | Not healthy |
| 2 1 |
MAYAPADA | 2,03 | 1,3 0 |
0,7 3 |
0,78 | 0,12 | 0,0 7 |
0,84 | 55,89 | Enough Adequate |
Unwell |
| 2 2 |
DBS IND | 1,30 | 1,0 2 |
0,0 5 |
0,28 - |
0,20 | 0,9 5 |
0,47 | 31,56 | Less adequate | Not healthy |
| 2 3 |
SHINHAN INDO | 0,75 | 2,1 9 |
1,9 8 |
0,43 | 0,86 | 0,7 6 |
1,16 | 77,44 | Adequate | Enough healthy |

Figure 4 Chart Return on Assets Bank Issuing Credit Card Year 2016 -2021
The conclusions of the descriptive statistics are as follows in table 15:
| Table 15 Descriptive Statistics | |||||
| N | Minimum | Maximum | Mean | Deviation Std. | |
| X1 NPL | 144 | 0.01 | 6.37 | 1.5972 | 1.17533 |
| X2 NIM | 144 | 0.05 | 8.27 | 4.5443 | 1.63293 |
| Y ROA | 144 | -8.5 | 4.67 | 1.2172 | 1.94557 |
| Valid N ( list wise ) | 144 | ||||
Classical Assumption Test
Normality Test Results
The results of the Kolmogorov-Smirnov One-Sample test are presented in the following table:
Based on table 16 shows that the data is not normally distributed, then the data is transformed by means of rank cases. After rank cases were carried out, the data became normal with a residual probability value of 0.001 smaller than 0.05 which indicates that the data is not normally distributed to be normal, which is 0.200 greater than 0.05 which can be seen in the following figure:
| Table 16 One-Sample Kolmogorov-Smirnov Test | ||
| Unstandardized Residual | ||
| N | 144 | |
| Normal Parameters a,b | Mean | .0000000 |
| Std . Deviation | 1.51795833 | |
| Most Extreme Differences | Absolute | 0.134 |
| Positive | 0.09 | |
| Negative | -0.134 | |
| Test Statistic | 0.134 | |
| Asymp , Sig . ( 2 - tailed ) | .000c | |
b. Calculated from data.
c. Lilliefors Significance Correction.
Source: Data processed by SPSS
The test results show that the data is normally distributed, indicated by the residual probability value of 0.200 which is greater than 0.05. This is also supported by the results of Figure 5 and Figure 6 histogram and p-plot (Table 17).

Figure 5 Histogram Normality Test
Source: Data processed by SPSS\

Figure 6 P-Plot Normality Test Result
Source: Data processed by SPSS
| Table 17 One-Sample Kolmogorov-Smirnov Test | ||
| Unstandardized Residual | ||
| N | 40 | |
| Normal Parameters a,b | Mean | .0000000 |
| Std Deviation | .86410360 | |
| Most Extreme Differences | Absolute | .093 |
| Positive | .093 | |
| Negative | -.058 | |
| Test Statistic | .093 | |
| Asymp Sig. (2-tailed) | 200c,d | |
b. Calculated from data.
c. Lilliefors Significance Correction.
d. This is a lower bound of the true significance.
Source: Data processed by SPSS
Multicollinearity Test Results
Table 18 shows that there is no multicollinearity, this is indicated by the Non- Performing Laon tolerance variable of 0.962 and the VIF value of 1.040, the Net Interest Margin variable with a tolerance value of 0.962 and a VIF value of 1.040. The tolerance and VIF values of all independent variables show that there is no multicollinearity, because the VIF value < 10 and the tolerance value > 0.01, there is no correlation between the independent variables.
| Table 18 Multicollinearity Test Results | ||||||||
| Coefficients | ||||||||
| Model | B | Unstandardized Coefficients Std Error | Standardize d Coefficients Beta | t | Sig. | Collinea rity Toleran ce | Statistic s VIF | |
| (Constan | .000 | .068 | .002 | 999 | ||||
| t) | ||||||||
| Normal | ||||||||
| Score | ||||||||
| of X1 NPL using |
-410 | .070 | -,410 | - 5.843 | .000 | .962 | 1.040 | |
| 1 | Blom's | |||||||
| Formula | ||||||||
| Normal | ||||||||
| Score of | ||||||||
| X2 NIM using |
419 | .070 | .419 | 5.973 | .000 | .962 | 1.040 | |
| Blom's | ||||||||
| Formula | ||||||||
Source: Data processed by SPSS
Heteroscedasticity Test Results
The heteroscedasticity test in this study uses a scatterplot, the results show the points of a certain pattern such as widening, wavy, or narrowing, meaning that heteroscedasticity occurs. The results of the scatterplot graph are as follows:
Figure 7 shows that the scatterplot graph shows that the points spread between the top and bottom of the zero point. No particular pattern is formed. So, it can be concluded that there is no heteroscedasticity in this study.

Figure 7 Scatterplot Chart
Source: Data processed by SPSS
Autocorrelation Test Results
The test results of the Durbin-Watson Test method are as follows:
Table 19 results from the Durbin Watson score of 1.822 which lies between (DU) and (4-DU) with the criteria obtained are dU < d < 4-dU, namely 1.6589 < 1.822 < 2.3411. It can be concluded that there is no autocorrelation.
| Table 19 UJI Durbin-Watson Test Result | ||||
| Model Summaryb | ||||
| Model | R R Square | Adjusted Square | Std. Error of the Estimate | Durbin-Watson |
| 1 | .642a .412 | .402 | .766053 | 1.822 |
Dependent Variable: Normal Score of Y_ROA using Blom's Formula
Source: Data processed by SPSS
Multiple Linear Analysis Results
Multiple linear analysis test results:
Base on table 20 multiple linear equations are as follows:
| Table 20 Multiple Linear Analysis | ||||||
| Unstandardized Coefficients | Standardized Coefficients | |||||
| Models | B | Std. Error | Beta | T | Sig. | |
| 1 | (Constant) | .000 | .068 | .002 | .999 | |
| Normal Score of X1_NPL using Blom's Formula | -410 | .070 | -410 | - 5.843 | .000 | |
| Normal Score of X2_NIM using Blom's Formula |
.419 | .070 | 419 | 5.973 | .000 | |
Source: Data processed by SPSS
ROA = 0,000 – 0,410 NPL + 0.419 NIM
Coefficient of Determination (R2)
The coefficient of determination analysis was conducted to determine and measure how much influence the independent variable had on the dependent variable simultaneously.
Based on the calculation of table 21, the coefficient of determination shows 41.20% meaning : Non-performing loans and Net Interest Margin affect profitability. The remaining 59.80% is influenced by other variables.
| Table 21 Pearson Product Moments | |||||
| Model Summaryb | |||||
| Model | R | R Square | Adjusted R Square | Std. Error of the Estimate |
Durbin-Watson |
| 1 | .642a | .412 | .402 | .7660533 | 1.822 |
b. Dependent Variable: Normal Score of Y_ROA using Blom's Formula
Source: Data processed by SPSS
Conclusion
Based on the framework, it can be concluded as follows:
1. Non-performing loans of credit card issuing banks from 23 banks studied, there are 6 banks (26.08%) in good category, the rest 17 banks (73.92%) in very good category, and still above the Bank Indonesia regulation, which is equal to 5%.
2. Net Interest Margin from 23 credit card issuing banks, 2 banks (8.69%) in good category and the remaining 21 banks (91.31%) in very good category, and still above the Bank Indonesia regulation, which is at least 3%.
3. Return on Assets from 23 credit card issuing banks here are very varied with the following details: 10 banks (43.48%) in the healthy category, 3 banks (13.04%) in the fairly healthy category, 3 banks (13.04 %) in the unhealthy category and 7 banks (30.44%) in the unhealthy category.
4. The results of hypothesis testing show that Non-Performing Loans on Return on Assets have a significant negative effect, while Net Interest Margin has a positive effect on Return on Assets and simultaneously Non-Performing Loans and Net Interest Margins affect Return on Assets by 41.20%, while 59.80% was influenced by other factors not examined.
Suggestions
The management of credit card issuing banks must improve their performance, especially return on Assets so that banks can increase their income in the form of Net Interest Margin and suppress Non-Performing Loans. The key is to control lending so that banks do not experience difficulties in increasing their income.
References
Adicondro, Y.Y. (2015). Analisis Pengaruh Pertumbuhan GDP, tingkat suku bunga, pertumbuhan expor, pertumbuhan Kredit dan BOPO terhadap Non-Performing Loan pada Bank Umum di Indonesia tahun 2010 – 2014. Universitas Diponegoro.
Alnabulsi, K., Kozarević, E., & Hakimi, A. (2023). Non-Performing Loans and Net Interest Margin in the MENA Region: Linear and Non-Linear Analyses. International Journal of Financial Studies, 11(2), 64.
Indexed at, Google Scholar, Cross Ref
Bank Indonesia. (2004). Surat Edaran No 6/23/DPNP tanggal 31Mei.
Bank Indonesia. (2011). Daftar Istilah Sistem Pembayaran Indonesia Tahun 2011 Tentang Alat Pembayaran Tunai dan Non Tunai.
Bank Indonesia. (2011). Surat Edaran No 13/30/DPNP 16.
Bank Indonesia. (2013). Peraturan Bank Indonesia No. 15/2/PBI/2013.
Bank Indonesia. (2021). Regulation of Bank Indonesia No /27/DAAP/2021.
Barus, A. C. (2016). Analisis Faktor-Faktor yang Mempengaruhi non performing loan pada bank Umum di Indonesia. Journal Wira Ekonomi Mikroskil, 6(2), 113-122.
Indexed at, Google Scholar, Cross Ref
Besmir, C., & Aliu, M. (2021). Impact of non-performing loans on bank’s profitability: Empirical evidence from commercial banks in Kosovo.
Indexed at, Google Scholar, Cross Ref
Chowdhury, E. K. (2020). Non-performing loans in Bangladesh:Bank specific and macroeconomic effects. Journal of Business Administration, 41(2), 108-125.
Denda, W. L. (2005). Manajemen perbankan. Jakarta. Ghalia Indonesia, edisi kedua.
Ferreira, C. (2022). Determinants of non-performing loans: A panel data approach. International Advances in Economic Research, 28(3-4), 133-153.
Indexed at, Google Scholar, Cross Ref
Hariyani, I. (2010). Restrukturisasi dan penghapusan kredit macet. Elex Media Komputindo.
Listyorini, W. W. (2012). Analisis pengaruh camel terhadap kinerja perusahaan perbankan yang go publik. Dinamika Akuntansi Keuangan Dan Perbankan, 1(2).
Mudrajad (2011). Manajemen perbankan. Yogyakarta. BPFE Yogyakarta.
Riyadi & Slamet. (2006). Bank Assets and Liquidity Management. Edisi ke tiga. Jakarta. FEUI.
Saksonova, S. (2014). The role of net interest margin in improving banks’ asset structure and assessing the stability and efficiency of their operations. Procedsia-social and behavioral sciences, 150, 132-141.
Indexed at, Google Scholar, Cross Ref
Saputra, A. (2012). Analisis factor – factor yang mempengaruhi Non-Performing Loan pada PT Bank Mandiri (persero), Tbk.
Stefano, J., & Dewi, S. P. (2022). Determinants of Non-Performing Loans: Banking Sector Listed in Indonesia Stock Exchange. Journal Ekonomi, 27(03), 119-138.
Indexed at, Google Scholar, Cross Ref
Yahaya, A., Musa, A. B., & Jayeola, O. (2021). Non-performing loans, interest effect and bank performance in sub saharan african economies.