Research Article: 2019 Vol: 23 Issue: 1
Analysis of Size Portfolios and Risk Factor Loadings of Asset Pricing Models-Threshold Regression Approach (Evidence from PSX)
Salman Sarwat, Barret Hodgson University
Dr. Mohammad Kashif, Shaheed Zulfikar Ali Bhutto Institute of Science and Technology Danish Iqbal, Bahria University
Imran Umer Chhapra, Shaheed Zulfikar Ali Bhutto Institute of Science and Technology
Abstract
The objective of the study is to analysis portfolio returns and the performance of asset pricing models in the context of macroeconomic variables. Portfolios have been constructed on the basis of firms’ size; two equally weighted decile portfolios and two value weighed decile portfolios representing the cluster of the largest and smallest firms are included in the analysis along with market portfolio. Portfolio returns are regressed with the factor loadings of CAPM, three factor and five factor Fama and French asset pricing models. The relationship of portfolio returns and asset pricing models is evaluated in the presence of four macroeconomic variables namely interest rate, industrial production, producer price index and exchange rate; each macroeconomic variable is introduced separately in threshold regression to the identify regime shift effect. Analyses are performed on monthly returns of securities listed on PSX during the period from 2000 to 2010. Results of the study have revealed that only interest rate and exchange rate are found to have threshold effect on the portfolio returns. According to the results, threshold effect is frequently captured through three factors Fama French model. Finally, the results also suggest that the threshold effect is only evident with large firms portfolios.
Keywords
CAPM, Fama and French Model, Threshold Regression, Regime Shift.
Introduction
Background of the Study
Empirical asset pricing is one of the emerging areas in the field of capital market investment. The quest for the identification of market factors which can influence the risk return characteristics of a security resulted in the augmentation of capital asset pricing model. CAPM provides a framework for driving the intrinsic value of the securities based on systematic risk. In 1980, Roll and Ross worked on Arbitrage Pricing Theory (APT), which incorporates multiple risk factors in asset pricing. In 1993, Fama and French Multifactor Model based market anomalies, was a breakthrough in the area of asset pricing. They identified two additional factors i.e. firm size and firm value as market anomalies in capital asset pricing. Afterwards, Fama and French added two more factors i.e. profitability and investment as proxies for asset pricing. Fama and French (1993) applied their model in US stock markets; they used panel data having time dimension from 1962 to 1989 and cross section of 25 portfolios of three stock markets sorted by size and by value.
Research Problem
Considerable research has been performed to test the validity of these multifactor asset pricing models globally as well as domestically. Results are somewhat mix regarding the validity. One of the reasons for such mixed evidences might be the varying level of influence (regime shifts) of exogenous factors i.e. macroeconomic variables on capital market. But, there is hardly any study which investigates the possibility of multiple equilibriums in asset pricing, especially in the context of PSX. Threshold regression can be a good tool to identify multiple factor loadings in asset pricing model. Hansen (2000) states that threshold regression is applied to multiple equilibriums and split samples, where sampling is done on continuous variables like size of firm.
Objectives of the Study
The focus of this study is to analysis size portfolios and risk factor loadings of asset pricing models in the presence of certain macroeconomic variables with the help of Threshold regression approach. Incorporating macroeconomic variables in asset pricing will evaluate the impact of regime shifts and macroeconomic shocks on risk factor loadings. In addition to that this study is also aiming to investigate the variability found in previous studies regarding validity of asset pricing models, which is also a motivation of this study.
Limitations
1. The study is limited to four economic indicators as threshold variables.
2. The study is conducted up to second moment of return.
3. The sample frame of the study limited to 11 years (relatively short period for regime shifts).
4. Results are valid for PMX only, and cannot be generalized.
Organization of Study
This study is started with the background of the research problem, which is then linked with objective of the study. In the literature review, firstly we cited those research papers in which threshold regression is used in asset pricing, portfolio management, and finance in general. Selection of macroeconomic variables as threshold variables and empirical testing of asset pricing has also been covered, and finally, the theory development of asset pricing model has been discussed in the literature review. The frameworks of capital asset pricing model and Fama French Multifactor Model have also been presented in the study. Methodology section of the study encompasses research design, conceptual framework, data description, variable definitions and hypotheses. With 4 microeconomic variables, 3 asset pricing models and 5 types of portfolio, we have developed 60 hypotheses. Statistical analysis with their assumptions follows results with their interpretations and discussion, which leads to conclusion of the study.
Literature Review
Li and Chen (2016) have applied panel threshold regression to reexamining the relation between analysts’ forecast dispersion and stock returns. Their empirical results show that the degree of the negative association between analysts’ dispersion and future stock return becomes considerably diminished when the dispersion exceeds a threshold value. Bansal et al. (2017) have also applied threshold regression for Fama French styled portfolio analysis. They found that high-beta stocks and small-cap stocks (relative to low-beta and large-cap stocks):
1. Earn even a higher premia following periods that meet both top-quintile expected-volatility and bottomquintile intermediary-capital-ratio thresholds.
2. Earn a higher premia following a top-quintile expected-volatility threshold even in non-recessionary times.
3. Have a stronger negative sensitivity to illiquidity shocks.
4. Have greater fundamental-valuation ambiguity.
Taking macroeconomic variables as common risk factors for asset pricing in capital market is not new. Such attempts can be traced from Arbitrage Pricing Theory (APT) presented by Roll and Ross in 1976. But in our study, the difference is of number of hypotheses being developed. All in all, there are 60 hypotheses in this study. Such a huge number of hypotheses is because of the fact that we are simultaneously checking 4 microeconomic variables on 3 asset pricing models with 5 types of portfolios. This approach inculcates rigor in the analysis as supported by Zehetmayer et al. (2005) while proposing two stage design, and Hsuel et al. (2003) while providing a comparison of five alternative methods to control the error of false positive.
Broadly, multifactor asset pricing models can be dividing into two groups: market anomaly based models and macroeconomic factors based models, but amalgamation of these two approaches is an under-researched area in asset pricing. In this sense, this would be a novel work. As the focus in this study is to analysis size portfolios and risk factor loadings of asset pricing models in the presence of certain macroeconomic variables with the help of Threshold regression approach, the most relevant macroeconomic variables are needed to be selected. There can be two approaches for the appropriate selection of threshold variables, i.e. theoretical approach and empirical approach (Anigbogu and Nduka, 2014; Sabri and Sweis, 2015; Dasgupta, 2014; Tom and Munemo, 2015; Rauf, 2016; Waheed et al., 2017; Zhang and Ren, 2017; Khan and Ali, 2017; Salim and Hariandja, 2018; Lee and Chou, 2018; Inusah, 2018; Le et al., 2018).
Fama and French (1993) presented a multifactor model based on market anomalies. Schwert (2003) has stated that market anomalies refer to empirical findings, showing inefficiency of market in capital asset pricing and capturing the market behavior rather closely. Besides market risk, Fama and French (1993) identified two additional factors i.e. firm size and firm value as market anomalies for capital asset pricing. Carhart (1997) added momentum as one more factor in Fama and French model. In a recent study, Fama and French (2015) presented an augmented model with five factors by adding profitability and investment factors as proxies for asset pricing (Ali & Haseeb, 2019; Haseeb et al., 2018).
Portfolio Theory of Harry Markowitz (1952) provides foundation to the asset pricing. Portfolio Theory is basically a mean-variance framework for efficient portfolios selection. Capital market theory builds on portfolio theory; William Sharpe (1964), Linter (1965), and Mossin (1966) derived the CAPM independently. CAPM regresses excess returns of securities with the excess return of capital market portfolio. Roll and Ross (1980) presented empirical evidence of Arbitrage Pricing Theory (APT). This was the first step from single factor model to multifactor model for asset pricing. Banz (1981) has provided evidence that CAPM and APT models fail to identify cross sectional effects in returns. Fama and French started to check the validity of CAPM for US stocks in 1992 and found inability of the model to explain pricing of capital assets.
As the theory of asset pricing developed, its empirical testing was also being performed at the same time. Fama and French (1993) tested their model on NYSE, AMEX and NASDAQ, they used panel data having time dimension from 1962 to 1989, and cross section of 25 portfolios of three stock markets sorted by size and by value. Their results indicated negative relationship between size and returns whereas value as calculated by book to market ratio is positively correlated with returns (Suryanto et al., 2018).
They also found greater influence of value factor in comparison to size factor. Daniel and Titman (1997) studied the factors loadings of a multifactor model for stock markets of Euro zone by time series data from 1971 to 1993. They found no significant relationship of size and value factors with ROI of stocks. Halliwell et al. (1999) applied Fama and French model on Australian stock exchanges. According to their study small size and high value firms have higher returns. Yee (2006) investigated the application of Fama and French model in Malaysia. His results indicate negative relation between firm value and equity returns. Connor and Sehgal (2001) applied three factors Fama French model in Indian capital market; their results suggest that size and value factors are significant in the determination of equity returns in Indian stock exchange.
In the context of Pakistan, Nishat (2001) studied three factors Fama and French Model on KSE from January 1981 to December 1994 to evaluate mispricing with higher moments and found industry wise higher risk premium before financial reforms period. This study also indicated time varying risk factor betas. Iqbal and Brook (2007) investigated the risk return relationship for KSE and found the evidence of non-linearity between them. They rejected unconditional CAPM for KSE. The work of Nishat (2001), Iqbal (2006), Javed (2008) did not find empirical evidence as such to support the applicability of asset pricing models in case of Pakistan Stock Exchange.
Capital Asset Pricing Framework
Portfolio selection technique in Markowitz framework is based on mean-variance framework. Risk return relationship in a portfolio of Markowitz framework is explained through moments:
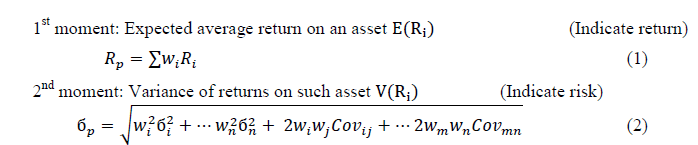
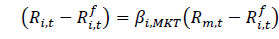
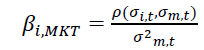
William Sharpe was pioneered in applying mean-variance framework in 1964 and developed a framework for capital asset pricing. For his valuable contribution, he was awarded noble prize in 1990. In Capital Asset pricing the excess individual security return is directly related with the excess return on the market portfolio and it can be written in equation as follow:
 (3)
(3)
Whereas,
 (4)
(4)
The asset pricing model given in equation 3 has wide spread application in finance. Betas from CAPM are used for calculating cost of capital, which is further applied in capital structure decision and for capital budgeting. This model was further extended by Jensen, Black and Scholes (1972). through the inclusion Jensen’s alpha.
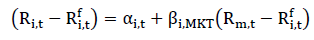 (5)
(5)
Fama & French Multifactor Model
Fama and French (1993) presented a multifactor model based on market anomaly. They argued that the market beta alone cannot properly capture stock returns. Their empirical studies were evident to the failure of traditional CAPM and even APT did not get support from their work. They proposed that two additional factors (market anomalies) size and value to be incorporated in stock pricing.
 (6)
(6)
Where,
 Size Factor (Return spread between small & big stocks).
 Value Factor (Return spread between high & low book-to-market ratio).
 Regression coefficients of above mentioned factors.
After a long span of time, Fama and French adjusted their three factor asset pricing model by introducing two additional factors profitability and investment.

Where
 Profitability Factor (Return spread between robust & weak profitable firms).
 Investment Factor (Return spread between conservative & aggressive investment firms).
 are regression coefficients profitability and investment factors respectively.
Fama and French (2015) empirically proved that the five-factor model works better than three-factor model in returns estimation but the model is not robust for low profitable and aggressive investment firms. Moreover, the  aggressive investment firms. Moreover, the factor behaved inversely in five-factor model. Pricing models stated in equations (3.14), (3.15) and (3.16) are the augmented version of traditional CAPM but all these models are limited to 2nd moment of returns.
There are studies incorporating higher moments of stock returns for capital asset pricing. Kostakis, Muhammad, and Siganos (2012) argued that CAPM with two moments is not an accurate predictor of stock returns and they applied third and fourth moments of stock returns. They priced the returns on London Stock Exchange with additional risk factors co-skewness and co-kurtosis in traditional CAPM and found improved performance of asset pricing model. In this study, traditional CAPM, three factor and five factor Fama and French model with second moment only have been taken to analysis the returns of size based portfolios in the presence certain macroeconomic variables.
Empirical approach has been employed for selection of threshold variables. In the empirical approach, macroeconomic variables are identified through meta-analysis of literature. For which, several papers on the application and empirical evidence of Arbitrage Pricing Theory (APT) have been reviewed. The study of Chen, Roll and Ross (1986) is an important work, from which macroeconomic variables can be identified. According to them, industrial production, the spread between long and short interest rates, is significant in capital asset pricing.
Antoniou and Priestley (1998) also examined the performance and empirical validity of APT in London Stock Exchange (LSE) with unexpected inflation, expected inflation, real industrial production, real money supply, commodity price, term structure, default rate, and exchange rate. Kim (2003) examined the long run relationships of industrial production, real exchange rate, interest rate, and inflation with aggregate stock prices listed in S&P 500 index. He found industrial production to be positively related to stock prices whereas real exchange rate, interest rate, and inflation have significant negative relationship. But, Jorion (1991) did not find exchange rate to be significant for asset pricing in the U.S. stock market. Alam and Uddin (2009) conducted study on the relationship of interest rate with stock prices for fifteen developing and developed countries on the monthly data from January 1988 to March 2003, and significant negative relationship of interest rate with stock price.
In another study, Mahmood and Dinniah (2007) analyzed dynamic relationship between macroeconomic indicators and stock prices in selected Asian-Pacific economies. They used foreign exchange rates, consumer price index and industrial production index as macroeconomic indicators. Ratanapakorn and Sharma (2007) studied long and short run relationships between the six macroeconomic variables and stock returns of S&P 500 index. Their results indicated negative relationship of long-term interest rate with stock returns, while money supply, industrial production, inflation, the exchange rate and short-term interest rate positively related to returns.
Nassah and Struss (2000) have studied long run relationship between share price and macroeconomic variables in six European countries. They found that stock prices have significant relationship with industrial production, survey of manufacturing orders, short and long term interest rates. Gallegati (2008) examined the lead/leg relation between industrial production index and Dow Jones Industrial Average index by applying signal decomposition techniques based on wavelet analysis. He found that stock market returns tend to lead the industrial production, but only for the higher periods of 16 months and longer.
Several studies on Arbitrage Pricing Model have been conducted in the context of Pakistan as well; for instance, Gul and Khan (2013) applied APT on monthly returns of KSE 100 Index from 2000 to 2005. They included four macroeconomic variables, Interest Rate, Money supply, Foreign Exchange Rate, and Industrial Production. Their study proved insignificance of overall ATP model in Pakistan. After reviewing various studies, four macroeconomic variables have been selected on the basis of significance, including interest rate (T Bills rate), large scale manufacturing index (industrial output), inflation (producer price index), and exchange rate.
Research Methodology
Research Design
This research is based on secondary financial and economic time series data. The study is primarily explanatory in nature. It investigates the relationships of equity portfolio returns in capital market, risk sensitivity, and major economic indicators. All the portfolios for this study have been constructed on the basis of market capitalization of the companies referred as size factor. These portfolios have been analyzed with three different asset pricing models in the presence of macroeconomic variable. There are five risk factors involved in these asset pricing models, namely systematic risk factor, size factor, value factor, profitability and investment. These factors have been analyzed with respect to their respective asset pricing model in the presence of four macroeconomic variables, which includes industrial production, producer price index, interest rate and exchange rate.
All the stocks traded in PSX during the period of analysis will be the unit of analysis; discrete returns of the stocks through simple yield will be computed for every tth month and excess returns will then be calculated by subtracting risk free rate of the return. Six months T-bill yield will be taken as a proxy of risk free returns. All PSX stocks will be arranged sequentially on the basis of firm size and divided into ten sections for portfolio construction. The excess returns each of the ten portfolios are regressed with excess return of the market and with other risk factors. The researchers’ interference is minimal and work is done in non-contrived settings.
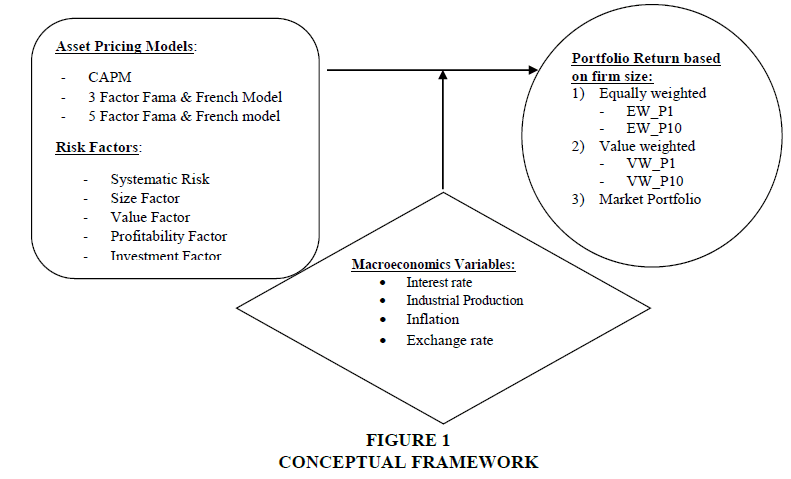
Figure 1: Conceptual Framework
Data Description and Sampling
Equity securities listed in Pakistan Stock Exchange is the target population, for which monthly time series data of equity prices from PSX-All index is used. The sample period is 11 years from January 2000 to December 2010, which accounts for 132 data points of time series. All in all, there were 949 companies listed in PSX (formerly KSE) at various points of time during the sample period; but after data cleansing, data set has shrunk to 535 companies only.
Price Data of listed companies is retrieved from the database of Thomson Reuters and Bloomberg. Monthly closing prices are taken to calculate discrete returns for each ith security for every tth month in the sample period. In some studies, daily returns are also used; although it enhances data size but it may cause noise as well, as French (1980) presented the weekend effect the stock returns, which is usually higher. Returns are calculated.
6-months’ T-bill yield is taken as proxy for risk free rate. Ten equally weighted as well as value weighted portfolios have been constructed after sorting the companies on market capitalization (proxy for firm size). Dependent variable in the model is excess return of the portfolios; whereas risk factors, namely systematic risk, size factor, value factor, profitability factor and investment factor, are independent variables in the model. Four macroeconomic variables, i.e. industrial production, PPI, interest rate, and exchange rate have been selected as moderating (or threshold) variable on the basis literature review. Monthly data of macroeconomic variables have been downloaded from IMF’s data portal called International Financial Statistics (IFS).
Calculation & Description of Variables
Return on Securities
Return of each security in a portfolio is calculated through following equation:
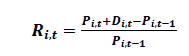 (8)
(8)
Where,
Ri,t = Discrete return on ith security for tth month.
Pi,t = Price of ith security at tth month.
Pi,t-1 = Price of ith security at one month prior to tth month.
Di,t = Dividend on ith security at tth month.
Excess returns can be calculated as: 
Where,
 = Six-month T bill yield for tth month (proxy for risk free return).
Portfolio Returns
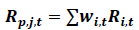
Where,
Rp,j,t = Return of jth portfolio for tth month.
Ri,t = Discrete return on ith security for tth month in jth portfolio.
wi,t = Weight of ith security in tth month for jth portfolio.
Excess Return-Systematic Risk
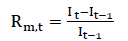
Systematic risk as pricing factor is introduced in CAPM and it continues in Fama and French 3 and 5 factors models. In asset pricing models, the coefficient of systematic risk is called market beta. Market return is calculated through PSX All Index (formerly KSE All Index) by applying following equation:
 (9)
(9)
Where,
Rm,t = Market return for tth month.
It = PSX All Index value at tth month.
It-1 = PSX All Index value at one month prior to tth month.
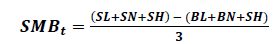
Size Factor (SMB: Small minus Big)
Three factor Fama & French model
 (10)
(10)
Where,
SMBt = Excess returns on Size factor for tth month
SL = Portfolio of small firms and low book-to-market equity ratio firms.
SN = Portfolio of small firms and neutral book-to-market equity ratio firms.
SH = Portfolio of small firms and high book-to-market equity ratio firms.
BL = Portfolio of big firms and low book-to-market equity ratio firms.
BN = Portfolio of big firms and neutral book-to-market equity ratio firms.
BH = Portfolio of big firms and high book-to-market equity ratio firms.
Five factor Fama & French model
 (11)
(11)
Where,
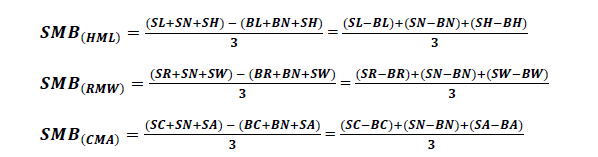
Value Factor (HML: High minus Low Book-to-Market)
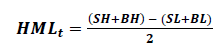
Profitability Factor (RMW: Robust minus Weak EBIT after deducting dividends)
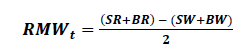 (12)
(12)
Investment Factor CMA (Conservative minus Aggressive attitude towards investment, net asset change basis)
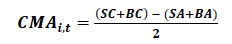 (13)
(13)
Hypotheses
Following null hypotheses are formulated in the study: Threshold Effect of Interest Rate (T-Bills Rate) on CAPM
a. There is no significant impact (threshold effect) of interest rate on CAPM when applied on market portfolio
• H1: TE Interest Rate, CAPM, Market Portfolio=0
b. There is no significant impact (threshold effect) of interest rate on CAPM when applied on equally weighted small size firms’ decile portfolio
• H2: TE Interest Rate, CAPM, EW_P1=0
c. There is no significant impact (threshold effect) of interest rate on CAPM when applied on equally weighted large size firms’ decile portfolio
• H3: TE Interest Rate, CAPM, EW_P10=0
d. There is no significant impact (threshold effect) of interest rate on CAPM when applied on value weighted small size firms’ decile portfolio
• H4: TE Interest Rate, CAPM, VW_P1=0
e. There is no significant impact (threshold effect) of interest rate on CAPM when applied on value weighted large size firms’ decile portfolio
• H5: TE Interest Rate, CAPM, VW_P10=0
Threshold Effect of Interest Rate (T-Bills Rate) on Three Factor Fama & French Model
a. There is no significant impact (threshold effect) of interest rate on 3 Factor Fama French model when applied on market portfolio on market portfolio
• H6: TE Interest Rate, 3 F Fama French, Market Portfolio=0
b. There is no significant impact (threshold effect) of interest rate on 3 Factor Fama French model when applied on equally weighted small size firms’ decile portfolio
• H7: TE Interest Rate, 3 F Fama French, EW_P1=0
c. There is no significant impact (threshold effect) of interest rate on 3 Factor Fama French model when applied on equally weighted large size firms’ decile portfolio
• H8: TE Interest Rate, 3 F Fama French, EW_P10=0
d. There is no significant impact (threshold effect) of interest rate on 3 Factor Fama French model when applied on value weighted small size firms’ decile portfolio
• H9: TE Interest Rate, 3 F Fama French, VW_P1=0
e. There is no significant impact (threshold effect) of interest rate on 3 Factor Fama French model when applied on value weighted large size firms’ decile portfolio
• H10: TE Interest Rate, 3 F Fama French, VW_P10=0
Threshold Effect of Interest Rate (T-Bills Rate) on Five Factor Fama & French Model
a. There is no significant impact (threshold effect) of interest rate on 5 Factor Fama French model when applied on market portfolio
• H11: TE Interest Rate, 5 F Fama French, Market Portfolio=0
b. There is no significant impact (threshold effect) of interest rate on 5 Factor Fama French model when applied on equally weighted small size firms’ decile portfolio
• H12: TE Interest Rate, 5 F Fama French, EW_P1=0
c. There is no significant impact (threshold effect) of interest rate on 5 Factor Fama French model when applied on equally weighted large size firms’ decile portfolio
• H13: TE Interest Rate, 5 F Fama French, EW_P10=0
d. There is no significant impact (threshold effect) of interest rate on 5 Factor Fama French model when applied on value weighted small size firms’ decile portfolio
• H14: TE Interest Rate, 5 F Fama French, VW_P1=0
e. There is no significant impact (threshold effect) of interest rate on 5 Factor Fama French model when applied on value weighted large size firms’ decile portfolio
• H15: TE Interest Rate, 5 F Fama French, VW_P10=0
Threshold Effect of Industrial Production (Large Scale Manufacturing Index) on CAPM
a. There is no significant impact (threshold effect) of industrial production on CAPM when applied on market portfolio
• H16: TE Industrial production, CAPM, Market Portfolio=0
b. There is no significant impact (threshold effect) of industrial production on CAPM when applied on equally weighted small size firms’ decile portfolio
• H17: TE Industrial production, CAPM, EW_P1=0
c. There is no significant impact (threshold effect) of industrial production on CAPM when applied on equally weighted large size firms’ decile portfolio
• H18: TE Industrial production, CAPM, EW_P10=0
d. There is no significant impact (threshold effect) of industrial production on CAPM when applied on value weighted small size firms’ decile portfolio
• H19: TE Industrial production, CAPM, VW_P1=0
e. There is no significant impact (threshold effect) of industrial production on CAPM when applied on value weighted large size firms’ decile portfolio
• H20: TE Industrial production, CAPM, VW_P10=0
Threshold Effect of Industrial Production (Large Scale Manufacturing Index) on Three Factor Fama & French Model
a. There is no significant impact (threshold effect) of industrial production on 3 F Fama French model when applied on market portfolio
• H21: TE Industrial production, 3 F Fama French, Market Portfolio=0
b. There is no significant impact (threshold effect) of industrial production on 3 F Fama French model when applied on equally weighted small firms’ portfolio
• H22: TE Industrial production, 3 F Fama French, EW_P1=0
c. There is no significant impact (threshold effect) of industrial production on 3 F Fama French model when applied on equally weighted large firms’ portfolio
• H23: TE Industrial production, 3 F Fama French, EW_P10=0
d. There is no significant impact (threshold effect) of industrial production on 3 F Fama French model when applied on value weighted small firms’ portfolio
• H24: TE Industrial production, 3 F Fama French, VW_P1=0
e. There is no significant impact (threshold effect) of industrial production on 3 F Fama French model when applied on value weighted large firms’ portfolio
• H25: TE Industrial production, 3 F Fama French, VW_P10=0
Threshold Effect of Industrial Production (Large Scale Manufacturing Index) on Five Factor Fama & French Model
a. There is no significant impact (threshold effect) of industrial production on 5 F Fama French model when applied on market portfolio
• H26: TE Industrial production, 5 F Fama French, Market Portfolio=0
b. There is no significant impact (threshold effect) of industrial production on 5 F Fama French model when applied on equally weighted small firms’ portfolio
• H274: TE Industrial production, 5 F Fama French, EW_P1=0
c. There is no significant impact (threshold effect) of industrial production on 5 F Fama French model when applied on equally weighted large firms’ portfolio
• H28: TE Industrial production, 5 F Fama French, EW_P10=0
d. There is no significant impact (threshold effect) of industrial production on 5 F Fama French model when applied on value weighted small firms’ portfolio
• H29: TE Industrial production, 5 F Fama French, VW_P1=0
e. There is no significant impact (threshold effect) of industrial production on 5 F Fama French model when applied on value weighted large size firms’ portfolio
• H30: TE Industrial production, 5 F Fama French, VW_P10=0
Threshold Effect of Inflation (Producer Price Index) on CAPM
a. There is no significant impact (threshold effect) of inflation on CAPM when applied on market portfolio
• H31: TE Inflation, CAPM, Market Portfolio=0
b. There is no significant impact (threshold effect) of inflation on CAPM when applied on equally weighted small size firms’ decile portfolio
• H32: TE Inflation, CAPM, EW_P1=0
c. There is no significant impact (threshold effect) of inflation on CAPM when applied on equally weighted large size firms’ decile portfolio
• H33: TE Inflation, CAPM, EW_P10=0
d. There is no significant impact (threshold effect) of inflation on CAPM when applied on value weighted small size firms’ decile portfolio
• H34: TE Inflation, CAPM, VW_P1=0
e. There is no significant impact (threshold effect) of inflation on CAPM when applied on value weighted large size firms’ decile portfolio
• H35: TE Inflation, CAPM, VW_P10=0
Threshold Effect of Inflation (Producer Price Index) on Three Factor Fama & French Model
a. There is no significant impact (threshold effect) of inflation on 3 Factor Fama French model when applied on market portfolio
• H36: TE Inflation, 3 F Fama French, Market Portfolio=0
b. There is no significant impact (threshold effect) of inflation on 3 Factor Fama French model when applied on equally weighted small size firms’ decile portfolio
• H37: TE Inflation, 3 F Fama French, EW_P1=0
c. There is no significant impact (threshold effect) of inflation on 3 Factor Fama French model when applied on equally weighted large size firms’ decile portfolio
• H38: TE Inflation, 3 F Fama French, EW_P10=0
d. There is no significant impact (threshold effect) of inflation on 3 Factor Fama French model when applied on value weighted small size firms’ decile portfolio
• H39: TE Inflation, 3 F Fama French, VW_P1=0
f. There is no significant impact (threshold effect) of inflation on 3 Factor Fama French model when applied on value weighted large size firms’ decile portfolio
• H40: TE Inflation, 3 F Fama French, VW_P10=0
Threshold Effect of Inflation (Producer Price Index) on Five Factor Fama & French Model
a. There is no significant impact (threshold effect) of inflation on 5 Factor Fama French model when applied on market portfolio
• H41: TE Inflation, 5 F Fama French, Market Portfolio=0
b. There is no significant impact (threshold effect) of inflation on 5 Factor Fama French model when applied on equally weighted small size firms’ decile portfolio
• H42: TE Inflation, 5 F Fama French, EW_P1=0
c. There is no significant impact (threshold effect) of inflation on 5 Factor Fama French model when applied on equally weighted large size firms’ decile portfolio
• H43: TE Inflation, 5 F Fama French, EW_P10=0
d. There is no significant impact (threshold effect) of inflation on 5 Factor Fama French model when applied on value weighted small size firms’ decile portfolio
• H44: TE Inflation, 5 F Fama French, VW_P1=0
e. There is no significant impact (threshold effect) of inflation on 5 Factor Fama French model when applied on value weighted large size firms’ decile portfolio
• H45: TE Inflation, 5 F Fama French, VW_P10=0
Threshold Effect of Exchange Rate (National Currency per US Dollar, Monthly Average) on CAPM
a. There is no significant impact (threshold effect) of exchange rate on CAPM when applied on market portfolio
• H46: TE Exchange rate, CAPM, Market Portfolio =0
b. There is no significant impact (threshold effect) of exchange rate on CAPM when applied on equally weighted small size firms’ decile portfolio
• H47: TE Exchange rate, CAPM, EW_P1=0
c. There is no significant impact (threshold effect) of exchange rate on CAPM when applied on equally weighted large size firms’ decile portfolio
• H48: TE Exchange rate, CAPM, EW_P10=0
d. There is no significant impact (threshold effect) of exchange rate on CAPM when applied on value weighted small size firms’ decile portfolio
• H49: TE Exchange rate, CAPM, VW_P1=0
e. There is no significant impact (threshold effect) of exchange rate on CAPM when applied on value weighted large size firms’ decile portfolio
• H50: TE Exchange rate, CAPM, VW_P10=0
Threshold Effect of Exchange Rate (National Currency per US Dollar, Monthly Average) on Three Factor Fama & French Model on Three Factor Fama & French Model
a. There is no significant impact (threshold effect) of exchange rate on 3 Factor Fama French model when applied on market portfolio
• H51: TE Exchange rate, 3 F Fama French, Market Portfolio=0
b. There is no significant impact (threshold effect) of exchange rate on 3 Factor Fama French model when applied on equally weighted small firms’ portfolio
• H52: TE Exchange rate, 3 F Fama French, EW_P1=0
c. There is no significant impact (threshold effect) of exchange rate on 3 Factor Fama French model when applied on equally weighted large firms’ portfolio
• H53: TE Exchange rate, 3 F Fama French, EW_P10=0
d. There is no significant impact (threshold effect) of exchange rate on 3 Factor Fama French model when applied on value weighted small firms’ decile portfolio
• H54: TE Exchange rate, 3 F Fama French, VW_P1=0
e. There is no significant impact (threshold effect) of exchange rate on 3 Factor Fama French model when applied on value weighted large firms’ decile portfolio
• H55: TE Exchange rate, 3 F Fama French, VW_P10=0
Threshold Effect of Exchange Rate (National Currency per US Dollar, Monthly Average) on Five Factor Fama & French Model
a. There is no significant impact (threshold effect) of exchange rate on 5 Factor Fama French model when applied on market portfolio
• H56: TE Exchange rate, 5 F Fama French, Market Portfolio=0
b. There is no significant impact (threshold effect) of exchange rate on 5 F Fama French model when applied on equally weighted small firms’ decile portfolio
• H57: TE Exchange rate, 5 F Fama French, EW_P1=0
c. There is no significant impact (threshold effect) of exchange rate on 5 F Fama French model when applied on equally weighted large firms’ decile portfolio
• H58: TE Exchange rate, 5 F Fama French, EW_P10=0
d. There is no significant impact (threshold effect) of exchange rate on 5 F Fama French model when applied on value weighted small firms’ decile portfolio
• H59: TE Exchange rate, 5 F Fama French, VW_P1=0
e. There is no significant impact (threshold effect) of exchange rate on 5 F Fama French model when applied on value weighted large size firms’ decile portfolio
• H60: TE Exchange rate, 5 F Fama French, VW_P10=0
Procedure of Analysis
The procedure of the study can be divided into following stages:
1. Computation of excess discrete market returns on monthly basis for each stock traded in PXS by subtracting risk free rate (six months T-bill yield).
2. Generate a series of monthly discrete market returns for ten years from 2000 to 2010 through PXS 100 Index (formerly KSE 100 Index) (taking as market portfolio).
3. Construction of decile portfolios based on size; both equally weighted and value weighted portfolios are constructed. Taking the smallest and the largest portfolios from equally weighted and value weighted sets of portfolio.
4. Generation of factor loadings for CAPM, Three Factor Fama & French model, and Five Factor Fama & French Model.
5. Introduction of macroeconomic factors as threshold variables in the asset pricing models to identify the impact of regime shift on pricing models for market portfolio as well as size based portfolios.
Statistical Tools
Threshold regression
Threshold Regression (TR) model is applied to show linear piecewise relationship of nonlinear relation of a variable or a set of variables in a model. The piecewise linear relationship is shown in terms of threshold value of the variable. The threshold value is unknown and determined through internal sorting, which may be more than one depending upon nonlinearity of relationship. Threshold Regression can be used for identifying multiple equilibriums, empirical sample splitting, and to study the impact of macroeconomic shocks. Hansen (2000) developed the statistical theory for threshold regression.
Newey-West Estimator
Whitney K. Newey and Kenneth D. West developed this estimator in 1987. For regression-type model, Newey–West estimator is applied to relax two important assumptions of Gauss–Markov; namely, no autocorrelation and homoskedasticity.
Results
Threshold regression has been applied 60 times with different combinations of 5 portfolios, 3 asset pricing models and 4 macroeconomic variables (as indicated in hypothesis section). In each of the regressions, size based portfolio return is dependent variable, risk factor loadings of pricing model are independent variables, whereas macroeconomic variable serves as threshold variable. Abridge results threshold regressions are presented in Tables 1-4.
| Table 1 Regressions With Interest Rate As Threshold Variable |
||||||
| Macroeconomic Variable | Model | Portfolio | Overall Sig. F-test | Null Hypothesis | Exp. Power R square | Threshold Effect |
| Interest rate (T-Bills rate) |
CAPM | Market Portfolio | Sig. | Rejected | 99% | No |
| EW_P1 | Insig. | Not Rejected | 1% | No | ||
| EW_P10 | Sig. | Rejected | 83% | Yes | ||
| VW_P1 | Insig. | Not Rejected | 1% | No | ||
| VW_P10 | Sig. | Rejected | 81% | Yes | ||
| Fama French 3 Factor | Market Portfolio | Sig. | Rejected | 99% | Yes | |
| EW_P1 | Sig. | Rejected | 6% | Yes | ||
| EW_P10 | Sig. | Rejected | 83% | Yes | ||
| VW_P1 | Insig. | Not Rejected | 0.80% | No | ||
| VW_P10 | Sig. | Rejected | 82% | Yes | ||
| Fama French 5 Factor | Market Portfolio | Sig. | Rejected | 99% | Yes | |
| EW_P1 | Insig. | Not Rejected | 3% | No | ||
| EW_P10 | Sig. | Rejected | 83% | Yes | ||
| VW_P1 | Sig. | Rejected | 5% | No | ||
| VW_P10 | Sig. | Rejected | 80% | No | ||
| Table 2 Regressions With Industrial Production As Threshold Variable |
||||||
| Macroeconomic Variable | Model | Portfolio | Overall Sig. F-test | Null Hypothesis | Exp. Power R square | Threshold Effect |
| Large Scale Manufacturing Index | CAPM | Market Portfolio | Sig. | Rejected | 99% | No |
| EW_P1 | Insig. | Not Rejected | 0.70% | No | ||
| EW_P10 | Sig. | Rejected | 81% | No | ||
| VW_P1 | Insig. | Not Rejected | 0.30% | No | ||
| VW_P10 | Sig. | Rejected | 80% | No | ||
| Fama French 3 Factor | Market Portfolio | Sig. | Rejected | 99% | No | |
| EW_P1 | Insig. | Not Rejected | 0.70% | No | ||
| EW_P10 | Sig. | Rejected | 81% | No | ||
| VW_P1 | Insig. | Not Rejected | 0.80% | No | ||
| VW_P10 | Sig. | Rejected | 79% | No | ||
| Fama French 5 Factor | Market Portfolio | Sig. | Rejected | 99% | No | |
| EW_P1 | Insig. | Not Rejected | 3% | No | ||
| EW_P10 | Sig. | Rejected | 83% | Yes | ||
| VW_P1 | Insig. | Not Rejected | 5% | No | ||
| VW_P10 | Sig. | Rejected | 80% | No | ||
| Table 3 Regressions With Inflation As Threshold Variable |
||||||
| Macroeconomic Variable | Model | Portfolio | Overall Sig. F-test | Null Hypothesis | Exp. Power R square | Threshold Effect |
| Producer Price Index | CAPM | Market Portfolio | Sig. | Rejected | 99% | No |
| EW_P1 | Insig. | Not Rejected | 0.30% | No | ||
| EW_P10 | Sig. | Rejected | 81% | No | ||
| VW_P1 | Insig. | Not Rejected | 0.30% | No | ||
| VW_P10 | Sig. | Rejected | 79% | No | ||
| Fama French 3 Factor | Market Portfolio | Sig. | Rejected | 99.00% | No | |
| EW_P1 | Insig. | Not Rejected | 0.70% | No | ||
| EW_P10 | Sig. | Rejected | 81% | No | ||
| VW_P1 | Insig. | Not Rejected | 0.80% | No | ||
| VW_P10 | Sig. | Rejected | 79% | No | ||
| Fama French 5 Factor | Market Portfolio | Sig. | Rejected | 99% | Yes | |
| EW_P1 | Insig. | Not Rejected | 0.30% | No | ||
| EW_P10 | Sig. | Rejected | 82% | No | ||
| VW_P1 | Sig. | Rejected | 5% | No | ||
| VW_P10 | Sig. | Rejected | 80% | No | ||
| Table 4 Regressions With Exchange Rate As Threshold Variable |
||||||
| Macroeconomic Variable | Model | Portfolio | Overall Sig. F-test | Null Hypothesis | Exp. Power R square | Threshold Effect |
| Exchange Rate | CAPM | Market Portfolio | Sig. | Rejected | 99% | No |
| EW_P1 | Insig. | Not Rejected | 0.30% | No | ||
| EW_P10 | Sig. | Rejected | 83% | Yes | ||
| VW_P1 | Insig. | Not Rejected | 0.30% | No | ||
| VW_P10 | Sig. | Rejected | 82% | Yes | ||
| Fama French 3 Factor | Market Portfolio | Sig. | Rejected | 99% | Yes | |
| EW_P1 | Insig. | Not Rejected | 4% | Yes | ||
| EW_P10 | Sig. | Rejected | 84% | Yes | ||
| VW_P1 | Insig. | Not Rejected | 0.80% | No | ||
| VW_P10 | Sig. | Rejected | 82% | Yes | ||
| Fama French 5 Factor | Market Portfolio | Sig. | Rejected | 99% | Yes | |
| EW_P1 | Insig. | Not Rejected | 3% | No | ||
| EW_P10 | Sig. | Rejected | 84% | Yes | ||
| VW_P1 | Sig. | Rejected | 5% | No | ||
| VW_P10 | Sig. | Rejected | 80% | No | ||
Highlighted portfolios are those which are not only significant but having threshold effect as well. These highlighted portfolios are the evident of the fact that the relationship of portfolio returns and asset pricing models does not remain linear in the presence of macroeconomic factors. In the medium and long run, there are regime shifts in PSX exhibited by threshold point(s). Regressions having threshold effect can be summarized in terms of portfolio macroeconomic variable, and asset pricing model wise, as provided in Table 5.
| Table 5 Summary Of Threshold Effects |
|||||
| Portfolio wise | No of times | Variable wise | No of times | Model wise | No of times |
| Market Portfolio | 5 | Interest rate (T-Bills rate) | 8 | CAPM | 4 |
| EW_P1 | 1 | Large Scale Manufacturing Index | 1 | Fama French 3 Factor | 7 |
| EW_P10 | 7 | Producer Price Index | 1 | Fama French 5 Factor | 6 |
| VW_P1 | 0 | Exchange Rate | 7 | ||
| VW_P10 | 4 | ||||
Discussion
Threshold Effect
It is evident from the result that out of four macroeconomic variables only two variables namely interest rate and exchange rate have found to cause threshold effect, as 8 and 7 portfolios respectively are found significant with threshold effect out of 20 portfolios. Empirical analysis of Kim (2003) also shows negative relation of interest rate and exchange rate with stock prices; but in his study industrial production as well as inflation were also significant whereas in our study these two macroeconomic variable are not found significant in terms causing threshold effect. Alam and Uddin (2009) also presented that interest rate is negatively related to stock prices. As far as asset pricing models are concerned, five factors Fama French model works best in PSX. As many as 15 portfolios out of 20 are significant but threshold effect is found only in 6 portfolios. Threshold effect is most evident in three factors Fama French model. Almost 13 portfolios are found significant, and out of these 13 portfolios, 7 are found to have threshold effect.
The most important finding in above mentioned result is the critical role of the firm size in these threshold regression analyses. When the threshold effects are analyzed portfolio wise, it found to be evident in large firm’s portfolios whereas the threshold effect is negligible in small firms’ portfolios. Equally weighted decile portfolio of large firms is found to have most numbers of threshold effects, which is 7 out of 12 portfolios. Similarly, in value weighted portfolios, again the threshold effect is captured in large firms’ portfolios. There are 4 portfolios out of 20 value weighted portfolios of large firms where threshold effect is captured.
Threshold Points
Threshold points are the values of threshold variables, after which there is a change in the relationship of dependent and independent variables. There are three threshold points identified for interest rate, but out of these three, first threshold point is more dominating as it is found in almost 8 occasions whereas the other two threshold points are just appeared once and twice. The average value of first threshold point of interest rate is 3.43, describing that once the t bill rate crossed 3.43%, it affected the risk return relationship of PSX portfolios. On average basis, three threshold points are also identified for exchange rate viz. 58.25, 62.48, and 81.62 PKR/USD. The first threshold point is the most frequent one as it is found with 8 portfolios; portfolio returns before the threshold point are greater than the returns after threshold (Appendix).
Conclusion
Capital market is not a closed system; its performance is not limited to performance of corporate sector and market related factors such as momentum or liquidity etc. But macroeconomic factors like GPD, inflation, money supply, interest rate do have the impact on capital market returns and consequently the returns of portfolios. If the risk return relation of the market is changing vis-à-vis portfolios’ risk return relationship, it will render asset pricing models to behave differently on different occasions. Firms’ return is the function of internal factors like profitability, growth etc. as well as external factors such as interest rates, exchange rates, GDP, inflation etc. Thus, the functioning and performance of asset pricing models are dependent on macroeconomic variables; and they cannot exhibit linear relationship of portfolio returns and risk factors over a long period of time.
In order to identify regime shifts (nonlinear relationship), threshold regression is applied on five different size based portfolios with three asset pricing models. Based on literature review, four macroeconomic variables including interest rate, industrial production, producer price index and exchange rate have been inculcated in the model. With different combinations of portfolios, asset pricing models and macroeconomic variables, threshold regression have been applied sixty times; out of which forty are found to be significant and out of these forty regressions seventeen are having threshold effect.
Macroeconomic variable wise analyses suggest that interest rate and exchange rate among four macroeconomic variables causing threshold effect (regime shift) on portfolio returns. The most effective threshold point is 3.43% for interest rate (T-Bill rate), and 58.25 PKR/USD for exchange rate. Asset pricing model wise results suggest that the three factors Fama French model have more threshold effects as compared to CAPM and five factor Fama French model. According to the results of the study, size of firm plays critical role in accepting macroeconomic impact on portfolio returns, as threshold effect is frequently found in the large firm’s portfolio. Thus, it can be concluded that interest rate and exchange rate are creating regime shift only in large firms’ portfolios, which can be well captured through three factor Fama and French model.
Appendix
Sources of Secondary Sources
1. Bloomberg Website: (PXS security prices)
a. http://www.bloomberg.com/markets/stocks
2. International Monetary Fund Website: (PPI, CPI, interest rates, exchange rate, and GDP from International Financial Statistics)
a. http://data.imf.org/?sk=5DABAFF2-C5AD-4D27-A175-1253419C02D1&sId
3. Pakistan Stock Exchange Limited:
4. State Bank of Pakistan
The Summary of Threshold Points is provided in the Table 6.
| Table 6 Threshold Points |
|||||||
| Macroeconomic Variables | Model | Portfolio | Threshold Point(s) | Data Bifurcation | |||
| Interest rate | CAPM | EW_P10 | 3.19 | ||||
| VW_P10 | 3.84 | 23, 109 | |||||
| 3 Factor Fama French | EW_P1 | 3.19 | 20, 112 | ||||
| EW_P10 | 3.18 | 19, 113 | |||||
| VW_P10 | 3.19 | 10.29 | 19, 69, 44 | ||||
| Market Portfolio | 3.84 | 11.47 | 23, 74, 35 | ||||
| 5 Factor Fama French | EW_P10 | 3.19 | 19, 113 | ||||
| Market Portfolio | 3.84 | 7.83 | 11.54 | 23, 24, 53, 32 | |||
| Average | 3.43 | 9.86 | 11.54 | ||||
| Large Scale Manufacturing | 5 Factor Fama French | EW_P10 | 96.19 | 84, 47 | |||
| Producer Price Index | 5 Factor Fama French | Market Portfolio | 84.24 | 113, 19 | |||
| Exchange Rate | CAPM | EW_P10 | 58.03 | 25, 107 | |||
| VW_P10 | 58.03 | 25, 107 | |||||
| 3 Factor Fama French | EW_P1 | 57.78 | 22, 110 | ||||
| EW_P10 | 58.03 | 62.15 | 25, 67, 40 | ||||
| VW_P10 | 58.03 | 64.07 | 25, 71, 36 | ||||
| Market Portfolio | 60.17 | 63, 69 | |||||
| 5 Factor Fama French | EW_P10 | 58.03 | 25, 71 | ||||
| Market Portfolio | 57.91 | 61.22 | 81.62 | 24, 63, 26 | |||
| Average | 58.25 | 62.48 | 81.62 | ||||
References
- Alam, M., & Uddin, G. (2009). Relationship between interest rate and stock price: empirical evidence from developed and developing countries. Internation Journal of Bussiness and Management, 4(3), 43-51.
- Ali, A., & Haseeb, M. (2019). Radio frequency identification (RFID) technology as a strategic tool towards higher performance of supply chain operations in textile and apparel industry of Malaysia. Uncertain Supply Chain Management, 7(2), 215-226.
- Anigbogu, U.E., & Nduka, E.K. (2014). Stock market performance and economic growth: Evidence from Nigeria employing vector error correction model framework. The Economics and Finance Letters, 1(9), 90-103.
- Antoniou, A., Garrett, I., & Priestley, R. (1998). Macroeconomic variables as common pervasive risk factors and the empirical content of the arbitrage pricing theory. Journal of Empirical Finance, 5(3), 221-240.
- Bansal, N., Connolly, R.A., & Stivers, C.T. (2017). Intermediary asset pricing and the nonlinear relation between volatility and the equity size premium. SSRN. Retrieved from: https://ssrn.com/abstract=2845610
- Banz, R.W. (1981). The relationship between return and market value of common stocks. Journal of Financial Economics, 9(1), 3-18.
- Carhart, M.M. (1997). On persistence in mutual fund performance. The Journal of Finance, 52(1), 57-82.
- Connor, G., & Sehgal, S. (2001). Tests of the Fama and French model in India. Retrieved from http://eprints.lse.ac.uk/25057/1/dp379.pdf
- Daniel, K., & Titman, S. (1997). Evidence on the characteristics of cross sectional variation in stock returns. Journal of Finance, 52(1), 1-33.
- Dasgupta, R. (2014). Driving role of institutional investors in the Indian stock market in short and long-run–An empirical study. International Journal of Business, Economics and Management, 1(6), 72-87.
- Fama, E.F., & French, K.R. (1993). Common risk factors in the returns on stocks and bonds. Journal of Financial Economics, 33(1), 3-56.
- Fama, E.F., & French, K.R. (2015). A five-factor asset pricing model. Journal of Financial Economics, 116(1), 1-22.
- Gallegati, M. (2008). Wavelet analysis of stock returns and aggregate economic activity. Computational Statistics & Data Analysis, 52(6), 3061-3074.
- Gul, A., & Khan, N. (2013). An application of arbitrage pricing theory on KSE-100 Index; A study from Pakistan (2000-2005). Journal of Business and Management, 7(6), 78-84.
- Halliwell, J., Heaney, R., & Sawicki, J. (1999). Size and B/M effects in Australian share markets a cross-sectional study of expected stock returns.
- Hansen, B.E. (2000). Sample splitting and threshold estimation. Econometrica, 68(3), 575-603.
- Hansen, B.E., & Seo, B. (2002). Testing for two-regime threshold cointegration in vector error-correction models. Journal of Econometrics, 110(2), 293-318.
- Haseeb, M., Abidin, I.S.Z., Hye, Q.M.A., & Hartani, N.H. (2018). The impact of renewable energy on economic well-being of Malaysia: Fresh evidence from auto regressive distributed lag bound testing approach. International Journal of Energy Economics and Policy, 9(1), 269-275.
- Hsueh, H.M., Chen, J.J., & Kodell, R.L. (2003). Comparison of methods for estimating the number of true null hypotheses in multiplicity testing. Journal of Biopharmaceutical Statistics, 13(4), 675-689.
- Inusah, N. (2018). Toda-Yamamoto granger no-causality analysis of stock market growth and economic growth in Ghana. Journal of Accounting, Business and Finance Research, 3(1), 36-46.
- Iqbal, J., & Brooks, R. (2007). A test of CAPM on the Karachi Stock Exchange. International Journal of Business, 12(4), 430-444.
- Jensen, M.C., Black, F., & Scholes, M.S. (1972). The capital asset pricing model. Retrieved from http://papers.ssrn.com /abstract=908569
- Jorion, P. (1991). The pricing of exchange rate risk in the stock market. Journal of Financial and Quantitative Analysis, 26(3), 363-376.
- Khan, S.N., & Ali, E.I.E. (2017). The moderating role of intellectual capital between enterprise risk management and firm performance: A conceptual review. American Journal of Social Sciences and Humanities, 2(1), 9-15.
- Kim, K.H. (2003). Dollar exchange rate and stock price: Evidence from multivariate co-integration and error correction model. Review of Financial Economics, 12(3), 301-313.
- Le, H.L., Vu, K.T., Du, N.K., & Tran, M.D. (2018). Impact of working capital management on financial performance: The case of Vietnam. International Journal of Applied Economics, Finance and Accounting, 3(1), 15-20.
- Lee, C.H., & Chou, P.I. (2018). Corporate cash holdings and product market competition: The effects of stock-based executive compensation. Asian Economic and Financial Review, 8(9), 1140-1157.
- Li, L., & Chen, C.R. (2016). Analysts' forecast dispersion and stock returns: A panel threshold regression analysis based on conditional limited market participation hypothesis. Finance Research Letters, 18, 100-107.
- Markowitz, H. (1952). Portfolio selection. The Journal of Finance, 7(1), 77-91.
- Nishat, M. (2001). Industry risk premia in Pakistan. The Pakistan Development Review, 929-949.
- Ratanapakorn, O., & Sharma, S.C. (2007). Dynamic analysis between the US stock returns and the macroeconomic variables. Applied Financial Economics, 17(5), 369-377.
- Rauf, A.L.A. (2016). Risk and return: Comparative study of active Sukuk markets of Nasdaq HSBC Amanah Sukuk and Nasdaq Dubai listed Sukuk. Global Journal of Social Sciences Studies, 2(2), 104-111.
- Roll, R., & Ross, S.A. (1980). An empirical investigation of the arbitrage pricing theory. The Journal of Finance, 35(5), 1073-1103.
- Sabri, T.B.H., & Sweis, K.M. (2015). The impact of the global financial crisis on the debt, liquidity, growth, and volume of companies in Palestine Stock Exchange. Journal of Social Economics Research, 2(2), 31-37.
- Salim, M.N., & Hariandja, N.M. (2018). Factors affecting joint stock price index (CSPI) and the impact of foreign capital investment (PMA) period 2009 to 2016. Humanities and Social Sciences Letters, 6(3), 93-105.
- Schwert, G.W. (2003). Anomalies and market efficiency. Handbook of the Economics of Finance, 1, 939-974.
- Seo, M.H., & Linton, O. (2007). A smoothed least squares estimator for threshold regression models. Journal of Econometrics, 141(2), 704-735.
- Suryanto, T., Haseeb, M., & Hartani, N.H. (2018). The correlates of developing green supply chain management practices: Firms level analysis in Malaysia. International Journal of Supply Chain Management, 7(5), 316-324.
- Tom, T., & Munemo, E. (2015). Republic of Zimbabwe national water policy: A desk review of the gaps between the policy and its implementation. International Journal of Public Policy and Administration Research, 2(3), 60-72.
- Waheed, A., Yang, J., Ahmed, Z., Rafique, K., & Ashfaq, M. (2017). Is marketing limited to promotional activities? The concept of marketing: A concise review of the literature. Asian Development Policy Review, 5(1), 56-69.
- Wan Mahmood, W.M., & Mohd Dinniah, N. (2007). Stock returns and macroeconomic influences: Evidence from the six Asian-pacific countries. Financial Economics and Futures Market Research Paper. Retrieved from https://ssrn.com/abstract=995108
- Yee, T.K. (2006). Effect of size and book to market on stock return: Evidence in Malaysia. Master Thesis, Open University Malaysia.
- Zehetmayer, S., Bauer, P., & Posch, M. (2005). Two-stage designs for experiments with a large number of hypotheses. Bioinformatics, 21(19), 3771-3777.
- Zhang, K., Ji, C., & Ren, H. (2017). Improving economic benefits through coal products optimization in a given group. International Journal of Economics, Business and Management Studies, 4(1), 57-64.