Research Article: 2021 Vol: 25 Issue: 6
Assessing Social and Environmental Performance
Rewan Kumar Dahal, Tribhuvan University
Citation Information: Dahal, R.k. (2021). Assessing Social and Environmental Performance. Academy of Accounting and Financial Studies Journal, 25(6), 1-9.
Abstract
This study was the customers' evaluation of how society sees the NCTI (Nepalese Cellular Telecommunications Industry) by examining the power of NFMs (Non-Financial Measures) relating to SEP (Social and Environmental Performance) measures. The study gathered essential information through an organized survey questionnaire. The population of this study comprised all GSM (Global System for Mobile) communications customers of Ncell and NT (Nepal Telecom). The sample consisted of 386 customers chose through the nonprobability sampling method. Targeted respondents were postgraduate understudies, service holders, business people, and consultants. The survey overview was set in three segments with 18 inquires of different sorts to gather information. Nine observed and two latent variables were tested to assess the SEP and found that all were significant. The study's findings would provide helpful guidelines to specific interest parties and contribute to the PMS (Performance Measurement System) completeness that Nepalese organizations often ignore.
Keywords
Non-Financial Measures, Organizational Performance, Social and Environmental Issues.
JEL Classifications
L84; M41
Introduction
Performance measurement is an individual presentation or a set of people, strategies, and tools that utilized internal and external factors to diagnose, generate and analyze information (Neely et al., 1995). OP (Organizational Performance) is the interpretation of social construction and a convention of instigating contradictory debates (Djellal & Faiez, 2007). Organizational activities are disseminated through performance reporting that can instigate the managers to take various managerial decisions (Banker et al., 2000). The reporting represents the fundamental lens through which society 'sees' the organizations. The readiness of the corporations to go above and beyond legal requirements in order to pursue their social and environmental responsibility (Williams, 1997) is measured by SEP.
Most organizations, especially in Nepal, are using a FMs (Financial Measures) based performance reporting system to show OP in the past, but that seems inadequate to respond to a competitive business environment. FMs based reporting system fails to accomplish stakeholders' anticipations and unable to analyze the competitors' reactions. The cutting-edge business economy, however, faces more extensive demands for the NFMs based reporting system. In recent years, such a reporting system has been developing responsiveness among contemporary business associations to offer supplementary information to stakeholders (Ahmad & Zabri, 2016a), which includes reporting on social and ecological aspects of a business.
Researchers and practitioners have accentuated the necessity for an organization's performance reporting system to go beyond FMs and cover a much larger spectrum of NFMs (Ittner et al., 2003). The assessment of non-financial performance is crucial in the information technology-based service environment, where typical operations are more intricate than any other business. In this regard, this study explored the NFMs in SEP measurement in the NCTI and developed a subjective structure for the Nepalese context.
The cellular telecommunications market of Nepal is relatively new; however, the growth is a lot quicker than in other industries. Over the most recent fifteen years, the transformation of telecommunications has revolutionized Nepal's socio-economic landscape and has been a key factor in economic growth and development. The industry isn't just a noteworthy supporter of nations' economic activities, yet also towards the growth and development of the other industries.
As competition has escalated among the rivals, they need to find out the various aspects of the OP system. As a result, the study attempted to address the question: what are the NFMs to evaluate the SEP of the NCTI? In this regard, the examination's goal was to look at the power of NFMs of the SEP of the NCTI and initiate some discussions for better performance from the customers' standpoint.
Literature Review
Expanding accentuation on NFMs has been extensively examined and discoursed in the literature. Previous studies (Ahmad & Zabri, 2016a; Amir & Lev, 1996; Dotzel et al., 2013; Farooq & Hussain, 2011; Ittner et al., 1997; Kaplan & Norton, 1992; Kaplan & Norton, 2001a) showed that when organizations began to consolidate NFMs in the PMS, gradually they were increasingly relying on NFMs for the future success. Amir & Lev (1996) examined the value-relevance of NFMs-based information in cellular telecommunication companies. They observed that FMs-based information alone is largely irrelevant for the OP measurement system. Ittner et al. (1997) built up that the commotion of FMs-based performance influenced the execution of performance measures. In particular, the more prominent the clamor in FMs-based performance metrics, the more weight set by the organizations on NFMs-based performance metrics.
Associations have been urged to recognize commitment in regards to the effects that they may have on society. Friedman (1962) indicated that an organization must augment benefit, which is no longer acceptable for doing business. Many studies (Holmes, 1976; Ostlund, 1997) have asserted that business has a responsibility to society, and profit isn't the lone motive wherein the business exists. Organizational social image is a significant elusive capital that is difficult to mirror. It can assist an association in achieving reasonable and predominant social performance and financial performance (Brahim & Arab, 2011; Mohr & Batsakis, 2014). It is the aggregate perception of an association by observers based on financial, social, and environmental assessments made over time (Barnett et al., 2006). Studies showed that performance measures like brand image (Martensen et al., 2000; Santouridis & Trivellas, 2010), social responsiveness (Vranakis et al., 2012), social disclosure (Hamid & Atan, 2011; Hossain et al., 2015), human rights (Bednarova et al., 2019; Hossain et al., 2015), entertainments (Hoffman & Novak, 1996; Unal et al., 2011) are applicable in the cellular telecommunications industry to assess the organizational social performance.
On the other hand, organizations face difficulties while assessing performances because of speedy environmental variations (Yusra et al., 2015), which could root a significant issue and even the possible disappointment of the business (Sorooshian et al., 2011). Over the last decade, studies observed how transparency has enhanced corporate environmental disclosure, which was traditionally based on regulation (Bednarova et al., 2019). The disclosure exposes information relating to environmental issues and policy to stakeholders and society at large. It increases public awareness and is likely to improve an organization's reputation to enhance better performance. Earlier studies showed that performance measures like environmental disclosure (Bednarova et al., 2019; Deegan, 2002), corporate environmental accountability (Feng et al.,2017), electronic waste (e-waste) management (Awasthi & Li, 2017; Oeztuerk & Marsap, 2018), protection of natural beauty and biodiversity (Atkinson et al., 2014) are applicable in the cellular telecommunications industry to assess the organizational environmental performance.
Study Framework and Hypotheses
This analysis was guided by the social accounting theory that provides an appropriate lens for comprehension and managing organizations in progressively complex circumstances where social and environmental issues count for additional business achievement. The theory advocates how to impart the social and environmental impacts of associations' financial and non-financial activities to interest groups within society (Gray et al., 1996). It is a part of the knowledge of accounting and reporting that intends to gauge the social impacts emerging from the business unit's activities. Therefore, it is extensively perceived as including the arrangement, presentation, and reporting of data on social elements or situations. The 'social account' is compared or rivaling with economic considerations and values (Cooper et al., 2005).
As part of firm performance, this study concentrated on identifying the relevant variables that can pursue an organization's social and environmental responsibility by taking customer responses. The structural representation of the SEP was exhibited in Figure 1.

Figure 1 Study Framework
Equation 1 represented the regression model of the SEP as guided by the study framework.
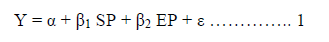
Where,
Y = Social and environmental performance
α = Constant
β1…..n = Estimated parameters of the SEP
SP = Social performance
EP = Environmental performance
ε = Error term of SEP
Besides SP and EP, other SEP measures like societal norms, governmental rules, and relations, supporting industries activities, infrastructure, etc., also affect the SEP, which was indicated by the error term (ε) at Equation 1. Within the framework of prior literature, the study hypotheses were as follows:
H1: SP positively and significantly affects SEP.
H2: EP positively and significantly affects SEP
Material and Methods
The study's population consisted of all the Nepalese cellular telecommunications operators and their GSM customers. Ncell and NT were chosen as sample companies because they accounted for approximately 94 percent of the whole industry. Other companies' services were not common in the Nepalese market, so they were excluded from the analysis. The examination employed quantitative data that were acquired through an organized poll overview. SPSS (Statistical Package for Social Sciences) variant 23 and AMOS (Analysis of Moment Structures) variant 21 programming were utilized for analyzing and interpreting the data. The examination utilized nonprobability sampling method because there was no evidence of active and dead SIM (Subscriber Identification Module) cards issued with test organizations. Designated respondents were postgraduate students, job holders, business people, and consultants living in various territories of Nepal and using the GSM network. A testing plan was utilized as recommended by Bowerman et al. (2004); Krejcie and Morgan (1970) and safeguarded at least 385 responses.
The planned survey instrument comprised 18 questions and was sorted out into three segments. The first segment intended to seek the general data of the respondents and included seven requests. The second segment mentioned SEP measures in different scopes and comprised nine inquires. The final segment requested for overall SEP and included two inquires. Inquires of the second and the last segment concentrated on the examination variables with close-ended inquiries to get appropriate data from the respondents. All the examination variables were estimated with a 6-point Likert-type scale with 1 = strongly dissatisfied to 6 = strongly satisfied. The 6-point scale was picked because it does exclude the undecided center rating.
The review polls circulated through two different techniques: field and online studies. A field study was led and disseminated among MBA understudies and university faculty members. Five hundred respondents were approached during the two months of February-March 2020. The respondents were mentioned to be interested in the survey if they were using either the Ncell or NT service exclusively. Two hundred fifty-seven responses were gathered. Out of them, 33 responses were dismissed due to incomplete information, and 224 responses were recorded in SPSS for further examination. On the other hand, an online overview was directed among MBA graduates who completed their studies in the latest three years and working in a different part of Nepal. On the database provided by different business schools, the study progressed to nearly 500 respondents during the two months of February-March 2020. The respondents were requested to exclusively take an interest in the review using either the Ncell or NT service. One hundred sixty-two responses were obtained from the online review and recorded in SPSS for further examination. In this regard, a total of 386 responses were analyzed in the study.
Cronbach’s alpha (α = 0.807) and average inter-item correlation coefficient (r = 0.315) of nine study variables were used to assess the internal consistency. Notwithstanding having excellent statistics, Cronbach's alpha also examined if the item was deleted. There were no variables found to delete. As a result, all study variables were retained for further examination. Table 1 displayed the construct-wise insightful outcomes.
| Table 1 Internal consistency statistics | ||||
| Constructs | a (Cronbach's alpha) |
r (average inter-item correlation coefficient) |
Variables | No of items |
| SP | 0.701 | 0.314 | VAR_ 8, 9, 10, 11,12 | 5 |
| EP | 0.740 | 0.414 | VAR_13, 14, 15, 16 | 4 |
| Study variables (total) | 9 | |||
The internal consistency insights evidenced that the constructs had great alpha qualities, i.e., 0.7 or higher (as recommended by Nunnally, 1993). The constructs additionally had extraordinary inter-variable correlation coefficient (r) and plummeted in the ideal scope of 0.15 to 0.50 (as suggested by Clark and Watson, 1995). Likewise, the examination had an acceptable example size since the KMO (Kaiser-Meyer-Olkin) value of 0.827 from nine study variables more prominent than the cutoff value of 0.5 (as recommended by Kaiser, 1974). Bartlett's significant sphericity test value (934.126, df = 36, p = 0.000) revealed interdependencies between the variables.
Study Outcomes
The primary data were reported, analyzed, and interpreted by administering the organized survey to 386 GSM users of Ncell and NT. As per the sample framed, replies were taken from postgraduate students (57.0 %), job holders (39.4 %), business persons (1.8 %), and consultants (1.8 %). Female (55.2 %) participants were slightly higher than the male (44.8 %). Most of the respondents (approximately 80.0 %) were aged below 35 years. The researcher supposed that youngsters were friendlier with information technology and cell phones, so their responses were more precise than the aged respondents. Even though the field review was directed at Kathmandu valley, the examination covered all territories (provinces) of Nepal since respondents came to Kathmandu valley. The geographical spreading the of the respondents were from: province 1 (17.1 %), province 2 (11.1 %), Bagmati (34.7 %), Gandaki (12.7 %), Lumbini (12.4 %), Karnali (6.0 %) and Sudur Pashchim (6.0 %). The examination safeguarded equal contribution from Ncell (50.0%) and NT (50.0 %). The study showed that 80.3 % of cell phone users in Nepal used pre-paid SIM cards exclusively, 14.0 % of customers used post-paid SIM cards, and 5.7 % of customers used both pre-paid and post-paid SIM cards. The study took 90 % of respondents with at least five or more years of experience using cell phone services in Nepal.
This examination analyzed the consequences of building and assessing the constructs by looking at the hypothetical estimation model against the real world, as considered by the example. A multiple regression between overall SEP as the reliant variable with SP and EP was executed. Table 2 showed the model layout, and Table 3 exhibited an ANOVA (Analysis of the Variance). The value of multiple correlations reflected the adjusted R Square was fundamentally different from zero (F = 82.950, p > .000), indicating that the reliant variable in the arrangement of independent variables accounted for 30.2 % of the variation. The overall evaluation model was presented in Table 4, Figure 2, and Figure 3.
| Table 2 SEP - Model summary | |||
| R | R Square | Adjusted R Square | Std. Error of the Estimate |
| 0.550 | 0.302 | 0.299 | 0.75544 |
Dependent variable: SEP
| Table 3 SEP - ANOVA result | |||||
| Sum of Squares | df | Mean Square | F | Sig. | |
| Regression | 94.679 | 2 | 47.339 | 82.950 | 0.000 b |
| Residual | 218.576 | 383 | 0.571 | ||
| Total | 313.255 | 385 | |||
Forecasters: (Constant), SP, EP
| Table 4 SEP - Regression coefficients | |||||||
| Model | Unstandardized Coefficients a | Standardized coefficients | t-statistics | Significance | Variance Inflation Factor |
Observations on the hypotheses |
|
| B | Std. Error | Beta | |||||
| (Constant) | 1.632 | 0.215 | 7.586 | 0.000 | - | ||
| SP | 0.325 | 0.061 | 0.280 | 5.346 | 0.000 | 1.503 | Accepted |
| EP | 0.373 | 0.058 | 0.338 | 6.463 | 0.000 | 1.503 | Accepted |

Figure 2 The Unstandardized Regression Model

Figure 3 The Standardized Regression Model
The independent variables have been proven to be distinct and contribute considerably to the SEP of the NCTI. Multi-collinearity was not a problem because the measured VIF values were not more than 4.0 and tolerance below 0.2 (as indicated by Hair et al., 2010). Figures 2 and 3 depicted the study model of SEP, representing the theory visually using a path diagram by illuminating exogenous and endogenous variables.
Discussion and Conclusion
This study used social accounting theory to communicate the social and environmental implications of the NCTI's actions to specific interest groups and the general public. The constructs: SP and EP were observed as significant contributors to the SEP of the NCTI. The EP was the most significant contributor (β = 0.338 and p = 0.000) and the SP stood at the least contributor (β = 0.280 and p = 0.000) to overall SEP.
Inclusion NFMs in OP has been recognized since the 1990s. Relevant measures enable organizations to correctly assess and improve the exchange of values with their stakeholders (Napier & McDaniel, 2006). Researchers from various ways of thinking have utilized the idea of subjective information to measure OP. Consistent with the past studies (Bednarova et al., 2019; Hamid & Atan, 2011; Hoffman & Novak, 1996; Hossain et al., 2015; Martensen et al., 2000; Santouridis & Trivellas, 2010; Unal et al., 2011; Vranakis et al., 2012) the study induced that the SP (having with measuring variables: brand image, social responsiveness, social disclosure, human rights, and entertainment) at Nepalese situation was fundamentally allied with SEP. Similarly, the EP (having with measuring variables: corporate environmental accountability, environmental disclosure, protection of natural beauty and biodiversity, and electronic waste management) as like earlier research (Atkinson et al., 2014; Awasthi & Li, 2017; Bednarova et al., 2019; Deegan, 2002; Feng et al., 2017; Oeztuerk & Marsap, 2018) had a direct influence on the EP consequently on the SEP.
This study contributes to the completeness of the performance measurement considering mostly social and environmental variables that are often ignored by organizations, more especially in the Nepalese scenario. It enriches the literature by providing light on the advantages of incorporating social and environmental measures into the OP measurement system. It proposes a new lens of the subjective perspective on PMS and provides a framework for distinguishing, estimating, and revealing an organization's social and environmental powers. Therefore, the study ropes to measure and communicate information concerning the business and its action towards society, especially with the NCTI.
Limitations and Implications
The study of the non-monetary dimension of SEP traverses assorted fields and procedural approaches fluctuate enormously. Any single-dimensional measures may not fully cover all aspects and provide an exhaustive comprehension of OP. The study was fingered with measuring the SEP of the NCTI though there are several other measures. Therefore, the study referred to symbolic research instead of endeavoring to be comprehensive. The unwavering quality of the outcomes could depend on how many respondents participated in the study that might have been enriched further by a greater example. The greater example size for the logical overview would have expanded the legitimacy and generality of the outcomes.
Various performance appraisal models have been espousing all around the globe with the consideration of FMs and NFMs. But in the case of Nepal, none of the companies appear to be applying the NFMs explicitly. Therefore, this study attempted to identify the NFMs in the SEP of the NCTI. The results of this study extensively contribute towards adding value for taking managerial decisions in the field of SEP, more specifically on telecommunications services. The study can create more opportunities for developing more optimized systems for SP and EP and provide accommodating guidelines in understanding key drivers regarding strategic areas of performance measurement for the NCTI.
References
- Ahmad, K., & Zabri, S.M. (2016a). The application of non-financial performance measurement in Malaysian manufacturing firms. Procedia Economics and Finance, 35, 476-484.
- Amir, A., & Lev. B. (1996). Value relevance of non-financial information: the wireless communications industry. Journal of Accounting and Economics, 22, 3-30.
- Atkinson, A.A., Kaplan, R.S., Matsumura, E.M., Young, S.M., & Kumar, G.A. (2014). Management Accounting Information for Decision Making and Strategy Execution, (6th Ed.). Pearson Education, Inc.
- Awasthi, A.K., & Li, J. (2017). Management of electrical and electronic waste: A comparative evaluation of China and India. Renewable and Sustainable Energy Reviews,76, 434–447. http://dx.doi.org/10.1016/j.rser.2017.02.067
- Banker, R. D., Potter, G., & Srinivasan, D. (2000). An empirical investigation of an incentive plan that includes non-financial performance measures. The Accounting Review, 75(1), 65-92.
- Barnett, M.L., Jermier, J.M. & Lafferty, B.A. (2006). Corporate reputation: The definitional landscape. Corporate Reputation Review, 9(1), 26-38.
- Bednarova, M., Klimko, R., & Rievajova, E. (2019). From environmental reporting to environmental performance. Sustainability, 11(2549), 1-12.
- Bowerman, B.L., O'Connell, R.T., & Orris, J.B. (2004). Essential business statistics, (3rd ed.). McGrawHill.
- Brahim, H.B., & Arab, M.B. (2011). The effect of intangible resources on the economic performance of the firm. Journal of Business Studies Quarterly, 3(1), 36-59.
- Clark, L. A., & Watson, D. (1995). Constructing validity: Basic issues in objective scale development. Psychological Assessment, 7(3), 309-319.
- Cooper, C., Taylor, P., Smith, N., & Catchpowle, L. (2005). A discussion of the political potential of social accounting. Critical Perspectives on Accounting, 16, 951-974.
- Dotzel, T., Shankar, V., & Berry, L. L. (2013). Service innovativeness and firm value. Journal of Marketing Research, 50(2), 259–276. http://dx.doi.org/10.1509/jmr.10.0426
- Deegan, C. (2002). Introduction: The legitimising effect of social and environmental disclosures - a theoretical foundation. Accounting, Auditing & Accountability Journal,15(3), 282–311. https://doi.org/10.1108/09513570210435852
- Djellal F., & Faiez G. (2007). Public services in the face of productivity and productivity challenged public services.Industrial Economics Review, 119(3), 25-54.
- Farooq, A., & Hussain, Z. (2011). Balanced scorecard perspective on change and performance: A study of selected Indian companies. Procedia - Social and Behavioral Sciences, 24, 754-768.
- Feng, M., Wang, X., & Kreuze, J.G. (2017). Corporate social responsibility and ?rm ?nancial performance: Comparison analyses across industries and CSR categories. American Journal of Business, 32(3-4), 106–133. https://doi.org/10.1108/AJB-05-2016-0015
- Friedman, M. (1962). Capitalism and freedom. University of Chicago Press.
- Gray, R., Owen, D., & Adams, C. (1996). Accounting and accountability: Changes and challenges in corporate social and environmental reporting. Prentice-Hall.
- Hair, J. F., Black, W. C., Babin, B. J., & Anderson, R. E. (2010). Multivariate data analysis: A global perspective (7th ed.). Prentice-Hall.
- Hamid, F. Z. A., & Atan, R. (2011). Corporate social responsibility by the Malaysian telecommunication firms. International Journal of Business and Social Science, 2(5), 198-208.
- Hoffman, D., & Novak, T. (1996). Marketing in hypermedia computer-mediated environments: Conceptual foundations. Journal of Marketing, 60, 50-68.
- Holmes, S.L. (1976). Executive perceptions of corporate social responsibility. Business Horizons, 19(3), 34-40.
- Hossain, M., Hecimovic, A., & Lema, A.C. (2015). Corporate social and environmental responsibility reporting practices from an emerging mobile telecommunications market. Australian Accounting Review,25(4),389-404.
- Ittner, C. D., Larcker, D. F., & Rajan, M. V. (1997). The choice of performance measures in annual bonus contracts. The Accounting Review, 72(2), 231-255.
- Ittner, C. D., Larcker, D. F., & Meyer, M. W. (2003). Subjectivity and the weighting of performance measures: evidence from a balanced scorecard. The Accounting Review, 78(3), 725-758.
- Kaiser, H. F. (1974). An index of factorial simplicity. Psychometrika, 39, 31–36.
- Kaplan, R. S., & Norton, D. P. (1992). The balanced scorecard - measures that drive performance. Harvard Business Review, 70(1), 71–79.
- Kaplan, R.S., & Norton, D.P. (2001a). Transforming the Balanced Scorecard from Performance Measurement to Strategic Management: Part I. Accounting Horizons, 15, 87-104.
- Krejcie, R., & Morgan, D. (1970). Determining sample size for research activities. Educational & Psychological Measurement. 30, 607-610.
- Martensen, A., Kristensen, K., & Gronholdt, L. (2000). Customer satisfaction measurement at post Denmark: Results of application of the European customer satisfaction index methodology. Total Quality Management, 11(7), 1007–1015.
- Mohr, A., & Batsakis, G. (2014). Intangible assets, international experience and the internationalization speed of retailers. International Marketing Review, 31(6), 601-620.
- Napier, R., & McDaniel, R. (2006). Measuring what matters – Simplified tools for aligning teams and their stakeholders. Davies-Black Publishing.
- Neely, A., Gregory, M., & Platts, K. (1995). Performance measurement system design: A literature review and research agenda. International Journal of Operation and Production Management, 15(4), 1228-1263.
- Nunnally, J. C. (1993). Psychometric theory (3rd ed.). McGraw-Hill.
- Oeztuerk, C., & Marsap, B. (2018). Corporate social responsibility reporting in telecommunication industry: The case of the US, UK, and Turkey. The Journal of Accounting and Finance. 78, 217-234.
- Ostlund, L.E. (1997). Attitudes of managers toward corporate social responsibility. California Management Review, 19(4), 35-49.
- Santouridis, I., & Trivellas, P. (2010). Investigating the impact of service quality and customer satisfaction on customer loyalty in mobile telephony in Greece. The TQM Journal, 22(3), 330-343. https://doi.org/10.1108/17542731011035550.
- Sorooshian, S., Norzima, Z., & Yusof, I. (2011). Descriptive comparison of SME performance between Iran and UK. World Applied Sciences Journal, 15(2), 239-243.
- Unal, S., Ercis, A., & Keser, E. (2011). Attitudes towards mobile advertising – A research to determine the differences between the attitudes of youth and adults. Social and behavioral sciences, 24, 361-377.
- Vranakis, S., Chatzoglou, P., & Mpaloukas, A. (2012). Customer satisfaction of Greek mobile phone services. International Journal of Managing Value and Supply Chains, 3(4), 43–54.
- Williams, M. (1997). Voluntary environment and social accounting disclosure practices in the Asia-Pacific region (doctoral dissertation). Commerce Department, Murdoch University, Perth.
- Yusra, Y. L., Noor, A.B.A., & Sorooshian, S. (2015). How are the performance of small businesses influenced by HRM practices and governmental support? Mediterranean Journal of Social Sciences, 6(1), 97-108.