Research Article: 2019 Vol: 23 Issue: 3
Asymmetric Smooth Transition in CDs Spreads: Evidence from Latvia
Ece C. Akdo?an, Çankaya University
Abstract
This paper investigates the predictability of CDS premiums and thus addresses weak form informational efficiency of CDS markets through examining the statistical properties of Latvian CDS spreads in-between 01:2006-08:2017 by concentrating on stationarity issues. The findings for the Augmented Dickey Fuller test fail to reject the presence of unit root indicating that the CDS market is weak form efficient while nonlinear tests of Kapatenios, Snell and Shin, and Sollis claim the opposite, demonstrating a smooth transition in general, and asymmetric smooth transition in particular. Additionally, the results of Perron and Zivot-Andrews tests identify no structural break as well for robustness. These results underline the necessity of accounting for nonlinearities in CDS premiums to grasp the predictability dynamics better.
Keywords
CDS Spread, Market Efficiency, Stationarity, Smooth Transition, Asymmetry.
Introduction
Credit default swap (CDS) is a recently popular financial derivative where the underlying asset is a debt instrument such as credits and bonds that allows the transfer of credit exposure of fixed income products among parties. Thus, it can be considered as a kind of credit default insurance where the buyer pays the seller a premium for protection called the CDS spread which reflects the default probability of the debtor. Through enabling investors to trade and hedge credit risk bearing assets at a certain cost given by the CDS spread, it allows the transfer of the issuer’s risk. Since CDSs are traded in financial markets, it reflects the risk assessed by the market which makes it to be regarded by many investors as a relatively upscale indicator of risk compared to credit ratings.
CDS have attracted considerable attention in the finance world and experienced an impressive growth after 2000s reaching its peak at 2007. After the 2008 crisis following the bankruptcy of Lehman Brothers, the importance of the credit risk of sovereigns has increased substantially and CDS spreads have become a major indicator for assessing the health of the economy and the sovereign risk. However, the subprime meltdown rendered a re-evaluation of credit risk of countries while most of them deemed to be risk-free or very low before the crisis. For instance, even triple A rated Nordic countries experienced a comprehensive change and faced higher CDS spreads. CDS spreads of Sweden and Denmark jumped to 150 bps whereas Finland CDS spread reached 80 bps in the beginning of 2009. The credit risk of Baltic countries skyrocketed where Estonian and Lithuanian spreads reached more than 700 and 800 bps respectively during the first quarter of 2009. The Latvian CDS spread made its summit at 1193 bps on March 10, 2009.
Among the Baltic countries of Estonia, Lithuania and Latvia, this study concentrates on Latvian CDS spreads since she not only has the highest outstanding notional amount of CDS but also has the highest weekly average trading volume (for a detailed analysis see Kregdze & Murauskas, 2014). The trading volume is important in the sense that it is the most significant market factor for CDSs and if the trading frequency of the bonds and corresponding CDS for a particular sovereign is relatively low, then the reversion to the mean could be gradual, hence statistically misleading (Akdo?an & Chadwick, 2011). Since every shock having a permanent effect will eventually make any time series with a unit root nonstationary as the effects of shocks are accumulated and build up a stochastic trend, while shocks with transitory effects make time series stationary as they will be offset by a future shock with the opposite sign, the unit root tests may also be regarded as a test of the non-stationarity or the absence of mean reversion in the underlying time series (Kim & Park, 2013). This is in fact the main scope of this study as the existence of predictable hence stationary paths for CDS spreads is an interesting research area which is not only important for asset pricing and credit portfolio management concerns but also essential for understanding the efficiency of CDS markets, a vital concern for the effectiveness of CDS premiums as an indicator of risk.
When the question is the stationarity of a time series, unit root tests immediately come into prominence, and as in an efficient market price changes should follow a random walk, the presence of a unit root indicates that the price formations are unpredictable and thus the market is informationally efficient in weak form. Conventionally, Dickey & Fuller (1979, 1981) (hereafter ADF) test which is based on a linear basis, is the most widely used unit root test. Despite its easiness, ADF test sometimes detects unit root when the data is stationary, but displays a smooth transition. The pioneering study of Kapetanios, Shin & Snell (2003) (hereafter KSS) offers a very convenient way of deriving the asymptotic distribution of the null hypothesis in the exponential smooth transition autoregressive (ESTAR) framework via consideration of first order Taylor approximation of the transition function. Sollis (2009), on the other hand, examined the cases of asymmetry in the transition function and extended the KSS test further.
However, despite of its accelerated importance and attraction, since the existing research is mainly conducted on determinants of CDS spreads and their relation with some other macroeconomic variables, unlike the equity, bond and foreign exchange markets, stationarity of CDS spreads and hence the efficiency of CDS markets is highly neglected in the literature. Besides, as the existing studies mainly focus on corporate CDSs, research on sovereign CDSs is surprisingly almost nil. Among the handful studies, Aktug et al. (2012) and Karg? (2014) applied linear unit root tests to certain sovereign CDS spreads before conducting co-integration and causality tests. Given the rising importance of the CDS markets and the dearth of past empirical research, this study focuses on the predictability of CDS premiums by concentrating on both linear and nonlinear dynamics which constitutes a distinguishing feature of this study.
Adf, Kss And Sollis Unit Root Tests
The well-known ADF test considers the simplest AR(1) process as of form:

The asymptotic critical values of ADF test are given in Table 1.
| Table 1: Asymptotic Critical Values Of The Adf Test | |||
| Significance | No term | Constant | Trend |
|---|---|---|---|
| 1 | -2.58 | -3.43 | -3.96 |
| 5 | -1.95 | -2.86 | -3.41 |
| 10 | -1.61 | -2.57 | -3.12 |
KSS test of Kapetanios et al. (2003) consideres the unit root null  VS the nonlinear alternative
 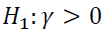 in the ESTAR framework as:

However  , as is not identified under the null hypothesis they came up with an innovative solution via computing the first order Taylor series approximation of the ESTAR function around zero and derived the auxiliary relation:
where  where
where  stands for the error arising from Taylor approximation.
The distribution under the null hypothesis  is stated in
The asymptotic critical values of KSS test are given in Table 2.
| Table 2: Asymptotic Critical Values Of The Kss Test | |||
| Significance | No term | Constant | Trend |
|---|---|---|---|
| 1 | -2.81 | -3.47 | -3.91 |
| 5 | -2.23 | -2.91 | -3.38 |
| 10 | -1.94 | -2.63 | -3.13 |
Then, through examining the cases of asymmetry in the transition function, Sollis (2009) extends the KSS test further via developing a unit root test stated by eqns. (5-7):
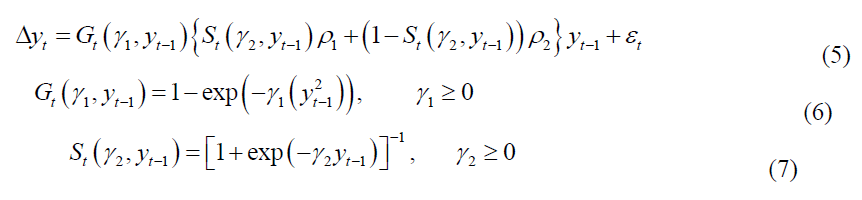
As in the KSS test, first order Taylor expansion is applied to the function given in eqn. (6). Moreover, first order Taylor expansion is applied to eqn. (7) as well yielding the auxiliary relation:

For this case the null hypothesis of eqn. (8) denoted by  is transformed into:

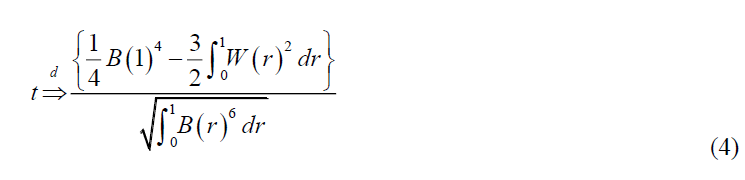
Since we wish to test whether two variables are simultaneously equal to zero or not, instead of t-statistics used in ADF or KSS tests, one should apply F-statistics. In that regard the asymptotic distribution of Equation (9) becomes:
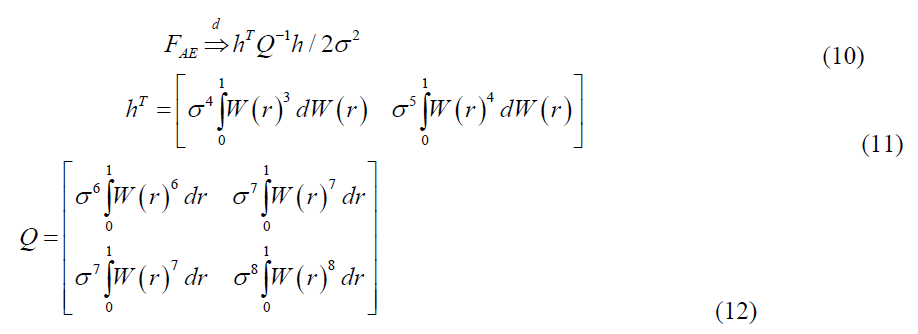
The derivation is similar to KSS test, but a bit lengthy. Readers can follow the detailed proof from Sollis (2009). The asymptotic distribution given by eqns. (10-12) is for “no term” case. For cases “constant” and “trend” W ( r) should be replaced with the relevant terms (see Hamilton, 1994 for details). The critical values for Sollis test are portrayed in Table 3.
| Table 3: Asymptotic Critical Values Of The Sollis Test | |||||||||
| T | FAE (no term) | FAE, μ, (with constant) | FAE, t (with trend) | ||||||
|---|---|---|---|---|---|---|---|---|---|
| 10% | 5% | 1% | 10% | 5% | 1% | 10% | 5% | 1% | |
| 50 | 3.577 | 4.464 | 6.781 | 4.009 | 4.886 | 6.891 | 5.415 | 6.546 | 8.799 |
| 100 | 3.527 | 4.365 | 6.272 | 4.157 | 4.954 | 6.883 | 5.460 | 6.463 | 8.531 |
| 200 | 3.496 | 4.297 | 6.066 | 4.173 | 4.971 | 6.806 | 5.590 | 6.597 | 8.954 |
| Asymptotic | 1.837 | 2.505 | 4.241 | 3.725 | 4.557 | 6.236 | 5.372 | 6.292 | 8.344 |
Data And Results
The research data is comprised of daily 5-year maturity Latvian CDS spreads between 01:2006-08:2017. To avoid the initial condition problem of unit root tests which is first proposed in the seminal study by Müller & Elliot (2003), the starting/ending dates of the research period around a major event, especially the 2008 crisis and the adoption of Euro by Latvia on January 2014, are avoided. The data is extracted from Bloomberg and depicted in Figure 1.

Figure 1:Daily Latvian Cds Spreads Between 01:2006-08:2017.
Table 4 provides the unit root test results for ADF and KSS tests:
| Table 4: Unit Root Test Results For Adf And Kss Tests | ||||||
| ADF Test | KSS Test | |||||
|---|---|---|---|---|---|---|
| No term | Constant | Trend | No term | Constant | Trend | |
| t statistics | -1.3557 | -1.9969 | -2.5409 | -2.4575** | -2.6298 | -3.1164 |
| *, **, *** denote significance at 10%,5% and 1% respectively. | ||||||
From Table 4, it is clear that ADF test fails to reject the presence of unit root for all cases. On the other hand, KSS test only detects stationarity with no constant case at 5% significance level. However, to further check for asymmetry in the transition function, Sollis test is applied which provided more significant results and are portrayed in Table 5.
| Table 5: Unit Root Test Results For Sollis Test | |||
| No term | Constant | Trend | |
|---|---|---|---|
| F statistics | 5.0796** | 6.7714** | 9.7423*** |
| *, **, *** denote significance at 10%,5% and 1% respectively. | |||
As Table 5 reveals, Sollis test captures the presence of an asymmetric smooth transition for all cases. For no term case, the significance level is reported to be 5%. However, one should be cautious in interpreting this result in the sense that the F statistics is found to be 5.0796 and when compared with the critical values presented at Table 2 for 1% significance level, our statistics lies within 200 observations and asymptotic value indicating a possibility of 1% significance level since our number of observations are 2807. Nevertheless, as for no constant term case critical values change drastically when the number of observations increase beyond 200, in order to be on the safe side, a 5% significance level is attributed for the presented data. Anyway, although both KSS and Sollis tests claim 5% significance level for no term case, it is evident that there is still room for the presence of an asymmetric smooth transition.
| Table 6: Unit Root Test Results For Perron And Za Tests | ||||||
| Perron Test | ZA Test | |||||
|---|---|---|---|---|---|---|
| Intercept | Trend | Both | Intercept | Trend | Both | |
| t statistics | -3.6167 | -3.2865 | -5.3671* | -3.6211 | -3.7769 | -4.9302* |
| *, **, *** denote significance at 10%,5% and 1% respectively. | ||||||
For constant case, the number of observations increase as the F statistics again decrease but this time in a smoother manner compared to no term case. However, the obtained statistics are again positioned with 5% significance level since the computed F statistics is 6.7714 which is in between 200 observations and asymptotic value. Remembering that KSS test fails to reject the presence of unit root for this case, this finding strengthens the assertion of an asymmetric smooth transition.
For the trend case, the F statistics is found to be 9.7423 which surpasses all the critical values considerably indicating a 1% significance level while KSS test fails to detect stationarity. Consequently, a comparative analysis of the above test results indicates the existence of an asymmetric smooth transition rather than a symmetric one.
In addition, the possibility of structural breaks is also explored via Perron (Perron, 1997) and ZA (Zivot & Andrews, 1989) tests. They are found to be almost insignificant. The results are portrayed in Table 6.
Concluding Remarks
Due to the growing importance attributed to the predictability and stationarity of CDS spreads, and thus the efficiency of CDS markets, this study focuses on the statistical properties of Latvian CDS spreads between 01:2006-08:2017. However, the results obtained for linear and nonlinear unit root tests provide conflicting results: while ADF test fails to reject the presence of unit root, KSS test claims a symmetric smooth transition for “no term” case at 5% significance level. However, with the aim of building a more comprehensive understanding, Sollis test is applied to check the presence of asymmetry of the smooth transition. A comparative analysis of the nonlinear test results points to the existence of an asymmetric smooth transition rather than a symmetric one for Latvian CDS spreads. Contrary to the findings obtained for the linear unit root test of ADF, an overall examination of the research results convey that Latvian CDS spreads are stationary suggesting that the CDS market is not efficient in weak form which raises concerns about the effectiveness of CDS spreads as an indicator of risk. These results also point to the necessity of checking for nonlinearities through accounting for both symmetric and asymmetric smooth transition in CDS premiums in examining the predictability of CDS spreads.
References
- Akdogan, K., & Chadwick, M.G. (2011). Nonlinearities in CDS-Bond Basis. Central bank of the Republic of Turkey. Working paper No: 11/13.
- Aktug, R.A., Vasconcellos, G., & Bae, Y. (2012). The dynamics of sovereign credit default swap and bond markets: empirical evidence from the 2001 to 2001 period. Applied Economics Letters, 19, 251-259.
- Avino, D., & Nneji, O. (2014). Are CDS spreads predictable? An analysis of linear and non-linear forecasting models. International Review of Financial Analysis, 34, 262-274.
- Dickey, D.A., & Fuller, W.A. (1979). Distribution of the estimators for autoregressive time series with a unit root. Journal of the American Statistical Association, 74, 427-431.
- Dickey, D.A., & Fuller, W.A. (1981). Likelihood ratio statistics for autoregressive time series with a unit root. Econometrica, 49(4), 1057-1072.
- Hamilton, J.D. (1994). Time Series Analysis. Princeton University Press.
- Kapetanios, G., Shin, Y., & Snell, A. (2003). Testing for a unit root in the nonlinear STAR framework. Journal of Econometrics, 112, 359-379.
- Kargi, B. (2014). CDS spreads: The analysis of time series for the interaction with the interest rates and the growth in Turkisk economy. Montenegrin Journal of Economics, 10(1), 59-66.
- Kim, J., & Park, J.Y. (2013). Mean reversion and unit root properties of diffusion models: Working paper, Indiana University.
- Kregzde A., & Murauskas, G. (2014). Analyzing sovereign credit default swaps of baltic countries, verslas: Teorija ir Praktika / Business: Theory and Practice, 16(2), 121-131.
- Müller, U.K. & Elliott, G. (2003). Tests for unit roots and the initial condition. Econometrica, 71(4), 1269-1286.
- Perron, P. (1997). Further evidence on breaking trend functions in macroeconomic variables. Journal of Econometrics, 80(2), 355-385.
- Sollis, R. (2009). A simple unit root test against asymmetric STAR nonlinearity with an application to real exchange rates in Nordic countries. Economic Modelling, 26, 118-125.
- Zivot, E., & Andrews, D. (1992). Further evidence on the great crash, the oil price shock, and the unit root hypothesis. Journal of Business and Economic Statistics, 10(3), 251-270.