Research Article: 2023 Vol: 27 Issue: 4S
Bank Health Analysis Using the Camel Ratio on the Performance of Credit Card Issuing Banks
Eddy Winarso, Jenderal Achmad Yani University
Yogo Heru Prayitno, Widyatama University
Citation Information: Winarso, E., & Prayitno, Y.H. (2023). Bank health analysis using the camel ratio on the performance of credit card issuing banks. Academy of Accounting and Financial Studies Journal, 27(4), 1-24.
Abstract
This research was conducted on 23 credit card issuing banks with years of observation from 2016 to 2021, researchers conducted an analysis using the CAMELS Ratio. Data is obtained from annual reports issued by the banking sector registered with the Financial Services Authority and then processed using eviews-8. Analysis is carried out partially or simultaneously. From the results of data processing, it is obtained that the CAMEL ratio is based on Bank Indonesia and Financial Services Authority Regulations from 2016 to 2021. It can be concluded that 32 credit card issuing banks have received very healthy predicates for the ratio Capital Adequacy Ratio (CAR), Non-Performing Loans (NPL), Net profit Margin (NPM), Operating Expense Ratio (OER) and Loan to Deposit Ratio (LDR). Except for Return on Assets (ROA) in a healthy predicate. Partially from the CAMEL ratio there are several ratios that have a negative influence on bank performance as measured by ROA, namely Capital (CAR), asset quality (NPL) and earnings as measured by (EOR). While management (NPM), earnings as measured by NIM and liquidity as measured by LDR have a positive effect on bank performance as measured by ROA. Simultaneously all ratios namely Capital, Asset Quality, Management, earnings, and liquidity have a positive influence on bank performance fundamentally.
Keywords
CAMELS, CAR, NPL, NPM, ROA, OER, LDR.
Introduction
In the economy of a country, the banking sector has a very strategic and important role, because the banking sector connects trade transactions around the world through the role of banks in each country by using the latest financial information technology so that transactions can be completed immediately. Therefore, the banking sector must really maintain the level of trust from entrepreneurs and also the community. In addition, banking has a very important role in supporting the real sector of the economy, namely functioning as a mediator between parties who have excess funds and those who need funds. So that the real sector can grow, the impact of a healthy bank is that the inflation rate will be suppressed and the Gross Domestic Product (GDP) will increase.
The role of banks in the economy of a nation is very important, namely as an indicator of a country's economy so that a healthy bank will strengthen the economic activities of a nation. Conversely, economic activity will be unhealthy if the banking sector is not healthy.
According to Law Number 10 of 1998 article 1 concerning banking states: "that a bank is a business entity that collects funds from the public in the form of savings and distributes them to the public in the form of credit and or other forms in order to improve the standard of living of the common people". [1]
According to A. Abdurahman (1999:2) [2] "a bank is a type of financial institution that carries out various services, such as providing loans, circulating currency, supervising currency, acting as a place for storing valuable objects, financing company business and others".
One of the banking activities in improving its performance is issuing or issuing credit cards in collaboration with international credit card principals. That is, banks provide credit card facilities to their customers with certain requirements for transactions with merchants, so that customers are facilitated in making economic transactions with merchants around the world. The banking sector that issues credit cards and has been approved by Bank Indonesia is 23 conventional banks, 1 Sharia-based bank and 1 Financial Company with the following details Table 1:
| Table 1 Credit Card Issuing Banks |
|||
|---|---|---|---|
| No | Issuing bank name | No | Issuing bank name |
| 1 | Bank Rakyat Indonesia (pesero) | 14 | Bank HSBC Indonesia |
| 2 | Bank Mandiri (pesero) | 15 | Bank Standard Charter |
| 3 | Bank Central Asia | 16 | Bank ICBC Indonesia |
| 4 | Bank Negara Indonesia 1946 (pesero) | 17 | Bank KB Bukopin |
| 5 | Bank Maybank | 18 | Bank MNC Indonesia |
| 6 | Pan Indonesia Bank | 19 | Bank Sinar Mas |
| 7 | Bank CIMB Niaga | 20 | Bank QNB Indonesia |
| 8 | Bank Danamon Indonesia | 21 | Bank Mayapada |
| 9 | Bank Permata | 22 | Bank DBS Indonesia |
| 10 | Bank Mega | 23 | Bank Shinhan Indonesia |
| 11 | Bank Citi Bank Indonesia | 24 | AEON Credit Service |
| 12 | Bank UOB Indonesia | 25 | Bank BNI Syariah |
| 13 | Bank OCBC NISP | ||
Source: Bank Indonesia (2020) (www.bi.go.id)[3]
Note: Bank BNI Syariah has merged to become Bank Syariah Indonesia (BSI), and AEON Credit Service is not a bank, so in this study only 23 banks were the object.
Credit card principals circulating in Indonesia are:
| Table 2 Credit Card Principals |
||
|---|---|---|
| No | Principal Name | Network name |
| 1 | PT. JCB Inrternational | JCB |
| 2 | PT. Mastercard Indonesia | Master Card |
| 3 | PT. Visa Worldwide Indonesia | Visa Card |
| 4 | PT. Union Pay Indonesia | CUP |
| 5 | American Express | Amex |
Source: www.bi.go.id
Of the five principals that people like most in Indonesia, they are Master Card and Visa Card because they have a fairly extensive network. Bank Indonesia (BI) noted that the number of credit cards in circulation in Indonesia reached 16.58 million units in June 2022. This number increased by 0.84% compared to June 2021 which amounted to 16.56 million credit cards. Even though it has increased on an annual basis, the number of credit cards circulating in the country has experienced a downward trend since the Covid-19 pandemic hit. This condition occurs along with the shift of society to using electronic money (e-wallet). The reason is that electronic money is considered safer from the transmission of Covid-19 because it has minimal direct contact, is efficient, and has lots of promos. Furthermore, the value of credit card transactions reached IDR 149.18 billion in the sixth month of 2022. The number jumped 34.35% compared to 2021 which amounted to IDR 19.81 trillion. Meanwhile, the volume of credit card transactions was recorded at 27.93 million times in June 2022. This number experienced an increase of 20.26% compared to the same period in 2021 of 23.22 million times. Credit card growth from 2012 to June 2022 can be seen in Figure 1:

Figure 1: Number Of Indonesian Credit Cards.
The banking industry has earned a net profit of IDR 78.17 trillion as of July 2021, growing 9.68% compared to the same period in 2020 of IDR 71.27 trillion. The increase in net profit was supported by the high growth profitability of the large bank groups. Referring to statistical data on Indonesian banking until July 2021 released by the Financial Services Authority (OJK), the growth in banking net profit was contributed by net interest income (NII) which grew 12.89% on an annual basis (year on year/YoY) to IDR 245.43 trillion.
The growth in banking net profit until July 2021 has accelerated compared to growth until June 2021 which was 7.92% (YoY). This is in line with the improvement in lending to the banking industry which is getting higher. "Judging from the increased net interest margin (NIM), it shows that banks are widening their NIM to get additional profit," said Director of Research at the Center for Reform on Economics (CORE) Indonesia Piter Abdullah Redjalam to Investor Daily, Monday (4/10/21).
OJK data explained that based on the Commercial Banks for Business Activities (BUKU) group, only the BUKU IV group or large banks experienced net profit growth. Meanwhile, the BUKU II and BUKU III groups recorded contractions. BUKU IV net profit as of July 2021 reached IDR 56.55 trillion, a high jump of 23.61% compared to the same period last year of IDR 45.75 trillion. Meanwhile, the BUKU III group experienced a contraction of 16.61% until July 2021, from IDR 19.08 trillion for the same period in 2020 to IDR 15.91 trillion. The deepest contraction occurred in the net profit of the mini-bank group or BUKU II, namely minus 46.02%, to IDR 2.51 trillion as of July 2021. Meanwhile, net profit for the same period in 2020 was IDR 4.65 trillion Figure 2.

Figure 2: Bank Profits Are Starting To Recover.
Piter said, the bank widened the NIM to get additional profits. Since last year, he continued, banks have lowered deposit rates sufficiently to keep up with the decline in BI's benchmark interest rate, but on the other hand banks have not reduced lending rates much. When viewed from NIM, the large bank group still recorded the highest NIM of 5.17% as of July 2021, followed by BUKU II NIM of 4.62%, and BUKU III NIM of 3.51%.
Overall, the banking industry's NIM was at the level of 4.64%, up from last year's 4.44%. “On the other hand, banks can also place their funds in SBN (State Securities). SBN offers quite high yields, amidst falling deposit rates," added Piter. Until the end of 2021, the banking profitability trend can grow even higher. These are mainly large banks. “Bank net profit will vary between banks. However, overall it is the BUKU IV banks that will get the biggest profit," said Piter.
When viewed based on ownership, the association of state-owned banks (Himbara) recorded the highest net profit growth, reaching 27.31% (YoY) to IDR 34.73 trillion as of July 2021. Next are regional development banks (BPD), which pocket a net profit of IDR 8 .02 trillion, or an increase of 8.38% (YoY).
For National Private Commercial Banks (NPCB) posted a net profit of IDR 33.01 trillion, up 8.34% (YoY) until July 2021. Meanwhile, net profit from Foreign Bank Branch Offices (FBBO) of IDR 2.41 trillion, experienced a sharp correction inside, namely minus 60.62% (YoY). https://investor.id/finance/265991/laba-bersih-perbankan-tumbuh-968 [5]
Editor: Gora Kunjana (gora_kunjana@investor.co.id) [6]
In this study, bank health will be analyzed using the CAMEL ratio on the performance of credit card issuing banks in Indonesia. To improve bank performance, Bank Indonesia issued 3 regulatory relaxations in 2018, namely:
1. Expansion of the averaging Statutory Reserves (GWM) as stipulated in Bank Indonesia Regulation (PBI) No. 19/6/PBI/2017[7] concerning the fifth amendment to PBI No. 15/15/PBI/2013 [8] concerning Statutory Reserves for Commercial Banks in Rupiah and Foreign Currency for Conventional Commercial Banks. Becomes 6.50 %.
2. Liquidation calculations are added with corporate bond instruments with certain ratings which are included in the financing element so that the FFR (Financing to Funding Ratio) is in the range of 80% to 92%.
3. The LTV ratio is adjusted to the conditions of each area. LTV regulations will be published July 2018.
These three relaxations have actually been included in the CAMEL analysis, therefore in this study the researcher wanted to know:
What is the influence of bank health as measured using the CAMEL Ratio on the performance of credit card issuing banks in Indonesia?
Theoretical Basis
Bank Health
A healthy bank is a bank that carries out its functions properly, including: maintaining public trust, carrying out the intermediary function, smoothing payment traffic and implementing government policies, especially in the monetary sector. According to Bank Indonesia Regulation No. 13/I/2011[9] concerning the assessment of the soundness level of commercial banks, banks are required to carry out a self-assessment using a risk-based bank rating approach individually or consolidated.
According to the Circular Letter of the Board of Directors of Bank Indonesia No. 6/10/PBI/2004[10] dated 12 April 2004 regarding the rating of the soundness level of commercial banks and Bank Indonesia Regulation that "the soundness level of a bank is an assessment of the condition of a bank's financial statements at a certain period and time in accordance with Bank Indonesia Standards", Bank Regulation Indonesia No. 10/1/PBI/2004[11] article 1 paragraph 4 and Bank Indonesia Circular Letter No. 13/24/DPNP[12] dated 25 October 2011 regarding the procedures for assessing the soundness level of commercial banks, assessed by a qualitative approach to the factors that affect the condition and development of banks in this case are capital factors, productive assets, management factors, profitability factors, factors liquidity and sensitivity factors are known as CAMELS which can be seen in Table 3.
| Table 3 Bank Soundness Level According To Camels |
|
| CAMELS Credit Score | Predicate |
| 81 % - 100 % | Healthy |
| 66 % < 81 % | Healthy enough |
| 55 % < 66 % | Un healthy |
| 00 % < 55 % | Not healthy |
Source: Circular Letter BI No. 13/24/DPNP 25 Oktober 2011[12]
Regulation of the Financial Services Authority (POJK) No.8/POJK.03/2014[13] explains that bank soundness is a means of supervisory authority over banks. Changes in business and economic complexity that are related directly or indirectly have the potential to arise risks that can originate from the bank or from external banks that affect the soundness of the bank.
Bank soundness level according to POJK No. 8/POJK.03/2014 in the form of the results of an assessment of the condition of a bank which is carried out based on the risk and performance of the bank or is called a Risk-based Bank Rating. Measuring the soundness level of a bank includes using the CAMEL (Capital, Asset Quality, Management, Earning and Liquidity) method
Scope of CAMEL
Bank health assessment includes:
(a) Capital (b) Asset Quality (c) Management (d) Earnings (e) Liquidity
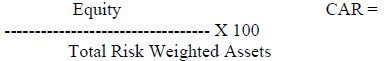
Capital
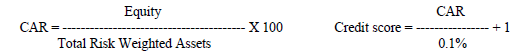
The ability of a bank to provide capital in accordance with the minimum capital requirement of a bank is called solvency. The solvency level of a bank is measured by the Capital Adequacy Ratio (CAR) based on Bank Indonesia regulations for a minimum CAR of 8%, the CAR calculation is as follows Table 4:
CAR Assessment Criteria
| Table 4 Car Assessment Criteria |
||
|---|---|---|
| CAR Ratio (%) | Credit Value (%) | Predicate |
| ?8 | 81 – 100 | Healthy |
| 6.5 ≤ 8 | 66 <81 | Healthy enough |
| ≤6.5 | <51 | Not Healthy |
Source: Taswan (2006:363) [14]
Asset quality
Non-performing loans are a comparison between non-performing loans and the amount of credit extended to society as a whole. According to Hariyani (2010) the NPL ratio is a ratio that shows the ability of bank management to manage non-performing loans provided by banks. The higher the NPL, the worse the bank's credit quality, which results in the bank being in a state of greater trouble.
One of the risks faced by banks is the risk of non-payment of credit that has been given to debtors or is called credit risk. According to Ghozali in Adicondro [15] (2015) credit risk is:
"the risks faced by banks due to uncertainty or failure of installment payments (counterparties) in fulfilling their obligations".
Credit risk can be divided into 3 risks, namely: 1. Default Risk, 2. Exposure Risk and 3. Recovery Risk. Credit risk includes non-performing loans.
Non-performing loan (NPL) is a problem loan, namely the debtor is unable to fulfill the loan and interest arrears payments within the time period agreed in the agreement. This is also explained in Financial Accounting Standards No. 31 (revised 2000) [16] which states that:
"Non-performing credit is generally a credit whose payment of principal/or interest installments has passed ninety or more days after the due date or credit whose timely payment is very doubtful."
According to Iswi Hariyani (2010) [17], the ratio of NPL or non-performing loans is a ratio that shows the ability of bank management to manage non-performing loans provided by banks. The higher the NPL, the worse the quality of bank credit, which causes the number of non-performing loans to increase.
According to Mudrajad Kuncoro & Suhardjono (2012) [18] based on the codification of Bank Indonesia Regulations: NPL is a ratio that measures the ratio of the number of non-performing loans to total credit, namely:
1. Credit is credit extended to third parties (excluding credit to other banks)
2. Non-performing loans are loans with substandard (SS), doubtful (D) and loss (L) qualities.
3. Non-performing loans are calculated on a gross basis.
4. Figures are calculated per position (not annualized)
Non-performing credit describes a situation where the approval of credit returns is at risk of failure, even tends to lead to or experiences potential losses. It should be noted that it is wrong to think that credit problems are always due to customer error. Non-performing loans can be caused by various things originating from customers, internal conditions and lenders Table 5.
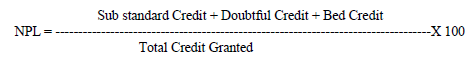
Included in non-performing loans are substandard loans, doubtful loans and bad loans. According to Bank Indonesia Circular No. 13/30/DPNP December 16 2011 [19], Non- Performing Loans can be calculated using the formula:
| Table 5 Criteria NPL |
||
|---|---|---|
| Rating | Criteria | Information |
| 1 | NPL <2 % | Very Good |
| 2 | 2% ≤NPL ≤5% | Good |
| 3 | 5% ≤NPL ≤8% | Quite Good |
| 4 | 8% ≤NPL <12% | Un Good |
| 5 | NPL ≥ 12% | Not Good |
Source: Circular Letter Bank Indonesia No 13/30/DPNP
The criteria for assessing NPL according to Bank Indonesia regulation no. 15/2/PBI/2013 [20] as follows Table 6:
| Table 6 Assessment Of The Ratio Of Non-Performing Loans |
||
|---|---|---|
| Predicate | Rasio NPL (%) | Credit Value (%) |
| Healthy | 00,00 – NPL ≤10,35 | 81 – 100 |
| Healthy enough | 10,35 <NPL ≤12,60 | 66 ≤81 |
| Unhealthy | 12,60<NPL ≤14.85 | 51<66 |
| Not healthy | NPL >14,85 | 00 ≤51 |
Source: Regulation Bank Indonesia No 15/2/PBI/2013
An increase in NPLs in large numbers can cause problems for the health of banks, therefore banks are required to always maintain credit not in a high NPL position.
Asset quality measures the strength of a financial institution against the loss of value in these assets. Asset quality with Non-Performing Loans (NPL), which measures a bank's ability to manage non-performing loans extended by banks. According to Bank Indonesia regulations, NPLs cannot be greater than 5%.
Management
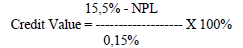
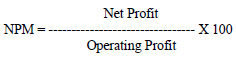
Management quality shows management's ability to identify, measure, monitor and control the risks that arise through the bank's business policies and strategies to achieve targets. The success of management can be classified as healthy if it meets at least 81% of all aspects of measuring management capabilities. The Net Profit Margin (NPM) approach is used, which is a ratio to measure a bank's ability to generate net profit from its main operating activities. The greater the NPM value, the more optimal the bank is in forming net profit.
In accordance with Bank Indonesia regulation No. 6/23/DPNP [21] of 2004 a bank is said to be healthy if the NPM ratio is > 81%. Credit Value = NPM Value.
Earnings
Judging from two things, namely the Net Interest Margin (NIM) and the Ratio of Operating Expenses to Operating Income (OER) as follows:
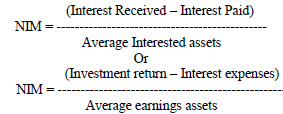
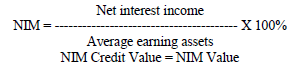
(1) Net Interest Margin (NIM) is a ratio used to measure the ability of bank management to manage its productive assets to earn net interest. According to Riyadi (2012) [22] Net Interest Margin is the comparison between Interest Income (bank interest income) minus interest expense (bank interest costs that become expenses) divided by Average Interest Earnings assets (average earning assets used). The greater the NIM, the higher the interest income earned. According to the standards set by Bank Indonesia, the NIM ratio is > 6%.
Net Interest margin (NIM) is the ratio of Net Interest Income to interest assets is also known as “net yield on interest earnings assets”
Federal Financial Institutions Examination Council (FFIEC) release average NIM for all U.S. bank average 3,8% James (2018). (https://investingnews.com) [23]
Based on Bank Indonesia circular letter No. 6/23/DPNP dated 31 May 2004 NIM is calculated by the formula:
Positive NIM means the Investment strategy pays more interest than it costs. If the NIM is negative, it means that the investment strategy costs more than it make Table 7.
| Table 7 Criteria For Determining Net Interest Margin (Nim) Levels |
|||
|---|---|---|---|
| Rating | Ratio | Definition | Information |
| 1 | NIM >3% | The Net Interest Margin is very high. Meaning that the NIM level is very healthy | Very Healthy |
| 2 | 2% <NIM = 3% | High Net Interest Margin, meaning a heathy NIM level | Healthy |
| 3 | 1,5% <NIM = 2% | The Net Interest Margin is quite high, meaning that the NIM level is quite healthy | Healthy enough |
| 4 | 1% <NIM = 1,5% | The low Net Interest Margin is negative, meaning that the NIM level is un healthy | Un Healthy |
| 5 | NIM = 1% | The Net Interest Margin is very low or negative, meaning that the NIM level is Not healthy | Not Healthy |
Source: Circular Letter Bank Indonesia No. 13/24/DPNP year 2011
(2) Diversification of income including the ability of banks to obtain fee-based income, and diversification of investment, as well as the application of accounting principles in recognizing income and expenses (Operating Expense Ratio – OER) Table 8.
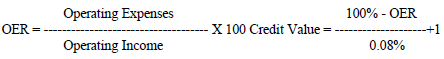
OER Assessment Criteria
| Table 8 Oer Assessment Criteria |
||
|---|---|---|
| OER Ratio (%) | Credit Value (%) | Predicate |
| <93.52 | 81 – 100 | Healthy |
| 93.52 –94.73 | 66 <81 | Healthy enough |
| 94.73 – 95.92 | 51 <66 | Un Healthy |
| ?95.52 | 0 – 51 | Not Healthy |
Source: Taswan (2006:363) [14]
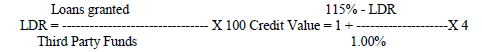
Liquidity
Liquidity shows the level of a bank's ability to pay off short-term obligations on time. According to Bank Indonesia, the criteria for liquidity at rank 1 are 50% < ratio < 75% Table 9.
LDR Assessment Criteria
| Table 9 Ldr Assessment Criteria |
||
|---|---|---|
| LDR Ratio (%) | Credit Value (%) | Predicate |
| <94.75 | 81 – 100 | Healthy |
| 94.75 – 98.50 | 66<81 | Healthy Enough |
| 98.50 – 102.25 | 51 <66 | Un healthy |
| ?102.25 | 0 – 51 | Not healthy |
Source: Taswan (2006:363) [14]
Company Performance
The bank's financial performance is measured by profitability/rentability, namely the bank's ability to generate profits to support expansion and cover risks as well as measure the level of management efficiency and effectiveness in carrying out bank operations. In accordance with Bank Indonesia Regulation Number 91/PBI/2007 [23] the components of profitability are:
1. The ability to generate profits, the ability to support expansion and cover risks, as well as the level of efficiency.
2. Diversification of income including the ability of banks to obtain fee-based income, and diversification of investment, as well as the application of accounting principles in recognizing income and expenses.
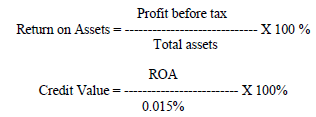
In this study used Return on Assets with the formula:
Company performance is the investor's perception of the company's level of success which is often associated with stock prices. High stock prices make the company value also high, and increase market confidence not only in the company's current performance but also in the company's prospects in the future Table 10 and Table 11.
| Table 10 Criteria For Determining Return On Asset (Roa) Ratings |
||
|---|---|---|
| Rating | Criteria | Information |
| 1 | ROA = 0% | Inadequate profitability |
| 2 | 0%<ROA = 0,5% | Minus profitability is adequate |
| 3 | 0,5% <ROA = 1,25% | Rentability is quite adequate |
| 4 | 1,25% <ROA = 1,5% | Adequate profitability |
| 5 | ROA > 1,5% | Rentability is very adequate |
Source: Circular Letter Bank Indonesia No. 13/24/DPNP year 201 1[12]
| Table 11 Credit Value And Predicate Roa |
||
|---|---|---|
| ROA (%) | Credit Value Standard BI | Predicate |
| = 1,215 | 81 – 100 | Healthy |
| =0,99 – <1,215 | 66 ≤81 | Healthy enough |
| =0,765– <0.999 | 51 ≤66 | Un healthy |
| <0,765 | 0 ≤51 | Not Healthy |
Source: Circular Letter Bank Indonesia No 6/23/DPNP date 31 Mei 31, 2004[20]
Maximizing the value of the company also means maximizing the company's main goals. Increasing the value of the company is an achievement that is in accordance with the wishes of the owners, because with the increase in the value of the company, the welfare of the owners will also increase. In this study, company value is measured by ROA. Because the banks studied were not all publicly listed companies, they did not receive stock price information Table 12 & Figure 3.
| Table 12 Operationalization Of Variables |
|||
|---|---|---|---|
| VARIABLE | INDICATOR | SCALE | INSTRUMENT |
| Capital (X1) |
------- + 1 0.1 |
RATIO | Financial Statement |
| Assets Quality (X2) |
Sub Standard Credit + Doubtful Credit + Bad Credit NPL = ---------------------------------- X 100 Total Credit Granted 15,5% - NPL Credit Value = ----------------- X 100 0,15% |
RATIO | Financial Statement |
| Management (X3) | Net Profit NPM = --------------------- X 100 Operating Profit Credit Value = NPM |
RATIO | Financial Statement |
| Earnings (X4) | Net Interest Income NIM = --------------------------------- X 100 Average earnings assets Credit Value = NIM Operating Expenses OER = ------------------------------- X 100 Operating Income 100 % - OER Credit Value = -------------------- + 1 0,08 % |
RATIO | Financial Statement |
| Liquidity (X5) | Loans Granted LDR = ---------------------------- X 100 Third Party Fund 115% - LDR Credit Value = 1 + -------------------- X 4 1,00% |
RATIO | Financial Statement |
| Company Performance (Y) | Profit before tax ROA = ----------------------------- Total Assets |
RATIO | Financial Statement |
Research Methodology
Conceptual Paradigm

Figure 3: Research Paradigm.
Hypothesis Test Design
Ho1: CAMEL Ratio has no partial effect on the performance of Card Issuing Banks Credit
Ha1: CAMEL Ratio partially affects the performance of Card Issuing Banks Credit
Ho2: CAMEL Ratio simultaneously has no effect on the Performance of Credit Card Issuing Banks
Ha2: The CAMEL Ratio simultaneously affects the Performance of Card Issuing Banks Credit
Results and Discussion
The objects of this study are 23 credit card issuing banks in Indonesia with the following details Table 13:
| Table 13 Credit Card Issuing Bank |
|||
|---|---|---|---|
| No | Bank Name | No | Bank Name |
| 1 | Bank Rakyat Indonesia (pesero) | 13 | Bank OCBC NISP |
| 2 | Bank Mandiri (pesero) | 14 | Bank HSBC Indonesia |
| 3 | Bank Central Asia | 15 | Bank Standard Charter |
| 4 | Bank Negara Indonesia 1946 (pesero) | 16 | Bank ICBC Indonesia |
| 5 | Bank Maybank | 17 | Bank KB Bukopin |
| 6 | Pan Indonesia Bank | 18 | Bank MNC Indonesia |
| 7 | Bank CIMB Niaga | 19 | Bank Sinar Mas |
| 8 | Bank Danamon Indonesia | 20 | Bank QNB Indonesia |
| 9 | Bank Permata | 21 | Bank Mayapada |
| 10 | Bank Mega | 22 | Bank DBS Indonesia |
| 11 | Bank Citi Bank Indonesia | 23 | Bank Shinhan Indonesia |
| 12 | Bank UOB Indonesia | ||
Source: Bank Indonesia (2020) (www.bi.go.id).
Based on the financial reports that researchers obtained through the website http://ojk.go.id, all banks meet the requirements for processing, publishing financial reports from 2016 to 2021.
Descriptive Statistics
Based on Table 14 and Table 15 of the 23 Credit card issuing banks, the following is obtained:
Regression Results With The Eviews Program
| Table 14 Average Financial Ratio Of Credit Card Issuing Banks From 2016 To 2021 |
|||||||
|---|---|---|---|---|---|---|---|
| BANK NAME | CAR | NPL | NPM | NIM | EOR | LDR | ROA |
| BRI | 22,59 | 0,91 | 77,38 | 7,25 | 431,93 | 86,91 | 3,24 |
| MANDIRI | 20,36 | 0,80 | 78,62 | 5,35 | 72,22 | 88,35 | 2,51 |
| BCA | 23,94 | 0,53 | 80,33 | 6,03 | 59,00 | 74,17 | 3,76 |
| BNI 46 | 18,78 | 0,82 | 78,13 | 5,18 | 77,06 | 87,26 | 2,10 |
| MAYBANK | 20,96 | 2,20 | 77,61 | 4,22 | 86,64 | 87,19 | 1,18 |
| PANIN | 24,89 | 0,68 | 76,65 | 4,67 | 78,22 | 95,94 | 1,95 |
| CIMB NIAGA | 19,91 | 1,16 | 73,82 | 3,41 | 84,17 | 89,25 | 0,94 |
| DANAMON | 24,15 | 1,55 | -151,85 | 6,02 | 79,74 | 91,10 | 2,18 |
| PERMATA | 23,95 | 1,45 | 80,59 | 4,17 | 100,81 | 82,01 | -0,08 |
| MEGA | 25,86 | 1,57 | 80,32 | 5,35 | 72,83 | 61,62 | 2,97 |
| CITI BANK | 27,14 | 0,56 | 91,74 | 5,52 | 79,78 | 72,98 | 3,64 |
| UOB IND | 17,05 | 1,56 | 65,47 | 3,87 | 95,05 | 84,88 | 0,68 |
| OCBC NISP | 19,57 | 0,80 | 76,26 | 4,16 | 77,29 | 85,77 | 1,86 |
| HSBC IND | 24,57 | 1,63 | 79,49 | 4,52 | 84,04 | 93,71 | 1,53 |
| STANDCHART | 19,41 | 0,82 | 62,26 | 3,79 | 92,95 | 76,26 | 0,89 |
| ICBC IND | 19,79 | 2,30 | 11,30 | 2,48 | 89,80 | 104,82 | 0,66 |
| KB BUKOPIN | 13,41 | 4,70 | 124,86 | 2,26 | 121,69 | 96,31 | -1,29 |
| MNC | 17,27 | 3,11 | 48,71 | 3,73 | 110,14 | 81,19 | -1,00 |
| SINAR MAS | 19,39 | 2,24 | 47,46 | 6,64 | 100,17 | 70,40 | 0,68 |
| QNB IND | 23,13 | 1,88 | 85,93 | 1,95 | 138,53 | 83,36 | -2,78 |
| MAYAPADA | 14,89 | 2,35 | 68,61 | 3,05 | 92,05 | 86,02 | 0,84 |
| DBS IND | 21,21 | 1,11 | 80,78 | 5,24 | 95,16 | 87,12 | 0,47 |
| SHINHAN IND | 47,19 | 1,88 | 82,55 | 3,82 | 85,92 | 205,08 | 1,16 |
Source: Annual Report Company and www.ojk.ac.id
| Table 15 Average Financial Ratio Of Credit Card Issuing Banks From 2016 – 2021 Compared To Bank Indonesia Standards |
|||
|---|---|---|---|
| No | Ratio | Average | Bank Indonesia Standard |
| 1 | CAR | 22,15 % | Minimum 8 % |
| 2 | NPL | 1,59 % | Maximum 5 % |
| 3 | NPM | 64,22 % | Smaller than 81% |
| 4 | NIM | 4,46 % | Smaller than 6% |
| 5 | OER | 88,92 % | Smaller than 81% |
| 6 | LDR | 90,07 % | Smaller than 75% |
| 7 | ROA | 1,22 % | Greather than 1,5% |
Regression Results With The Eviews Program
| Dependent Variable: ROA | ||||
| Method: Least Squares | ||||
| Date: 01/25/23 Time: 17:11 | ||||
| Sample: 1 23 | ||||
| Included observations: 23 | ||||
| Variable | Coefficient | Std. Error | t-Statistic | Prob. |
| C | -1.490594 | 1.627308 | -0.915988 | 0.3733 |
| CAR | -0.019494 | 0.067214 | -0.290033 | 0.7755 |
| NPL | -0.583312 | 0.303594 | -1.921354 | 0.0727 |
| NPM | 0.001734 | 0.004628 | 0.374652 | 0.7128 |
| NIM | 0.760439 | 0.236559 | 3.214584 | 0.0054 |
| BOPO | -0.003082 | 0.003394 | -0.908004 | 0.3773 |
| LDR | 0.009862 | 0.016093 | 0.612835 | 0.5486 |
| R-squared | 0.675489 | Mean dependent var | 1.221232 | |
| Adjusted R-squared | 0.553798 | S.D. dependent var | 1.575103 | |
| S.E. of regression | 1.052143 | Akaike info criterion | 3.185325 | |
| Sum squared resid | 17.71208 | Schwarz criterion | 3.530910 | |
| Log likelihood | -29.63124 | Hannan-Quinn criter. | 3.272239 | |
| F-statistic | 5.550833 | Durbin-Watson stat | 1.927906 | |
| Prob(F-statistic) | 0.002808 | |||
Estimation Command:
=========================
LS ROA C CAR NPL NPM NIM BOPO LDR
Estimation Equation:
=========================
ROA = C (1) + C (2) * CAR + C (3) * NPL + C (4) * NPM + C (5) * NIM + C (6) * BOPO + C (7) * LDR
Substituted Coefficients:
=========================
ROA = -1.49059410191 - 0.0194941299376*CAR - 0.583312311326*NPL + 0.00173383395852*NPM + 0.760438652038*NIM - 0.00308191829047*BOPO + 0.00986219211912*LDR
Source: e Views
Bank Soundness Level Measurement Ratio
The CAMEL ratio is used to describe the good or bad financial position of a bank. The ratio is used to measure the soundness of a bank regarding Table 16 & Figure 4:
1. CAR (Capital Adequacy Ratio)
| Table 16 Capital Adequacy Ratio (Car) |
|||||||||||
|---|---|---|---|---|---|---|---|---|---|---|---|
| Credit Card | Capital Adequacy Ratio (CAR) | CAR | Credit | Standard | |||||||
| No | Issuing Bank | 2016 | 2017 | 2018 | 2019 | 2020 | 2021 | AVG | Score | BI | Predicate |
| 1 | BRI | 22,91 | 22,96 | 21,21 | 22,55 | 20,61 | 25,28 | 22,59 | 226,87 | 100 | Healthy |
| 2 | MANDIRI | 21,36 | 21,64 | 20,96 | 21,39 | 19,90 | 16,90 | 20,36 | 204,58 | 100 | Healthy |
| 3 | BCA | 21,90 | 23,06 | 23,39 | 23,80 | 25,83 | 25,66 | 23,94 | 240,40 | 100 | Healthy |
| 4 | BNI 46 | 19,36 | 18,53 | 18,51 | 19,73 | 16,78 | 19,74 | 18,78 | 188,75 | 100 | Healthy |
| 5 | MAYBANK | 16,98 | 17,63 | 19,09 | 21,42 | 24,25 | 26,38 | 20,96 | 210,58 | 100 | Healthy |
| 6 | PANIN | 20,32 | 22,26 | 23,49 | 24,07 | 29,55 | 29,66 | 24,89 | 249,92 | 100 | Healthy |
| 7 | CIMB NIAGA | 17,71 | 18,22 | 19,00 | 21,00 | 21,24 | 22,29 | 19,91 | 200,10 | 100 | Healthy |
| 8 | DANAMON | 22,30 | 23,24 | 22,79 | 24,59 | 25,59 | 26,38 | 24,15 | 242,48 | 100 | Healthy |
| 9 | PERMATA | 15,64 | 18,12 | 19,44 | 19,89 | 35,68 | 34,94 | 23,95 | 240,52 | 100 | Healthy |
| 10 | MEGA | 26,21 | 24,11 | 22,79 | 23,68 | 31,04 | 27,30 | 25,86 | 259,55 | 100 | Healthy |
| 11 | CITI BANK | 30,00 | 27,48 | 23,53 | 26,68 | 28,26 | 26,87 | 27,14 | 272,37 | 100 | Healthy |
| 12 | UOB IND | 16,44 | 17,08 | 15,37 | 16,55 | 18,85 | 17,98 | 17,05 | 171,45 | 100 | Healthy |
| 13 | OCBC NISP | 18,28 | 17,51 | 17,63 | 19,10 | 21,98 | 22,94 | 19,57 | 196,73 | 100 | Healthy |
| 14 | HSBC IND | 23,69 | 22,49 | 20,79 | 23,65 | 26,70 | 30,07 | 24,57 | 246,65 | 100 | Healthy |
| 15 | STANDCHART | 16,59 | 19,51 | 16,60 | 17,14 | 24,02 | 22,62 | 19,41 | 195,13 | 100 | Healthy |
| 16 | ICBC IND | 15,86 | 17,72 | 16,21 | 21,64 | 23,87 | 23,41 | 19,79 | 198,85 | 100 | Healthy |
| 17 | KB BUKOPIN | 11,62 | 10,52 | 13,41 | 12,59 | 12,08 | 20,26 | 13,41 | 135,13 | 100 | Healthy |
| 18 | MNC | 19,54 | 12,58 | 16,27 | 15,16 | 15,75 | 24,31 | 17,27 | 173,68 | 100 | Healthy |
| 19 | SINAR MAS | 16,70 | 18,31 | 17,60 | 17,32 | 17,29 | 29,12 | 19,39 | 194,90 | 100 | Healthy |
| 20 | QNB IND | 16,46 | 20,30 | 26,50 | 21,08 | 24,53 | 29,92 | 23,13 | 232,32 | 100 | Healthy |
| 21 | MAYAPADA | 13,34 | 14,11 | 15,82 | 16,18 | 15,54 | 14,37 | 14,89 | 149,93 | 100 | Healthy |
| 22 | DBS INDONESIA | 20,21 | 20,65 | 18,99 | 20,04 | 23,26 | 24,10 | 21,21 | 213,08 | 100 | Healthy |
| 23 | SHINHAN INDO | 85,28 | 67,85 | 38,62 | 31,31 | 30,18 | 29,91 | 47,19 | 472,92 | 100 | Healthy |
| Average | 22,15 | ||||||||||
Source: www.ojk.ac.id

Figure 4: Chart Car.
Analysis Regression
ROA = C + β CAR + ε
ROA = -1.49059410191 - 0.0194941299376*CAR + 0.067214
ROA = -1.49 - 0.0194 CAR + 0.067
ROA = - 2,2424
Analysis
For each increase in CAR by one unit, it will cause a decrease in ROA by -2.2424, meaning that if there is an increase in the CAR value, it will negatively affect the ROA value, that is, if the Capital Adequacy Ratio (KPMM) is below the minimum limit, it will have a negative effect on ROA. All banks according to Bank Indonesia standards are in the healthy category, namely CAR above 8% Table 17 and Figure 5.
Non-Performing Loan (NPL)
| Table 17 Non-Performing Loan (Npl) |
|||||||||||
|---|---|---|---|---|---|---|---|---|---|---|---|
| Credit Card | Non-Performing Loan (NPL) | NPL | Credit | Standard | |||||||
| No | Issuing Bank | 2016 | 2017 | 2018 | 2019 | 2020 | 2021 | AVG | Score | BI | Predicate |
| 1 | BRI | 1,09 | 0,88 | 0,92 | 1,04 | 0,80 | 0,70 | 0,91 | 97,30 | 100 | Healthy |
| 2 | MANDIRI | 1,38 | 1,06 | 0,67 | 0,84 | 0,43 | 0,41 | 0,80 | 98,01 | 100 | Healthy |
| 3 | BCA | 0,31 | 0,45 | 0,45 | 0,47 | 0,74 | 0,78 | 0,53 | 99,78 | 100 | Healthy |
| 4 | BNI 46 | 0,44 | 0,70 | 0,85 | 1,25 | 0,95 | 0,73 | 0,82 | 97,87 | 100 | Healthy |
| 5 | MAYBANK | 2,37 | 1,83 | 1,57 | 2,11 | 2,52 | 2,82 | 2,20 | 88,64 | 100 | Healthy |
| 6 | PANIN | 0,47 | 0,52 | 0,74 | 0,97 | 0,50 | 0,90 | 0,68 | 98,78 | 100 | Healthy |
| 7 | CIMB NIAGA | 2,19 | 2,17 | 0,02 | 0,01 | 1,42 | 1,17 | 1,16 | 95,58 | 100 | Healthy |
| 8 | DANAMON | 1,96 | 1,88 | 2,05 | 2,15 | 0,91 | 0,37 | 1,55 | 92,98 | 100 | Healthy |
| 9 | PERMATA | 2,24 | 1,67 | 1,73 | 1,34 | 1,04 | 0,69 | 1,45 | 93,66 | 100 | Healthy |
| 10 | MEGA | 2,59 | 1,41 | 1,27 | 2,25 | 1,07 | 0,81 | 1,57 | 92,89 | 100 | Healthy |
| 11 | CITI BANK | 0,94 | 0,54 | 0,52 | 0,45 | 0,42 | 0,46 | 0,56 | 99,63 | 100 | Healthy |
| 12 | UOB IND | 2,61 | 0,93 | 0,89 | 1,19 | 1,51 | 2,22 | 1,56 | 92,94 | 100 | Healthy |
| 13 | OCBC NISP | 0,77 | 0,72 | 0,82 | 0,78 | 0,79 | 0,91 | 0,80 | 98,01 | 100 | Healthy |
| 14 | HSBC IND | 3,90 | 1,70 | 1,22 | 1,22 | 0,94 | 0,79 | 1,63 | 92,48 | 100 | Healthy |
| 15 | STANDCHART | 1,44 | 1,11 | 0,49 | 0,98 | 0,43 | 0,48 | 0,82 | 97,86 | 100 | Healthy |
| 16 | ICBC IND | 2,09 | 2,06 | 2,47 | 1,77 | 2,88 | 2,53 | 2,30 | 88,00 | 100 | Healthy |
| 17 | KB BUKOPIN | 2,79 | 6,37 | 4,75 | 4,45 | 4,95 | 4,91 | 4,70 | 71,98 | 100 | Healthy |
| 18 | MNC | 2,38 | 2,82 | 3,43 | 3,57 | 3,63 | 2,81 | 3,11 | 82,62 | 100 | Healthy |
| 19 | SINAR MAS | 1,47 | 2,34 | 2,73 | 4,33 | 1,39 | 1,18 | 2,24 | 88,40 | 100 | Healthy |
| 20 | QNB IND | 2,94 | 1,14 | 1,47 | 4,45 | 1,21 | 0,04 | 1,88 | 90,83 | 100 | Healthy |
| 21 | MAYAPADA | 1,22 | 4,20 | 3,26 | 1,63 | 1,60 | 2,17 | 2,35 | 87,69 | 100 | Healthy |
| 22 | DBS INDONESIA | 1,62 | 0,98 | 0,94 | 1,04 | 1,32 | 0,77 | 1,11 | 95,92 | 100 | Healthy |
| 23 | SHINHAN INDO | 0,92 | 0,74 | 0,43 | 1,98 | 4,24 | 2,95 | 1,88 | 90,82 | 100 | Healthy |
| Average | 1,59 | ||||||||||
Source: www.ojk.ac.id

Figure 5: Chart NPL.
Analysis Regression
ROA = C + β NPL + ε
ROA = -1.49 - 0.58*NPL + 0.30
ROA = -1.49 - 0.58*NPL + 0.30
ROA = - 1,77
Analysis
For every one unit increase in NPL, it will cause a decrease in ROA of -1.77 meaning that if a loan with doubtful quality, substandard, and loss is used to measure conditions when the debtor cannot pay installments according to the previous agreement, it will increase by one unit, it will have a negative effect to the value of ROA. NPLs according to the Bank Indonesia category are all in a healthy predicate Table 18 and Figure 6.
Net Profit Margin (NPM)
| Table 18 Net Profit Margin (Npm) |
|||||||||||
|---|---|---|---|---|---|---|---|---|---|---|---|
| Credit Card | Net Profit Margin (NPM) | NPM | Credit | Standard | |||||||
| No | Issuing Bank | 2016 | 2017 | 2.018 | 2019 | 2020 | 2021 | AVG | Score | BI | Predicate |
| 1 | BRI | 77,05 | 78,75 | 77,71 | 79,07 | 70,03 | 81,69 | 77,38 | 77,38 | 81 | Not healthy |
| 2 | MANDIRI | 80,68 | 79,74 | 76,99 | 78,61 | 75,40 | 80,32 | 78,62 | 78,62 | 81 | Not healthy |
| 3 | BCA | 80,47 | 80,67 | 79,86 | 79,36 | 80,48 | 81,11 | 80,33 | 80,33 | 81 | Not healthy |
| 4 | BNI 46 | 80,73 | 80,57 | 78,26 | 79,55 | 63,13 | 86,53 | 78,13 | 78,13 | 81 | Not healthy |
| 5 | MAYBANK | 79,31 | 74,73 | 80,05 | 86,33 | 68,38 | 76,83 | 77,61 | 77,61 | 81 | Not healthy |
| 6 | PANIN | 77,38 | 76,55 | 72,17 | 77,95 | 76,98 | 78,85 | 76,65 | 76,65 | 81 | Not healthy |
| 7 | CIMB NIAGA | 74,98 | 72,62 | 73,17 | 74,19 | 67,46 | 80,47 | 73,82 | 73,82 | 81 | Not healthy |
| 8 | DANAMON | 65,64 | 84,96 | 87,34 | 155,18 | (390,39) | (913,82) | (151,85) | (151,85) | 81 | Not healthy |
| 9 | PERMATA | 75,11 | 94,81 | 102,79 | 78,62 | 45,28 | 86,90 | 80,59 | 80,59 | 81 | Not healthy |
| 10 | MEGA | 78,81 | 81,05 | 81,89 | 78,57 | 80,54 | 81,08 | 80,32 | 80,32 | 81 | Not healthy |
| 11 | CITI BANK | 95,26 | 93,90 | 111,97 | 94,16 | 75,70 | 79,47 | 91,74 | 91,74 | 81 | Healthy |
| 12 | UOB IND | 72,64 | 25,45 | 74,83 | 74,37 | 66,61 | 78,89 | 65,47 | 65,47 | 81 | Not healthy |
| 13 | OCBC NISP | 76,41 | 75,61 | 75,67 | 75,60 | 75,59 | 78,65 | 76,26 | 76,26 | 81 | Not healthy |
| 14 | HSBC IND | 82,23 | 89,88 | 72,92 | 77,63 | 74,18 | 80,07 | 79,49 | 79,49 | 81 | Not healthy |
| 15 | STANDCHART | 47,64 | 56,91 | 65,27 | 64,82 | 60,62 | 78,29 | 62,26 | 62,26 | 81 | Not healthy |
| 16 | ICBC IND | 77,23 | 79,88 | 27,62 | 26,91 | (228,24) | 84,42 | 11,30 | 11,30 | 81 | Not healthy |
| 17 | KB BUKOPIN | 78,88 | 118,95 | 137,45 | 257,71 | 82,20 | 73,97 | 124,86 | 124,86 | 81 | Healthy |
| 18 | MNC | 17,72 | 74,72 | 71,10 | 32,04 | 45,88 | 50,80 | 48,71 | 48,71 | 81 | Not healthy |
| 19 | SINAR MAS | 73,47 | 75,61 | 53,10 | (0,78) | (24,00) | 107,38 | 47,46 | 47,46 | 81 | Not healthy |
| 20 | QNB IND | 75,39 | 83,34 | 81,02 | 12,44 | 156,46 | 106,90 | 85,93 | 85,93 | 81 | Healthy |
| 21 | MAYAPADA | 78,92 | 74,83 | 72,79 | 73,89 | 60,33 | 50,91 | 68,61 | 68,61 | 81 | Not healthy |
| 22 | DBS INDONESIA | 83,35 | 77,64 | 11,53 | 45,44 | 196,65 | 70,08 | 80,78 | 80,78 | 81 | Not healthy |
| 23 | SHINHAN INDO | 76,20 | 73,12 | 78,97 | 70,69 | 122,66 | 73,67 | 82,55 | 82,55 | 81 | Healthy |
| Average | 64,22 | ||||||||||
Source: www.ojk.ac.id

Figure 6: Chart NPM.
Analysis Regression
ROA = C + β NPM + ε
ROA = -1.49 + 0.0017NPM + 0.0046
ROA = - 1,48
Analysis
For every one-unit NPM increase, it will cause a decrease in ROA of -1.48 meaning that if there is a bank's ability to generate net profit at a certain level of sales there is a decrease, it will have a negative effect on the value of ROA. NPM based on Bank Indonesia standards, there are only 4 categorized as healthy, the remaining 28 banks are unhealthy Table 19 and Figure 7.
Net Interest Margin (NIM)
| Table 19 Net Interest Margin (Nim) |
|||||||||||
|---|---|---|---|---|---|---|---|---|---|---|---|
| Credit Card | Net Interest Margin (NIM) | NIM | Credit | Standard | |||||||
| No | Issuing Bank | 2016 | 2017 | 2018 | 2019 | 2020 | 2021 | AVG | Score | BI | Predicate |
| 1 | BRI | 8,27 | 7,93 | 7,45 | 6,98 | 6,00 | 6,89 | 7,25 | 7,25 | 100 | Healthy |
| 2 | MANDIRI | 6,29 | 5,63 | 5,52 | 5,46 | 4,48 | 4,73 | 5,35 | 5,35 | 100 | No healthy |
| 3 | BCA | 6,81 | 6,19 | 6,13 | 6,24 | 5,70 | 5,10 | 6,03 | 6,03 | 100 | Healthy |
| 4 | BNI 46 | 6,17 | 5,50 | 5,29 | 4,92 | 4,50 | 4,67 | 5,18 | 5,18 | 100 | No healthy |
| 5 | MAYBANK | 4,59 | 4,49 | 4,35 | 4,14 | 3,79 | 3,95 | 4,22 | 4,22 | 100 | No healthy |
| 6 | PANIN | 4,94 | 4,49 | 4,61 | 4,63 | 4,46 | 4,88 | 4,67 | 4,67 | 100 | No healthy |
| 7 | CIMB NIAGA | 5,47 | 5,45 | 0,05 | 0,05 | 4,75 | 4,71 | 3,41 | 3,41 | 100 | No healthy |
| 8 | DANAMON | 7,36 | 7,03 | 6,22 | 5,31 | 5,02 | 5,19 | 6,02 | 6,02 | 100 | Healthy |
| 9 | PERMATA | 3,93 | 3,99 | 4,11 | 4,39 | 4,56 | 4,02 | 4,17 | 4,17 | 100 | No healthy |
| 10 | MEGA | 7,01 | 5,80 | 5,19 | 4,90 | 4,42 | 4,75 | 5,35 | 5,35 | 100 | No healthy |
| 11 | CITI BANK | 6,24 | 6,36 | 5,79 | 5,91 | 4,80 | 4,03 | 5,52 | 5,52 | 100 | No healthy |
| 12 | UOB IND | 4,30 | 3,85 | 3,79 | 3,65 | 3,82 | 3,81 | 3,87 | 3,87 | 100 | No healthy |
| 13 | OCBC NISP | 4,62 | 4,47 | 4,15 | 3,95 | 3,96 | 3,82 | 4,16 | 4,16 | 100 | No healthy |
| 14 | HSBC IND | 5,43 | 5,25 | 4,64 | 4,39 | 4,03 | 3,36 | 4,52 | 4,52 | 100 | No healthy |
| 15 | STANDCHART | 4,87 | 4,26 | 4,38 | 4,32 | 2,95 | 1,94 | 3,79 | 3,79 | 100 | No healthy |
| 16 | ICBC IND | 3,24 | 2,99 | 2,35 | 2,00 | 1,96 | 2,36 | 2,48 | 2,48 | 100 | No healthy |
| 17 | KB BUKOPIN | 3,88 | 2,89 | 2,83 | 2,08 | 0,61 | 1,25 | 2,26 | 2,26 | 100 | No healthy |
| 18 | MNC | 3,28 | 3,04 | 4,10 | 4,17 | 4,01 | 3,80 | 3,73 | 3,73 | 100 | No healthy |
| 19 | SINAR MAS | 6,44 | 6,46 | 7,61 | 7,31 | 6,25 | 5,79 | 6,64 | 6,64 | 100 | Healthy |
| 20 | QNB IND | 2,25 | 1,22 | 1,73 | 2,56 | 1,61 | 2,34 | 1,95 | 1,95 | 100 | No healthy |
| 21 | MAYAPADA | 5,16 | 4,26 | 4,09 | 3,61 | 0,47 | 0,69 | 3,05 | 3,05 | 100 | No healthy |
| 22 | DBS IND | 4,96 | 5,21 | 5,35 | 5,25 | 5,53 | 5,13 | 5,24 | 5,24 | 100 | No healthy |
| 23 | SHINHAN INDO | 5,05 | 5,31 | 4,47 | 3,32 | 2,42 | 2,32 | 3,82 | 3,82 | 100 | No healthy |
| Average | 4,46 | ||||||||||
Source: www.ojk.ac.id

Figure 7: Chart NIM.
Analysis Regression
ROA = C + β NIM +ε
ROA = -1.49 + 0.76NIM + 0.236
ROA = - 0,49
Analysis
For every increase in NIM by one unit, it will cause a decrease in ROA by -0.49, meaning that if there is a ratio between Net Interest Income and Average Earning Assets, it will increase by one unit, it will have a negative effect on the value of ROA Table 20 and Figure 8.
OER (Operating Expense Ratio)
| Table 20 Operating Expense Ratio (Oer) |
|||||||||||
|---|---|---|---|---|---|---|---|---|---|---|---|
| Credit Card | Operating Expense Ratio (OER) | OER | Credit | Standard | |||||||
| No | Issuing Bank | 2016 | 2017 | 2018 | 2019 | 2020 | 2021 | AVG | Score | BI | Predicate |
| 1 | BRI | 68,69 | 69,14 | 68,48 | 70,10 | 81,22 | 74,30 | 71,99 | 351,15 | 100 | Healthy |
| 2 | MANDIRI | 80,94 | 71,17 | 66,48 | 67,44 | 80,03 | 67,26 | 72,22 | 348,25 | 100 | Healthy |
| 3 | BCA | 60,44 | 58,65 | 58,24 | 59,09 | 63,45 | 54,15 | 59,00 | 513,46 | 100 | Healthy |
| 4 | BNI 46 | 73,59 | 70,99 | 70,15 | 73,16 | 93,31 | 81,18 | 77,06 | 287,71 | 100 | Healthy |
| 5 | MAYBANK | 85,81 | 86,97 | 83,85 | 89,28 | 88,98 | 84,94 | 86,64 | 168,02 | 100 | Healthy |
| 6 | PANIN | 82,87 | 78,79 | 75,54 | 77,04 | 76,50 | 78,60 | 78,22 | 273,21 | 100 | Healthy |
| 7 | CIMB NIAGA | 88,73 | 83,27 | 81,00 | 83,00 | 89,63 | 79,36 | 84,17 | 198,94 | 100 | Healthy |
| 8 | DANAMON | 77,25 | 70,85 | 72,11 | 82,71 | 86,62 | 88,87 | 79,74 | 254,31 | 100 | Healthy |
| 9 | PERMATA | 150,77 | 94,83 | 93,36 | 87,04 | 88,76 | 90,07 | 100,81 | (9,06) | 50 | Not Healthy |
| 10 | MEGA | 81,81 | 81,28 | 77,78 | 74,10 | 65,94 | 56,06 | 72,83 | 340,65 | 100 | Healthy |
| 11 | CITI BANK | 81,63 | 85,78 | 91,28 | 76,69 | 61,60 | 81,69 | 79,78 | 253,77 | 100 | Healthy |
| 12 | UOB IND | 95,90 | 97,81 | 97,08 | 97,06 | 92,26 | 90,19 | 95,05 | 62,88 | 65 | Unwell |
| 13 | OCBC NISP | 79,84 | 77,07 | 74,43 | 74,77 | 81,13 | 76,49 | 77,29 | 284,90 | 100 | Healthy |
| 14 | HSBC IND | 95,66 | 82,79 | 88,92 | 74,16 | 84,67 | 78,03 | 84,04 | 200,52 | 100 | Healthy |
| 15 | STANDCHART | 98,70 | 99,53 | 95,76 | 96,89 | 89,38 | 77,44 | 92,95 | 89,13 | 100 | Healthy |
| 16 | ICBC IND | 81,01 | 89,42 | 97,60 | 92,83 | 79,62 | 98,30 | 89,80 | 128,54 | 100 | Healthy |
| 17 | KB BUKOPIN | 94,36 | 99,04 | 98,41 | 98,98 | 168,10 | 171,23 | 121,69 | (270,08) | 50 | Not Healthy |
| 18 | MNC | 95,61 | 180,62 | 93,51 | 95,21 | 98,09 | 97,81 | 110,14 | (125,77) | 50 | Not Healthy |
| 19 | SINAR MAS | 86,23 | 88,94 | 97,62 | 119,43 | 111,70 | 97,12 | 100,17 | (1,17) | 50 | Not Healthy |
| 20 | QNB IND | 137,94 | 143,76 | 99,44 | 99,40 | 116,14 | 234,50 | 138,53 | (480,63) | 50 | Not Healthy |
| 21 | MAYAPADA | 83,08 | 87,20 | 92,61 | 92,16 | 98,41 | 98,83 | 92,05 | 100,40 | 100 | Healthy |
| 22 | DBS INDONESIA | 89,55 | 90,80 | 97,11 | 104,12 | 101,56 | 87,82 | 95,16 | 61,50 | 65 | Unwell |
| 23 | SHINHAN INDO | 92,67 | 72,77 | 76,06 | 93,80 | 92,27 | 87,93 | 85,92 | 177,04 | 100 | Healthy |
| Average | 88,92 | ||||||||||
Source: www.ojk.ac.id

Figure 8: Chart Operating Expense Ratio (OER).
Analysis Regression
ROA = C + β BOPO + ε
ROA = -1.49 - 0.0030BOPO + 0.00339
ROA = - 1,48
Analysis
For every increase in OER by one unit, it will cause a decrease in ROA by -0.49, meaning that if operational costs occur on operating income in one unit, it will have a negative effect on the value of ROA Table 21 & Figure 9.
| Table 21 Loan To Deposit Ratio (Ldr) |
|||||||||||
|---|---|---|---|---|---|---|---|---|---|---|---|
| Credit Card | Loan to Deposit Ratio (LDR) | LDR | Credit | Standard | |||||||
| No | Issuing Bank | 2016 | 2017 | 2018 | 2019 | 2020 | 2021 | AVG | Score | BI | Predicate |
| 1 | BRI | 87,77 | 88,13 | 89,57 | 88,64 | 83,66 | 83,67 | 86,91 | 113,37 | 100 | Healthy |
| 2 | MANDIRI | 85,86 | 88,11 | 96,74 | 96,37 | 82,95 | 80,04 | 88,35 | 107,62 | 100 | Healthy |
| 3 | BCA | 77,00 | 78,22 | 81,58 | 80,47 | 65,77 | 61,96 | 74,17 | 164,33 | 100 | Healthy |
| 4 | BNI 46 | 90,41 | 85,88 | 88,76 | 91,54 | 87,28 | 79,71 | 87,26 | 111,95 | 100 | Healthy |
| 5 | MAYBANK | 88,92 | 88,12 | 96,46 | 94,13 | 79,25 | 76,28 | 87,19 | 112,23 | 100 | Healthy |
| 6 | PANIN | 90,07 | 92,10 | 104,15 | 107,92 | 93,26 | 88,15 | 95,94 | 77,23 | 80 | Quite Healthy |
| 7 | CIMB NIAGA | 95,37 | 94,67 | 96,00 | 96,00 | 81,45 | 72,00 | 89,25 | 104,01 | 100 | Healthy |
| 8 | DANAMON | 91,00 | 94,95 | 93,29 | 98,85 | 84,56 | 83,96 | 91,10 | 96,59 | 100 | Healthy |
| 9 | PERMATA | 80,45 | 87,54 | 90,08 | 86,32 | 78,69 | 68,97 | 82,01 | 132,97 | 100 | Healthy |
| 10 | MEGA | 55,35 | 56,47 | 67,23 | 69,67 | 60,04 | 60,96 | 61,62 | 214,52 | 100 | Healthy |
| 11 | CITI BANK | 74,56 | 71,35 | 80,97 | 81,42 | 65,77 | 63,78 | 72,98 | 169,10 | 100 | Healthy |
| 12 | UOB IND | 90,11 | 83,57 | 93,04 | 90,92 | 76,87 | 74,78 | 84,88 | 121,47 | 100 | Healthy |
| 13 | OCBC NISP | 89,96 | 93,42 | 93,51 | 94,00 | 72,01 | 71,69 | 85,77 | 117,94 | 100 | Healthy |
| 14 | HSBC IND | 97,30 | 106,55 | 124,71 | 89,05 | 80,84 | 63,83 | 93,71 | 86,15 | 100 | Healthy |
| 15 | STANDCHART | 76,37 | 81,91 | 96,36 | 76,43 | 60,78 | 65,68 | 76,26 | 155,98 | 100 | Healthy |
| 16 | ICBC IND | 135,17 | 105,89 | 119,33 | 130,07 | 79,83 | 58,60 | 104,82 | 41,74 | 50 | Not healthy |
| 17 | KB BUKOPIN | 83,61 | 81,34 | 86,18 | 84,82 | 135,46 | 106,46 | 96,31 | 75,75 | 80 | Quite Healthy |
| 18 | MNC | 77,20 | 78,78 | 88,64 | 89,59 | 77,32 | 75,61 | 81,19 | 136,24 | 100 | Healthy |
| 19 | SINAR MAS | 77,47 | 80,57 | 84,24 | 81,95 | 56,97 | 41,22 | 70,40 | 179,39 | 100 | Healthy |
| 20 | QNB IND | 94,54 | 70,37 | 72,59 | 84,70 | 97,02 | 80,95 | 83,36 | 127,55 | 100 | Healthy |
| 21 | MAYAPADA | 91,40 | 90,08 | 91,83 | 93,34 | 77,80 | 71,65 | 86,02 | 116,93 | 100 | Healthy |
| 22 | DBS INDONESIA | 91,07 | 92,84 | 91,95 | 92,26 | 79,54 | 75,07 | 87,12 | 112,51 | 100 | Healthy |
| 23 | SHINHAN INDO | 108,21 | 240,22 | 295,76 | 237,49 | 188,56 | 160,21 | 205,08 | (359,30) | 50 | Not healthy |
| Average | 90,07 | ||||||||||
Source: www.ojk.ac.id

Figure 9: Chart LDR.
LDR (Loan to Deposit Ratio)
Analysis Regression
ROA = C + βLDR + ε
ROA = -1.49 + 0.0098LDR + 0.0160
ROA = - 1,376
Analysis
For every increase in LDR by one unit, it will cause a decrease in ROA by -1.376, meaning that if there is a composition of the amount of credit given compared to the amount of public funds and own capital, it will increase, it will have a negative effect on the value of ROA Table 22 & Figure 10.
| Table 22 Return On Assets (Roa) |
|||||||||||
|---|---|---|---|---|---|---|---|---|---|---|---|
| Credit card | Return on Assets (ROA) | ROA | Credit | Standard | |||||||
| No | Issuing Bank | 2016 | 2017 | 2018 | 2019 | 2020 | 2021 | AVG | Score | BI | Predicate |
| 1 | ICBC IND | 3,84 | 3,69 | 3,68 | 3,50 | 1,98 | 2,72 | 3,24 | 215,67 | 100 | Healthy |
| 2 | MANDIRI | 1,95 | 2,72 | 3,17 | 3,03 | 1,64 | 2,53 | 2,51 | 167,11 | 100 | Healthy |
| 3 | BCA | 3,93 | 3,89 | 4,01 | 4,02 | 3,32 | 3,41 | 3,76 | 250,89 | 100 | Healthy |
| 4 | BNI 46 | 2,69 | 2,75 | 2,78 | 2,42 | 0,54 | 1,43 | 2,10 | 140,11 | 100 | Healthy |
| 5 | MAYBANK | 1,48 | 1,23 | 1,48 | 1,09 | 0,82 | 1,00 | 1,18 | 78,89 | 80 | Quite Healthy |
| 6 | PANIN | 1,68 | 1,87 | 2,25 | 2,09 | 2,08 | 1,73 | 1,95 | 130,00 | 100 | Healthy |
| 7 | CIMB NIAGA | 1,19 | 1,67 | 0,02 | 0,02 | 0,99 | 1,75 | 0,94 | 62,67 | 65 | Unwell |
| 8 | DANAMON | 2,26 | 3,00 | 2,99 | 2,95 | 0,87 | 1,02 | 2,18 | 145,44 | 100 | Healthy |
| 9 | PERMATA | (4,89) | 0,61 | 0,78 | 1,30 | 0,97 | 0,73 | (0,08) | (5,56) | 50 | Not Healthy |
| 10 | MEGA | 2,36 | 2,24 | 2,47 | 2,90 | 3,64 | 4,22 | 2,97 | 198,11 | 100 | Healthy |
| 11 | CITI BANK | 4,14 | 4,34 | 3,22 | 4,67 | 3,91 | 1,56 | 3,64 | 242,67 | 100 | Healthy |
| 12 | UOB IND | 0,77 | 0,32 | 0,71 | 0,87 | 0,70 | 0,71 | 0,68 | 45,33 | 50 | Not Healthy |
| 13 | OCBC NISP | 1,85 | 1,96 | 2,10 | 2,22 | 1,47 | 1,55 | 1,86 | 123,89 | 100 | Healthy |
| 14 | HSBC IND | 0,47 | 1,78 | 1,13 | 2,72 | 1,56 | 1,53 | 1,53 | 102,11 | 100 | Healthy |
| 15 | STANDCHART | 0,58 | 0,32 | 1,26 | 0,70 | 1,82 | 0,63 | 0,89 | 59,00 | 65 | Unwell |
| 16 | ICBC IND | 1,61 | 0,83 | 0,28 | 0,22 | 0,05 | 0,96 | 0,66 | 43,89 | 50 | Not Healthy |
| 17 | KB BUKOPIN | 1,38 | 0,09 | 0,22 | 0,13 | (4,61) | (4,93) | (1,29) | (85,78) | 50 | Not Healthy |
| 18 | MNC | 0,11 | (7,47) | 0,74 | 0,27 | 0,15 | 0,18 | (1,00) | (66,89) | 50 | Not Healthy |
| 19 | SINAR MAS | 1,72 | 1,26 | 0,25 | 0,23 | 0,30 | 0,34 | 0,68 | 45,56 | 50 | Not Healthy |
| 20 | QNB IND | (3,37) | (3,72) | 0,12 | 0,02 | (1,24) | (8,50) | (2,78) | (185,44) | 50 | Not Healthy |
| 21 | MAYAPADA | 2,03 | 1,30 | 0,73 | 0,78 | 0,12 | 0,07 | 0,84 | 55,89 | 65 | Unwell |
| 22 | DBS IND | 1,30 | 1,02 | 0,05 | (0,28) | (0,20) | 0,95 | 0,47 | 31,56 | 50 | Not Healthy |
| 23 | SHINHAN INDO | 0,75 | 2,19 | 1,98 | 0,43 | 0,86 | 0,76 | 1,16 | 77,44 | 80 | Quite Healthy |
| Average | 1,22 | ||||||||||
Source: www.ojk.ac.id

Figure 10: Chart ROA.
Return on Asset (ROA)
In general, the average value of bank ROA is in a very healthy condition (SS), there are 4 banks which are in an unhealthy condition, namely; Permata Bank, KB Bukopin, MNC, QNB IND. There are 5 banks in Fairly Healthy condition (CS), namely: CMB NIAGA, UOB IND, STANDARHART, KBCIND, SINAR MAS, MAYAPADA. There are 2 banks in Healthy condition (S), namely: MAYBANK and SHINHAN INDO.
Analysis Regressin Multiple
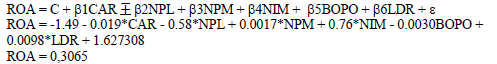
Analysis
Each increase in CAR, NPL, NPM, NIM, BOPO, LDR by one unit will cause an increase in ROA of 0.3065 or it means that if there is an increase in the bank's soundness ratio, it will have a positive effect on the increase in the value of ROA.
Camel Analysis
The soundness level of the bank as referred to in the ratio standard based on the provisions of Bank Indonesia with reference to the 5 criteria is produced as follows Table 23:
| Table 23 Average Bank Soundness Ratio With Camel Ratio In 2016 - 2021 |
||||||||||||||
|---|---|---|---|---|---|---|---|---|---|---|---|---|---|---|
| CRITERIA | CAR | NPL | NPM | NIM | OER | LDR | ROA | |||||||
| STD | RSH | STD | RSH | STD | RSH | STD | RSH | STD | RSH | STD | RSH | STD | RSH | |
| Very Healthy | 8,00 | 22,15 | 5,00 | 1,59 | 10,00 | 10,70 | 6,00 | 4,46 | 94,00 | 104,70 | 92,00 | 90,07 | X | X |
| Healthy | X | X | X | X | X | X | X | X | X | X | X | X | 1,50 | 1,22 |
| Healthy Enough | X | X | X | X | X | X | X | X | X | X | X | X | X | X |
| Un Healthy | X | X | X | X | X | X | X | X | X | X | X | X | X | X |
| Not Healthy | X | X | X | X | X | X | X | X | X | X | X | X | X | X |
In general, the CAR, NPL, NPM, NIM, BOPO ratios are in Very Healthy (SS) conditions by meeting the standards set by Bank Indonesia, except for the ROA ratio which is in Healthy (S) conditions.
Conclusion
1. The CAMEL ratio determined by PBI, based on the regression equation calculated from 2016 to 2021, it can be concluded that 32 credit card issuing banks received very healthy predicates for CAR, NPL, NPM, OER and LDR ratios. Except for ROA in a healthy predicate.
2. Partially from the CAMEL ratio, there are several ratios that have a negative effect on bank performance as measured by ROA, namely Capital (CAR), asset quality (NPL) and earnings as measured by (EOR). While management (NPM), earnings as measured by NIM and liquidity as measured by LDR have a positive effect on bank performance as measured by ROA.
3. Simultaneously all ratios namely Capital, Asset Quality, Management, earnings, and liquidity have a positive influence on the bank's performance fundamentally.
Suggestion
1. Given the weaknesses of the CAMEL ratio, namely (1) ratio management as measured by NPM and (2) Earnings measured by ROA and OER, it is hoped that there will be special attention for bank managers in order to increase income from main activities.
2. The ratio of Capital, Assets and Liquidity must be maintained or increased so that overall the CAMEL Ratio shows a positive influence on company value.
References
Abdurahman, A. (1999). Ensklipodia Ekonomi Keuangan lainnya, Jakarta, PT Gramedia Pustaka.
Adicondro, Y. (2015). Analisis Pengaruh Pertumbuha GDP, Tingkat Suku Bunga, Pertumbuhan Ekspor, Pertumbuhan Kredit dan BOPO Terhadap No Performing Loan pada Bank Umum di Indonesia Tahun 2010 – 2014 Universitas Diponegoro UNDIP.
Bank Indonesai, (2007). Peraturan Bank Indonesia No. 91/PBI/2007 reviews versi 8.
Bank Indonesia, (1998). Undang Undang No. 10 Tahun 1998 Tentang Perbankan.
Bank Indonesia, (2004). Aturan Bank Indonesia No 6/23/DPNP
Bank Indonesia, (2004). Peraturan bank Indonesia, No. 10/1/PBI/2004.
Bank Indonesia, (2004). Surat Edaran Diresi Bank Indonesia, No. 6/10/PBI/2004.
Bank Indonesia, (2011). Peraturan Bank Indonesia, No. 13/1/2011.
Bank Indonesia, (2011). Surat Edaran Bank Indonesia No 13/30/DPNP.
Bank Indonesia, (2013). Peraturan Bank Indonesia No 15/2/PBI/2013.
Bank Indonesia, (2013). Peraturan Bank Indonesia, No. 15/`5/PBI/2013.
Bank Indonesia, (2013). Surat Edaran Bank Indonesia, No. 13/24/DPNP.
Bank Indonesia, (2017). Peraturan Bank Indonesia, No 19/6/PBI/2017.
Iswi Hariyani, (2010). Restruturiasi dan Penghapusan Kredit Macet, Jakarta, PT Elex Media Komputindo.
Mudrajad, Kuncoro, & dan Suhardjono, (2011). Manajemen Perbankan, Yogyakarta, PFE Yogyakarta.
Riyad, S, (2006). Banking assets and Liability Management, edisi ke tiga, Jakarta FEUI.
Taswan, (2006). Manajemen Perbankan Konsep Teknik dan Aplikasi Banking Risk Assessment, Cetakan Pertama, UUP STIM YKPN, Yogyakarta.
Received: 14-Mar-2023, Manuscript No. AAFSJ-23-13332; Editor assigned: 16-Mar-2023, PreQC No. AAFSJ-23-13332(PQ); Reviewed: 30-Mar-2023, QC No. AAFSJ-23-13332; Revised: 13-Apr-2023, Manuscript No. AAFSJ-23-13332(R); Published: 20-Apr-2023