Research Article: 2018 Vol: 22 Issue: 4
Banking Sector Development, Stock Market Development and Economic Growth Evidence From Saudi Arabia
Mohammed Ziaur Rehman, College of Busines Administration
King Saud University, Saudi Arabia
Abstract
This research paper investigates the linkage between financial development and economic growth in Saudi Arabia from 1985 to 2016 by employing Vector Auto Regression (VAR). The financial development encompasses the banking sector development and the stock market development. Johansen co-integration test demonstrates that there is no long run co-integration among the selected variables. Results of VAR reports that there are few significant values of coefficients among the purported variables. The Granger causality test states that the economic growth measured by real GDP per capita and BSD measured by the ratio of Broad Money to GDP (M2 to GDP) exhibit bi-directional linkage. The SMD measured by the ratio of the stock market capitalization to GDP causes the BSD. Pertinent authorities in the Kingdom should buttress considerable set of financial reforms in sync with the global stipulations in order to drive forward the economic growth.
Keywords
Saudi Arabia, Financial Development, Economic Growth, VAR.
Introduction
The literature on economic growth reveals multifarious factors that drive the growth of economies. The variant rates of growth across the economies emerge on account of cross countries divergences in dynamics pertaining to macroeconomic firmness, financial development, administrative progress and global trade & investment. The central factor in propelling the economic growth has been manifested in the form of development of the financial sector. The financial sector accelerates the distribution of resources through the course of time. Studies have been carried out on the relationship between financial development and economic growth in numerous economies. The studies have incorporated multiple indicators of financial structure in order to gauge the financial development. It is revealed that the financial development can be gauged through the banking and stock market indicators. The developed economies have witnessed the development of the banking and non-banking financial segment, whereas the developing economies are restricted to the banking segment (Khan & Semlali, 2000).
The banking segment of Saudi Arabian economy is one of the most active areas in the Gulf region. Over the period of time, the regulator of the Saudi banking system, SAMA, has prudently managed the wavering phases of the banking system. The banking segment of Saudi economy manifests the traits of being well capitalized; profit- oriented and has maintained an adequate level of liquidity. The cited attributed are on account of ample financial reserves, prudential supervision at the macro level. Saudi banks were foremost in the Gulf region to apply the Basel norms. The adequate execution of Basel III norms, the framing of a macroprudential course, coverage of finance companies and the inclusion of international financial reporting standards are the notable advancements made in the banking arena. Further, the successful assessment program of the Saudi financial sector conducted separately by international financial bigwig institutions reveals the fulfillment of the global stipulations in the local financial sphere. For the last several years, the annual growth of banks has surpassed the growth in GDP. Further, there is no symptom of the bubble in asset prices and the contribution of bank credit to the business houses have considerably increased. It is revealed that the credit quality of the loans provided to consumers meets the required base. The ratio of the non-performing loan in the banking segment has been at a low level. The Saudi banks have strategically well managed the interest rate risk. Table 1 reveals the forte of Saudi Arabian economy in the arena of financial development and economic growth. Through the quinquennial data, it is manifested that the Saudi economy is well placed in comparison to the world average. Saudi economy has been progressing unwavering during the stipulated time. The prime reason for the success of the Saudi economy is on account of been blessed with nearly 15.7 percent of the global proven oil reserves and been aided from the high oil prices, leading to the fiscal surplus. The country’s significant segment of revenue is derived from oil sale. In line, the country is placed at the 20th largest economy on the global economic landscape.
| Table 1 STOCK MARKET CAPITALIZATION TO GDP (%) |
|||||
| Region | 1995 | 2000 | 2005 | 2010 | 2015 |
| Saudi Arabia | 28.57 | 33.76 | 144.11 | 63.91 | 70 |
| World | 18.46 | 28.12 | 34.03 | 35.11 | 55.23 |
| Broad money to GDP (%) | |||||
| Saudi Arabia | 44.97 | 44.33 | 44.6 | 55.16 | 73.5 |
| World | 98.01 | 103.7 | 96.2 | 109.52 | 120.9 |
| GDP per capita (US$) | |||||
| Saudi Arabia | 12482 | 13072 | 13126 | 13209 | 15218 |
| World | 6026 | 6657 | 7198 | 7587 | 8218 |
Source: World Bank
Of late, the global financial events witnessing the fall in the oil prices and the slowdown in global economic growth have made an adverse effect on the Saudi economy. In this very vein, the Kingdom brought a road map christened as Vision 2030, which has provided the requisite pedestal for the stock market to be in sync with the global benchmark. The Saudi Stock Exchange, Tadawul, is the largest equity exchange in the Middle East encompassing a market capitalization of about US$452 billion and the number of listed companies has increased to 176. Saudi Arabia market is now covered as a secondary emerging market by a leading global index. The forte of Saudi stock market can be evinced by the fact that the market capitalization to GDP was reported 70 percent in 2017.
In line to enhance the solidity of the capital market, the subject matter regarding the corporate governance is well taken. Moreover, CMA has brought governing system covering the risk aspect & compliance-centric and has unfolded the landscape of stock market to foreign players.
The selection of Saudi Arabia is on account of being a leading economy in the world and aims to diversify from the oil-based to more market-based economy. In line to paradigm shift towards the non-oil segments, it is pertinent to appreciate the nature of reforms entailed in order to escalate the pace of the Saudi economy. The purpose of the study is to know the nature of linkage between the financial developments with the economic growth and to explore which aspect of financial development in the manifestation of bank-centric or market centric is central to the economic growth in the Saudi economy. The current investigation aims to study the nature of causation among the bank-centric development, stock market-centric development and the economic growth in Saudi Arabia. Pragmatic studies on such an association for Saudi Arabia are limited; therefore it is significant to present study on the thematic theme.
The rest of the paper is organized as follows: Section two covers extant literature on the purported topic. Section three put forward the empirical methodology. Section four encompasses the conclusion.
Review of Literature on the Financial Development and Economic Growth
Financial Development and Economic Growth
Seminal works are conducted on the theme of financial development and economic growth (Schumpeter, 1911; Gurley & Shaw, 1955; Goldsmith, 1969; Hicks, 1969). These studies have revealed the central role of financial development on economic growth. In the same vein, later on, multiples studies on the purported theme reiterate the contribution of financial development on the economic growth of the economies (King & Levine, 1993; Demirguc-Kunt & Maksimovic, 1998; Levine & Zervos, 1998). The linkage between the financial development and economic growth can be investigated on the basis of bank-based system and market-based system. The bank-based views aim to focus on the favorable support of banks in garnering capital, locating financial venture, overseeing the executives and handling the risk level. Banks can persuade the firms to share the facts and pay the obligations. Likewise, the banks are better placed in offering funds to contemporary projects. Rajan & Zingales (1998) unearth that improved financial channels and the financial markets assist in lessening the resistance of the market, reduce the cost of firm broadening and facilitate the entrance of new firms. The literature on financial development and economic growth can be grouped in three domains. These are acknowledged as finance-led growth (supply leading approach), growth led finance (demand following approach) and the feedback (bi-directional approach) hypothesis. Studies have corroborated the supply leading perspective, with causation running from the financial development to the economic growth, reiterating the role of financial development in driving the growth in the economies. Rousseau & Vuthipadadorn (2005) through the employment of vector autoregressive models (VARs) and vector error correction models (VECMs) highlight the role of financial intermediation in ten Asian economies from 1950 to 2000.Likewise, Hsueh, Hu & Tu (2013) substantiate the supply leading perspective, focusing that many financial development variables drive economic growth in the selected Asian economies. Selected studies covering the linkage between financial development and economic growth encompassing the emerging economies are incorporated. Nasir, Majeed & Aleem (2018) investigate the linkage between financial development and economic growth for three emerging Asian economies from 1976 to 2015. The study reveals that financial development leads to economic growth for Korea and Thailand. Rafindadi & Aliyu (2017) through the ARDL bounds testing approach to cointegration, examine the linkage between economic growth and financial development in Ghana. The study reports that financial development has a robust favorable influence to the Ghanaian GDP. Amin & Hossain (2017) manifest the causal linkage between economic growth and financial development in Bangladesh from 1985 to 2014. Ghildiyal, Pokhriyal & Mohan (2015) through the Autoregressive Distributed Lag (ARDL) Bound testing approach reveal long run and short run linkage between financial deepening and economic growth in Indian economy. Olayiwola, Okodua & Osabuohien (2014) highlight the importance of access to financial services in enhancing the economic growth of Nigerian economy.
In a similar way, there are studies reporting the demand following perspective, revealing the strength of economic growth in promoting the financial development. Zang & Kim (2007) through the medium of panel data investigated seventy-four economies from 1961 to 1995. With multiples bank-based indicators, the study demonstrated that economic growth is prerequisite for the financial development of the economies. Shan & Morris (2002) through the employment of Toda and Yamamoto causality tools on the data of nineteen OECD countries and China revealed the presence of causation running from economic growth to financial development for five economies. Selected studies on bank-centric financial development and economic growth revealing two-sided causation are incorporated. Demetriades & Hussein (1996) reveal the substantial indication of bi-directionality and a certain mark of reverse causation in the selected variables. By the use of multivariate vector auto-regression (VAR) structure on ten selected economies, Luintel & Khan (1999) revealed the mutual linkage between the stipulated variables. Rachdi & Mbarek (2011) by the use of panel data cointegration and GMM technique in ten selected economies, six from OECD domain and four countries from the MENA arena from 1990 to 2006 manifested two-way causality between financial development and economic growth.
In line to the studies on bank-centric financial development and economic growth, the literature on the linkage between the market-based structure and economic growth can be wellorganized into stock market led growth (supply leading way), growth led stock market (demand following way) and the feedback (bi-directional way). Levine & Zervos (1996) unearth that stock market development is favourably linked with long-run growth through the usage of a pooled cross-country time series covering forty-one countries over the period 1976-1993. Demirguc- Kunt & Levine (1996) formed an aggregated index of stock market development by the way of amalgamating the data on stock market size, liquidity and linkages with the international market. The study revealed that the stock market development has the substantial positive relationship with long-run economic growth. In a similar study, Demirguc-Kunt & Levine (1996) accumulates and relates a comprehensive range of indicators of the stock market and financial intermediary development, by data from forty-four developing and industrial economies from 1986 to 1993. In line, the study presents stylized facts that assist and motivates investigation into the association of the purported variables.
The supply-leading hypothesis advocates that market-based financial structure is instrumental in driving the economic growth. Atje & Jovanovic (1993) through a panel data of seventy-two economies covering the time period from 1980 to 1988 reveal that the stock market has a positive result on the economic growth. Caporale, Howells & Soliman (2005) utilizing the VARs tools reveal that the stock market causes the growth. Adjasi & Biekpe (2006) report favourable linkage between the stock market and economic growth in fourteen African economies through panel data structure. Naik & Padhi (2015) through a panel data of twentyseven emerging economies spanning from 1995 to 2012 manifest that certain indicators of stock market stimulate the pace of economic growth, thereby indicating unidirectional causal running from stock market to economic growth. There are selected studies highlighting the role of economic growth in accelerating the stock market development (demand following). El-Wassal (2005) through the usage of two stages least square combined with fixed effect tools discloses that economic growth and other selected variables are leading factors for the growth of the stock market in forty emerging economies from 1980 to 2000. There are studies incorporating panel data covering multiples countries to substantiate the occurrence of two-way causality between the stock market centred structure and the economic growth. Enisan & Olufisayo (2009) through ARDL bounds test and Granger causality test attached to VAR testify two-way causation linkages for four out of seven economies in the sub-Saharan African region. Masoud & Hardaker (2012) through the utility of endogenous model present the two-way causation between the stock market and economic growth for forty-two emerging markets for twelve years.
Financial Development (Banks &Stock Market) and Economic growth
Rabiul (2010) with the application of Generalized Method of Moments (GMM) - dynamic panel study, manifested that the banks and stock markets are central to stimulate the long duration growth in the eighty developing countries over the period 1973-2002. It is revealed that the positive effect of stipulated variables on economic growth is more tilted toward the poor economies than the developed economies owing to the decline in marginal returns. Pradhan et al., (2014) highlight the importance of the developed financial sector in the promotion of economic growth. Through the employment of multiple econometric tools on banking arena, the stock market and four facets of the economy, covering thirty five Asian economies from 1960 to 2011, the study reveals that there is bidirectional relationship between banking and stock market for most of the economies. Cavenaile, Gengenbach, & Palm (2014) provide the importance of financial development for economic development. Rioja & Valev (2014) envelope the Generalized Method of Moments (GMM) techniques to examine the impact of stock markets and banks on the economic growth of sixty two economies from 1980 to 2009. The study reveals that in low income economies, the banks have revealed considerable favorable influence on capital accumulation, though the role of stock markets in stimulating the growth has been dismal. Contrariwise, the study reports that the stock markets have been supporting the growth in the rich economies. Levine & Zervos (1998) in a seminal endeavor disclose the robustness of stock market and banking development in stimulating favorably the growth of the forty seven economies over the sample period 1976 to 1993. The study unfolds that the banks and stock markets serve unique financial services to the economic growth. Further, there is no evidence for the assertion that the manifestation of stock markets facets can stymie the long run growth. In sum, the paper advocates that the financial components are the instrument in the economic growth. Beck & Levine (2004) revealed that financial markets in the manifestation of stock market and banks are instrumental to accelerate the resource allocation and the growth in forty economies from 1976 to 1998. Hamdi, Sbia & Tas (2014) manifest the importance of financial development in enhancing the economic growth in the six Gulf countries from 1980 to 2012. The study underlines for the development of the financial sector so as to lessen the reliance of GCC economies on the oil sector. Naceur & Ghazouani (2007) incorporated eleven economies to inspect the linkage between stock market & banks and economic growth in MENA region from 1979 to 2003.Through the employment of GMM tool, the study revealed lack of linkage between the purported variables, thereby, the set of reforms are entailed by the paper, so that the financial development stimulates the growth of the region. Chakraborty & Ray (2006) highlight that market or bank arranged system proffers their respective benefit to the economies. The selection of the purported system hinges on firm financing alternatives and the growth is centrally dependent on the competency of the legal structure in promoting the financial sector. Rajabi & Muhammad (2014) investigate the linkage between the stock market & banking development and economic growth in a panel setting covering ten Asian Islamic economies from 1990 to 2009. The study report that the advancement of both banks and stock markets employs a substantial influence on the economic growth of the selected economies. Lee (2012) through different sample time period for individual country revealed the substantial role of stock market in financing the economic growth in the US, UK and Japan, whilst the banking sector functioned an instrumental part in Germany, France and Korea. Through the incisive study for all the stipulated economies, it is manifested that banking sector played a crucial role in the initial period of economic growth. Further, the study states that the banking and stock market in unison, contribute to the economic growth of the economies.
Selected studies are incorporated covering the financial development and economic growth in the Saudi economy. Samargandi, Fidrmuc & Ghosh (2014) through the ARLD tool, exhibit that financial development has the favourable role on the non-oil segment of the Saudi economy. The study reveals a weak linkage between financial development and growth of oil segment and GDP. Masoud & Hardaker (2014) through the usage of GMM tools bring to light that the stock market and the banking sector are instrumental in enhancing the firm’s growth in the Saudi economy from 1995 to 2013. Further, the study explains that firms utilizing equity financing develop faster than those groups that are not employing the purported source of the financing. Masih, Al-Elg, & Madani (2009) through the error correction and variance decompositions tool demonstrate that there is one-way causality running from financial development to economic growth in the Saudi economy. Mahran, (2012) explores the linkage between economic growth and financial intermediation for Saudi Arabia from 1968 to 2010. Through the (ARDL) methods to cointegration and the associated error correction model (ECM), the study reports that financial intermediation has influenced undesirably on long-run real GDP. Alghfais (2016) carried out the ARDL model in highlighting the considerable influence of financial sector development on the total economic growth of the non-oil sector and of the nonoil public & private sector in Saudi Arabia.
Data and Methodology
The paper makes an endeavour to gauge the linkage among the banking sector development, stock market development and economic growth in the Saudi economy. The data collected are the annual observations encompassing the period from 1985 to 2016. Data are culled from the World Bank and Saudi Arabian monetary agency database. Economic growth is represented by real GDP per capita, the banking sector development is represented by the ratio of Broad Money to GDP (M2 to GDP) and stock market development is represented by the ratio of the stock market capitalization to GDP.
Model Specification
The fundamental model presenting the linkage among the banking sector development, stock market development and economic growth can be displayed as:
EGt =f(BSDt,SMDt)
The log-linear econometric form can be brought in the following arrangement.
ln(EGt) =ß? +ß1ln (BSDt) +ß2 ln(SMDt) +?t
In order to examine the linkage among the purported variables, first of all, the unit root test is conducted to check for stationary attributes of the data, then the formulation of the three variables VAR model is done, in sequence, the Johansen cointegration test is carried out to check the presence of cointegration. Subsequently, to identify the casual relationship, the Granger causality test is conducted. Further, the dynamic performance of VAR model is investigated through the impulse response function and variance decomposition.
Unit Root test
A series is known to be stationary with a constant mean, constant variance and constant autocovariances at a provided lag. In order to check the stationary attributes of the time series data, a unit root test is done through the Augmented Dickey & Fuller (ADF) test and the Phillips & Perron (PP) approach. In line to ADF, PP test applies the non-parametric statistical approach to consider the issue of serial correlation in the error term sans summing the lagged difference terms. Tables (2 & 3) reveal the unit root test, managed through the Augmented Dickey Fuller (ADF) test and the Phillips & Perron (PP) test. Through the tables, it is revealed that at the first difference, the t statistics is greater than the critical value, revealing the rejection of the null hypothesis. Accordingly the stipulated variables are non-stationary at the level but at the first difference, the series of variables are stationary in nature. Thus, the variables are integrated of order one 1(1).
| Table 2 UNIT ROOT TEST (ADF) FOR THE SELECTED VARIABLES |
||||||||
| At level | At first difference | |||||||
| With constant | With constant linear trend | Constant | With constant linear trend | |||||
| t-stat | C-value | t-stat | C-value | t-stat | C-value | t-stat | C-value | |
| EG | -2.114623 | -3.661661 | -2.790071 | -4.284580 | -7.230896 | -3.670170 | -7.096031 | -4.296729 |
| BSD | -1.655579 | -3.661661 | -2.529422 | -4.284580 | -6.095563 | -3.670170 | -6.238561 | -4.296729 |
| SMD | -2.111079 | -3.661661 | -2.674013 | -4.284580 | -7.585404 | -3.670170 | -7.526869 | -4.296729 |
*Indicates statistical significance at 1%
| Table 3 UNIT ROOT TEST (PP) FOR THE SELECTED VARIABLES |
||||||||
| At level | At first difference | |||||||
| With constant | With constant linear trend | Constant | With constant linear trend | |||||
| t-stat | C-value | t-stat | C-value | t-stat | C-value | t-stat | C-value | |
| EG | -2.085945 | -3.661661 | -2.788660 | -4.284580 | -7.146970 | -3.670170 | -7.013875 | -4.296729 |
| BSD | -1.655579 | -3.661661 | -2.529422 | -4.284580 | -6.720473 | -3.670170 | -15.19036 | -4.296729 |
| SMD | -2.025775 | -3.661661 | -2.569602 | -4.284580 | -7.494626 | -3.670170 | -7.549217 | -4.296729 |
*Indicates statistical significance at 1%
Lag length
The preliminary task in estimating the VAR model is to define the optimum order of lag length. It is pertinent as under parameterization and over parameterization may lessen the utility of the model. For the study, the lag order length selection criteria are applied. From the Table 4, the AIC criterion is taken on account of superior attributes; the corresponding lag is lag order 2.
| Table 4 VAR LAG ORDER SELECTION CRITERIA |
||||||
| Lag | LogL | LR | FPE | AIC | SC | HQ |
| 0 | 32.55547 | NA | 2.61e-05 | -2.038308 | -1.896864 | -1.994010 |
| 1 | 75.48108 | 74.00967 | 2.53e-06 | -4.378006 | -3.812228* | -4.200811 |
| 2 | 87.33923 | 17.99167* | 2.13e-06* | -4.575119* | -3.585008 | -4.265029* |
| 3 | 94.27277 | 9.085334 | 2.61e-06 | -4.432605 | -3.018161 | -3.989619 |
* Indicates lag order selected by the criterion
LR: sequential modified LR test statistic (each test at 5% level) FPE: Final Prediction Error AIC: Akaike Information Cri.
SC: Schwarz Information Cri. HQ: Hannan-Quinn Information Cri.
Cointegration Test
As the unit root test reveals that the selected variables manifest the I (1), the cointegration test is conducted. Johansen test is a multivariate co-integration method, which covers trace and maximum eigenvalue statistical tests to investigate the cointegrating linkage for three variables stipulated in the current study. From the Table 5, it is evinced that the trace test and max eigen values are lower than the critical values and the corresponding p values are also insignificant. Thus the result reports that there is no cointegrating linkage among the variables. The lack of cointegration leads to usage of vector auto regressive (VAR) approach.
| Table 5 TRACE TEST |
||||||||
| Unrestricted cointegration rank test (Trace) | Unrestricted cointegration rank test (Maximum Eigen value) | |||||||
| Hypothesized No. of CE(s) |
Eigen value | Trace Statistic |
0.05 Critical Value |
Prob.** | Eigen value | Max-Eigen Statistic |
0.05 Critical Value |
Prob.** |
| None | 0.407202 | 22.89959 | 29.79707 | 0.2510 | 0.40720 | 15.16414 | 21.13162 | 0.2776 |
| At most 1 | 0.225730 | 7.735441 | 15.49471 | 0.4941 | 0.22573 | 7.419215 | 14.26460 | 0.4408 |
| At most 2 | 0.010845 | 0.316227 | 3.841466 | 0.5739 | 0.01084 | 0.316227 | 3.841466 | 0.5739 |
Max-Eigenvalue test indicates no cointegration at the 0.05 level
* Denotes rejection of the hypothesis at the 0.05 level
**MacKinnon-Haug-Michelis (1999) p-values
Unrestricted Vector Auto-Regression (VAR)
VAR are flexible models for multivariate time series. On account of the dynamic attributes of a VAR (P), the analysis encompasses Granger causality tests, the impulse response functions and the forecast error variance decompositions. The VAR can be examined through the equation method like the OLS. In the VAR model, the variables are considered endogenous, thereby leading to the formation of a separate equation for the particular variable. The assessment of the variable is exhibited as a linear function of the past lags of itself and the past lags value of the added variables in the purported model. The reduced form is manifested in the following form VAR (1). Table 6 exhibits the vector auto regression estimates for the variables covered in the study.
| Table 6 VECTOR AUTOREGRESSION ESTIMATES |
|||
| Standard errors in ( ) & t-statistics in [ ] | |||
| EG | BSD | SMD | |
| EG(-1) | 0.604429 | 0.496540 | 1.420914 |
| (0.15411) | (0.34797) | (1.26075) | |
| [ 3.92200] | [ 1.42696] | [ 1.12704] | |
| EG(-2) | 0.250804 | -0.029594 | -2.391791 |
| (0.15383) | (0.34734) | (1.25847) | |
| [ 1.63036] | [-0.08520] | [-1.90056] | |
| BSD(-1) | -0.143054 | 0.903509 | 0.745388 |
| (0.07694) | (0.17372) | (0.62940) | |
| [-1.85937] | [ 5.20110] | [ 1.18429] | |
| BSD(-2) | 0.336601 | -0.130158 | -0.191433 |
| (0.08650) | (0.19531) | (0.70765) | |
| [ 3.89122] | [-0.66641] | [-0.27052] | |
| SMD(-1) | 0.030422 | -0.116444 | 0.498488 |
| (0.02296) | (0.05183) | (0.18780) | |
| [ 1.32517] | [-2.24648] | [ 2.65431] | |
| SMD(-2) | -0.028445 | 0.116229 | 0.348535 |
| (0.02344) | (0.05292) | (0.19176) | |
| [-1.21352] | [ 2.19611] | [ 1.81760] | |
| C | 0.866850 | -4.310173 | 9.285126 |
| (1.30842) | (2.95428) | (10.7038) | |
| [ 0.66251] | [-1.45896] | [ 0.86746] | |
| R-squared | 0.813488 | 0.703219 | 0.705925 |
| Adj. R-squared | 0.764833 | 0.625798 | 0.629210 |
| F-statistic | 16.71943 | 9.083037 | 9.201881 |
EGt,1 = α1 +φ11EGt−1,1 + φ12BSDt−1,2 + φ13SMDt−1,3 + wt,1
BSDt,2 = α2 +φ21FDIt−1,1 + φ22EGt−1,2 + φ23SMDt−1,3+ wt,2
SMDt,3 = α3 +φ31SMDt−1,1 + φ32EGt−1,2 + φ33BSDt−1,3 + wt,3
Given below are the equations covering the lagged values of the purported indicators as the dependent variables.
EG = 0.604429*EG(-1) + 0.250804*EG(-2) + -0.143054*BSD(-1) + 0.336601*BSD(-2) + 0.030422*SMD(-1) + -0.028445*SMD(-2) + 0.866850
BSD = 0.496540*EG(-1) + -0.029594*EG(-2) + 0.903509*BSD(-1) + -0.130158*BSD(-2) + - 0.116444*SMD(-1) + 0.116229*SMD(-2) + C(14)
SMD = 1.420914*EG(-1) + -2.391791*EG(-2) + 0.745388*BSD(-1) + -0.191433*BSD(-2) + 0.498488*SMD(-1) + 0.348535*SMD(-2) + C(21)
The Table 7 below shows results of VAR where there are few significant values of coefficients which suggest that there can be an association among the variables. Explicitly the values of coefficients of economic growth are significant for C (1) and C (4), while it is significant in the case of BSD for C (10) and C (13) and for SMD it is significant for C (19).
| Table 7 TOTAL SYSTEM (BALANCED) OBSERVATIONS 90 |
||||
| Coefficient | Std. Error | t-Statistic | Prob. | |
| C(1) | 0.604429 | 0.154112 | 3.921998 | 0.0002 |
| C(2) | 0.250804 | 0.153833 | 1.630362 | 0.1076 |
| C(3) | -0.143054 | 0.076937 | -1.859372 | 0.0672 |
| C(4) | 0.336601 | 0.086503 | 3.891224 | 0.0002 |
| C(5) | 0.030422 | 0.022957 | 1.325171 | 0.1895 |
| C(6) | -0.028445 | 0.023440 | -1.213521 | 0.2291 |
| C(7) | 0.866850 | 1.308423 | 0.662515 | 0.5098 |
| C(8) | 0.496540 | 0.347970 | 1.426963 | 0.1581 |
| C(9) | -0.029594 | 0.347339 | -0.085203 | 0.9323 |
| C(10) | 0.903509 | 0.173715 | 5.201097 | 0.0000 |
| C(11) | -0.130158 | 0.195314 | -0.666407 | 0.5074 |
| C(12) | -0.116444 | 0.051834 | -2.246479 | 0.0279 |
| C(13) | 0.116229 | 0.052925 | 2.196111 | 0.0314 |
| C(14) | -4.310173 | 2.954282 | -1.458958 | 0.1491 |
| C(15) | 1.420914 | 1.260750 | 1.127039 | 0.2636 |
| C(16) | -2.391791 | 1.258466 | -1.900560 | 0.0615 |
| C(17) | 0.745388 | 0.629398 | 1.184287 | 0.2404 |
| C(18) | -0.191433 | 0.707652 | -0.270518 | 0.7876 |
| C(19) | 0.498488 | 0.187803 | 2.654306 | 0.0099 |
| C(20) | 0.348535 | 0.191756 | 1.817599 | 0.0735 |
| C(21) | 9.285127 | 10.70384 | 0.867458 | 0.3887 |
Granger Causality Test
In order to investigate the direction of causality among the selected variables, the Granger causality test is applied. Table 8 reports the following significant information. The economic growth measured by real GDP per capita and BSD measured by the ratio of Broad Money to GDP (M2 to GDP) exhibit bi- directional linkage where both can cause each other at ten percent level of significance. Further SMD measured by the ratio of the stock market capitalization to GDP causes the BSD, where the route of direction is from SMD to BSD.
| Table 8 PAIRWISE GRANGER CAUSALITY TESTS |
|||
| Null Hypothesis: | Obs. | F-Statistic | Prob. |
| BSD does not Granger cause EG | 30 | 8.37416 | 0.0016 |
| EG does not Granger cause BSD | 3.03956 | 0.0658 | |
| SMD does not Granger cause EG | 30 | 1.03818 | 0.3689 |
| EG does not Granger cause SMD | 1.35949 | 0.2751 | |
| SMD does not Granger cause BSD | 30 | 4.24092 | 0.0259 |
| BSD does not Granger cause SMD | 0.30632 | 0.7389 | |
Impulse Response Function
Impulse response functions are pertinent for investigating the interplay among the selected variables in a VAR environment. In the purported function, it presents one period standard deviation shock to the endogenous item. It provides the response of one variable to an impulse in another item in a model that encompasses multiples other items. Following 3×3 graphs are presented to reveal the result of the impulse response on the selected variables. Figure 1 presents the impulse response functions, wherein the response of each variable and the influence of the other variables of the VAR model are illustrated. Through the graphs, it is revealed that the response of EG to the one standard deviation shock to itself and BSD is both positive and negative at times. The response of BSD to EG and itself is oscillating. The impulse response of the SMD to BSD and itself is wavering in nature. Further, unwavering responses are revealed in the case of EG to SMD, BSD to SMD and SMD to EG.

Figure 1: Impulse Response Functions
Variance Decomposition Method
Tables 9, 10 & 11 pertain to the variance decomposition of EG, BSD and SMD. It calibrates and investigates the variance of the forecast error for the individual variable into the portions. Every selected variable is illustrated as a linear amalgam of it owns current innovation and the past innovations of the chosen variables in the model. The forecast horizon covered is ten period. From the Table 9, focusing on the tenth period, 57.76 percent of the economic growth is explained by the effects of BSD, while 40.45 percent portion of the economic growth is led by its own innovative shocks. It is revealed from Table 10 that BSD is the central factor in explaining its own variation. Through the Table 11, it is revealed that the share of economic growth to the stock market is 2.93 percent and 27.85 on account of banking sector development. It is also reported that 69.20 percent portion of the stock market development is presented by its own innovations.
| Tables 9 VARIANCE DECOMPOSITION OF THE THREE VARIABLES |
||||
| Period | S.E. | EG | BSD | SMD |
| 1 | 0.039563 | 100.0000 | 0.000000 | 0.000000 |
| 2 | 0.051257 | 91.98467 | 4.538119 | 3.477215 |
| 3 | 0.057488 | 86.79726 | 9.023428 | 4.179315 |
| 4 | 0.063773 | 75.45886 | 20.84136 | 3.699778 |
| 5 | 0.071178 | 63.65179 | 32.99866 | 3.349554 |
| 6 | 0.079263 | 55.00285 | 41.83349 | 3.163655 |
| 7 | 0.087207 | 49.74966 | 47.42119 | 2.829145 |
| 8 | 0.095718 | 46.04661 | 51.51027 | 2.443117 |
| 9 | 0.104935 | 43.07767 | 54.83063 | 2.091703 |
| 10 | 0.115047 | 40.45117 | 57.76503 | 1.783800 |
| Tables 10 VARIANCE DECOMPOSITION OF THE THREE VARIABLES |
||||
| Period | S.E. | EG | BSD | SMD |
| 1 | 0.089329 | 6.942953 | 93.05705 | 0.000000 |
| 2 | 0.121032 | 4.321834 | 86.54120 | 9.136965 |
| 3 | 0.129405 | 4.114496 | 87.29211 | 8.593390 |
| 4 | 0.137302 | 7.122696 | 85.18859 | 7.688710 |
| 5 | 0.144408 | 10.62122 | 82.41286 | 6.965919 |
| 6 | 0.153155 | 13.32623 | 80.44562 | 6.228156 |
| 7 | 0.163321 | 15.05523 | 79.46780 | 5.476969 |
| 8 | 0.174875 | 16.20699 | 79.01242 | 4.780590 |
| 9 | 0.187799 | 17.18715 | 78.65776 | 4.155088 |
| 10 | 0.201932 | 18.14417 | 78.25307 | 3.602760 |
| Tables 11 VARIANCE DECOMPOSITION OF THE THREE VARIABLES |
||||
| Period | S.E. | EG | BSD | SMD |
| 1 | 0.323654 | 3.721224 | 2.045276 | 94.23350 |
| 2 | 0.376529 | 6.185345 | 6.887481 | 86.92717 |
| 3 | 0.422706 | 4.908662 | 9.196717 | 85.89462 |
| 4 | 0.461860 | 4.137054 | 16.27547 | 79.58747 |
| 5 | 0.487613 | 3.823667 | 20.36362 | 75.81272 |
| 6 | 0.509359 | 3.540407 | 23.15396 | 73.30563 |
| 7 | 0.525733 | 3.324707 | 24.93418 | 71.74111 |
| 8 | 0.539206 | 3.161401 | 26.07790 | 70.76070 |
| 9 | 0.550562 | 3.036478 | 27.02804 | 69.93548 |
| 10 | 0.560121 | 2.938436 | 27.85304 | 69.20853 |
The robustness check of the model is revealed through the diagnostic tests covered in the Table 12. The Jarque Bera statistic is 1.9759 and the corresponding p-value is .3723. On account of the p value showing more than 5 percent, it reveals the normality of the residuals. Likewise, through the other tests covered in the table, it is cogently manifested that the underlying model gets the approval through the diagnostic tests. Further to gauge the structural stability of the model, the plots of cumulative sum (CUSUM) and the cumulative sum of square (CUSUMSQ) are covered in figure 2, it unfolds the evidence of the parameter strength as the plots are within the critical bounds at 5 % level of significance.
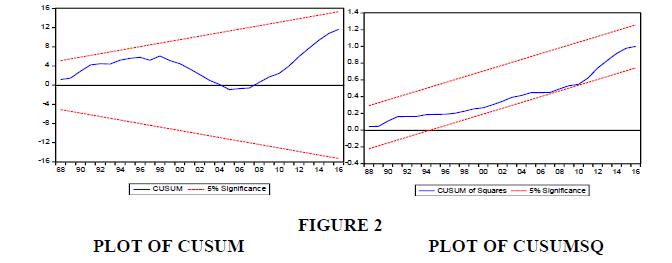
Figure 2: Plot of Cusum Plot of Cusumsq
| Table 12 DIAGNOSTIC TESTS |
||||
| Normality | LM | White | ARCH | REMSEY RESET |
| 1.9759 (.3723) | 1.37045(0.5040) | 3.6065(.6073) | 1.99( 0.3689 ) | 0.98 (0.3295) |
Conclusion
This research is an attempt to investigate the link between financial development and economic growth in Saudi Arabia. The study delves into the financial development through the banking sector development and stock market development. The study covers the period from 1985 to 2016. The Johansen co-integration test illustrates that no long run co-integration can be recognized among banking sector development, stock market development and economic growth. Results of VAR reports that there are few significant values of coefficients which recommend that there can be a relationship among the selected variables. The Granger causality test reveals that the economic growth measured by real GDP per capita and BSD measured by the ratio of Broad Money to GDP (M2 to GDP) exhibit bi-directional relationship where both can cause each other at ten percent level of significance. The bigwig’s economic reports reveal that the country’s strong economy is the foremost element facilitating the essence of the banking sector. In this very vein, the current study corroborated that the banking sector development and economic growth has causal linkages. A set of banking reforms are urgently entailed, so as to make the country the financial hub of the GCC region, which shall accelerate the economic growth of the economy. In term of stock market development, SMD measured by the ratio of the stock market capitalization to GDP causes the BSD, which per se causes the economic growth. Thus, the significance of stock market development is also important. The advancement of Tadawul to the emerging market by FTSE Russell has sanguinely enhanced the prospect of the purported stock market’s addition in the MSCI index. The main policy implication of the current study is that the policy makers should promote the financing to the small and the medium enterprises. Further, the policy makers should enhance the ambit of legal charter covering the rights of the stakeholders and ink collaboration with global regulators, which shall be instrumental for the banking sector of the Saudi economy. In addition, the policy makers should ensure that the required set of reforms stipulated by the international indexes should be implemented by the related authorities in the Kingdom which shall enhance the liquidity and lead to greater reputation in the global financial markets. For the possible future studies, multiples indicators for the banking and stock market in the Saudi economy can be incorporated in order to appreciate the intricacies of the financial landscape of the Saudi Arabia.
References
- Adjasi, C.K.D. & Biekpe, N.B. (2006). Stock market development and economic growth: The case of selected African countries. African Development Review, 18(1), 144-161.
- Alghfais, M. (2016). Comparative analysis: The impact of financial sector development on economic growth in the non-oil sector in Saudi Arabia. SAMA Working Paper, WP/16/5.
- Amin, S.B. & Hossain, R.M. (2017). Finance-growth nexus in Bangladesh? An empirical analysis. Asian Economic and Financial Review, 7(2), 152-163.
- Atje, R. & Jovanovic, B. (1993). Stock markets and development. European Economic Review, 37(2-3), 632-640.
- Beck, T. & Levine, R. (2004). Stock markets, banks, and growth: Panel evidence. Journal of Banking & Finance, 28(3), 423-442.
- Caporale, G.M., Howells, P. & Soliman, A.M. (2005). Endogenous growth models and stock market development: evidence from four countries. Review of Development Economics, 9(2), 166-176.
- Cavenaile, L., Gengenbach, C. & Palm, F. (2014). Stock markets, banks and long run economic growth: A panel cointegration-based analysis. De Economist, 162(1), 19-40.
- Chakraborty, S. & Ray, T. (2006). Bank-based versus market-based financial systems: A growth-theoretic analysis. Journal of Monetary Economics, 53(2), 329-350.
- Demetriades, P.O. & Hussein, K.A. (1996). Does financial development cause economic growth? Time-series evidence from 16 countries. Journal of development Economics, 51(2), 387- 411.
- Demirguc-Kunt, A. & Maksimovic, V. (1998). Law, finance, and firm growth. Journal of Finance, 53(6), 2107-2137.
- Demirguc-Kunt, A. & Levine, R. (1996). Stock market development and financial intermediaries: Stylized facts. The World Bank Economic Review, 10(2), 291-321.
- Demirguc-Kunt, A. & Levine, R. (1996). Stock markets, corporate finance, and economic growth: An overview. The World Bank Economic Review, 10(2), 223-239.
- Dickey, D.A. & Fuller, W.A. (1981). Likelihood ratio statistics for autoregressive time series with a unit root. Econometrica, 49(4), 1057-1072.
- El-Wassal, K.A. (2005). Understanding the growth in emerging stock markets. Journal of Emerging Market Finance, 4(3), 227-261.
- Enisan, A.A. & Olufisayo, A.O. (2009). Stock market development and economic growth: Evidence from seven sub-Sahara African countries. Journal of Economics and Business, 61(2), 162-171.
- FTSE Russell promotes Saudi Arabia to Emerging Market status. (2018, March 28). Retrieved from http://www.ftserussell.com/files/press-releases/ftse-russell-promotes-saudi-arabia-emerging-market-status.
- Granger, C.W.J. (1969). Investigating causal relationship by econometric models and cross spectral methods. Econometrica, 37(3), 424-458.
- Granger, C.W.J. (1988). Some recent developments in a concept of causality. Journal of Econometrics, 39(1-2): 199-211.
- Ghildiyal, V., Pokhriyal, A.K. & Mohan, A. (2015). Impact of financial deepening on economic growth in indian perspective: ARDL bound testing approach to cointegration. Asian Development Policy Review, 3(3), 49-60.
- Goldsmith, R.W. (1969). Financial structure and development. New Haven, CT: Yale University Press.
- Gurley, J.G. & Shaw, E.S. (1955). Financial aspects of economic development. The American Economic Review, 45(4), 515-538.
- Hamdi, H., Sbia, R. & Tas, B.K.O. (2014). Financial deepening and economic growth in gulf cooperation council countries. International Economic Journal, 28(3), 459-473.
- Hicks, J.R. (1969). A Theory of Economic History. Oxford: Oxford University Press.
- Hsueh, S.J., Hu, Y.H. & Tu, C.H. (2013). Economic growth and financial development in Asian countries: A bootstrap panel Granger causality analysis. Economic Modelling, 32, 294-301.
- Johansen, S. (1988). Statistical analysis of cointegration vectors. Journal of Economic Dynamics and Control, 12(2-3), 231-254.
- Johansen, S. & Juselius, K. (1990). Maximum likelihood estimation and inference on cointegration with applications to the demand for money. Oxford Bulletin of Economics and Statistics, 52(2), 169-210.
- Khan, M.M.S. & Senhadji, A.S. (2000). Financial development and economic growth: An overview (No. 0-209). International Monetary Fund.
- King, R.G. & Levine, R. (1993a). Finance and growth: Schumpeter might be right. Quarterly Journal of Economics, 108(3), 717-737.
- Lee, B.S. (2012). Bank-based and market-based financial systems: Time-series evidence. Pacific-Basin Finance Journal, 20(2), 173-197.
- Levine, R. & Zervos, S. (1998). Stock markets, banks, and economic growth. American Economic Review, 88(3), 537-558.
- Levine, R. & Zervos, S. (1996). Stock market development and long-run growth. World Bank Economic Review, 10(2), 323-39.
- Luintel, K.B. & Khan, M. (1999). A quantitative reassessment of the finance growth nexus: Evidence from a multivariate VAR. Journal of Development Economics, 60(2), 381-405.
- Mahran, H.A. (2012). Financial intermediation and economic growth in Saudi Arabia: An empirical analysis, 1968-2010. Modern Economy, 3(5), 626-640.
- Masih, M., Al-Elg, A. & Madani, H. (2009). Causality between financial development and economic growth: An application of vector error correction and variance decomposition methods to Saudi Arabia. Applied Economics, 41(13), 1691-1699.
- Masoud, N. & Hardaker, G. (2012). The impact of financial development on economic growth: Empirical analysis of emerging market countries. Studies in Economics and Finance, 29(3), 148-173.
- Masoud, N. & Hardaker, G. (2014). Stock market development, banks and firms growth: Empirical evidence from Saudi Arabia. International Journal of Economics and Finance, 6(6), 159.
- McKinnon, R.I. (1973). Money and Capital in Economic Development. Washington, DC: Brookings Institution.
- Naceur, S.B. & Ghazouani, S. (2007). Stock markets, banks, and economic growth: Empirical evidence from the MENA region. Research in International Business and Finance, 21(2), 297-315.
- Naik, P.K. & Padhi, P. (2015). On the linkage between stock market development and economic growth in emerging market economies. Review of Accounting & Finance, 14(4), 363.
- Nasir, H., Majeed, S. & Aleem, A. (2018). Does financial development leads economic growth? Evidence from Emerging Asian Markets. Asian Economic and Financial Review, 8(5), 599-617.
- Olayiwola, K., Okodua, H. & Osabuohien, E.S.C. (2014). Finance for growth and policy options for emerging and developing economies: The case of Nigeria. Asian Development Policy Review, 2(2), 20-38.
- Phillips, P.C.B. & Perron, P. (1988). Testing for a Unit root in Time Series regression. Biometrika, 75, 335-346.
- Pradhan, R.P. Arvin, M.B., Norman, N.R. & Hall, J.H. (2014). The dynamics of banking sector and stock market maturity and the performance of Asian economies: time series evidence. Journal of Economic and Administrative Sciences, 30(1), 16-44.
- Rabiul, M. (2010). Banks, stock markets and economic growth: Evidence from selected developing countries. Decision, 37(3), 5.
- Rachdi, H. & Mbarek, H.B. (2011). The Causality between Financial Development and Economic Growth: Panel Data Cointegration and GMM System Approaches, International Journal of Economics and Finance, 3(1), 143-151.
- Rafindadi, A.A. & Aliyu, A.A. (2017). Growing the growth of the Ghanaian economy: Is the function of the country’s financial development of any significance? Asian Economic and Financial Review, 7(2), 206-221.
- Rajabi, E. & Muhammad, J. (2014). The Stock Markets, Banks and Growth Nexus: Asian Islamic Countries. Economic Notes, 43(2), 137-165.
- Rajan, R.G. & Zingales, L. (1998). Financial dependence and growth. American Economic Review, 88(3), 559-586.
- Rioja, F. & Valev, N. (2014). Stock markets, banks and the sources of economic growth in low and high income countries. Journal of Economics and finance, 38(2), 302-320.
- Rousseau, P.L. & Vuthipadadorn, D. (2005). Finance, investment, and growth: Time series evidence from 10 Asian economies. Journal of Macroeconomics, 27(5), 87-106.
- Samargandi, N., Fidrmuc, J. & Ghosh, S. (2014). Financial development and economic growth in an oil-rich economy: The case of Saudi Arabia. Economic Modelling, 43, 267-278.
- Schumpeter, J.A. (1934). The Theory of Economic Development. Oxford: Oxford University Press.
- Shan, J. & Morris, A. (2002). Does financial development 'lead' economic growth? International Review of Applied Economics, 16(2), 153-168.
- Zang, H. & Kim, Y.C. (2007). Does financial development precede growth? Robinson and Lucas might be right. Applied Economic Letters, 14(1), 15-19.