Research Article: 2023 Vol: 27 Issue: 6
Beds in Health Facilities in the Italian Regions: A Socio-Economic Approach
Angelo Leogrande, LUM University Giuseppe Degennaro, Italy
Alberto Costantiello, LUM University Giuseppe Degennaro, Italy
Domenico Leogrande, LUM University Giuseppe Degennaro, Italy
Fabio Anobile, Università degli Studi di Bari Aldo Moro, Italy
Citation Information: Leogrande, A., Costantiello, A., Leogrande, D., Anobile, F. (2023). Beds in health facilities in the italian regions: A socio-economic approach. Academy of Accounting and Financial Studies Journal, 27(6), 1-25.
Abstract
In this article, we consider the determinants of the beds in healthcare facilities-BEDS in the Italian regions between 2004 and 2022. We use the ISTAT-BES database. We use different econometric techniques i.e.: Panel Data with Fixed Effects, Panel Data with Random Effects, Pooled Ordinary Least Squares-OLS, Weighted Least Squares-WLS, and Dynamic Panel at 1 Stage. The results show that the level of BEDS is positively associated, among others, to "General Doctors with a Number of Clients over the Threshold" and "Life Satisfaction", and negatively associated among others, to "Trust in Parties" and "Positive Judgment on Future Prospects". Furthermore, we apply a clusterization with the k-Means algorithm optimized with the Silhouette Coefficient and we find the presence of two clusters in terms of BEDS. Finally, we make a confrontation among eight machine-learning algorithms and we find that the best predictor is the ANN-Artificial Neural Network
Keywords
Analysis of Health Care Markets, Health Behaviors, Health Insurance, Public and Private, Health and Inequality, Health and Economic Development, Government Policy , Regulation, Public Health.
Introduction
In the following analysis, we take into consideration the role of hospital beds i.e. BEDS in the Italian regions. The data used refers to the ISTAT-BES database. The ISTAT-BES database was built with the intention of introducing variables that are not the representation of classic economic measures such as GDP, inflation and the unemployment rate. On the contrary, in the ISTAT-BES approach, elements are also detected that refer to social and environmental issues, as well as psychological ones, such as the perception of the individual well-being, with measures of inequality and the effectiveness of the judicial and police system. The orientation of the ISTAT-BES database is ideally and scientifically connected to the broader intellectual and political movement that led to the identification of the SDGs-Sustainable Development Goals at the Organization of the United Nations and which has generated the ESG-Environment Social and Governance model. Specifically we have applied the ISTAT-BES database to Italian regions to verify if the differences between Southern, Center and Northern regions can explain or capture some of the essential connection among the variables.
The article proceeds as follows: the second section presents a brief analysis of the scientific literature, the third section contains the econometric model, the fourth section shows the clustering analysis with the k-Means algorithm, the fifth section contains the results of the analysis with the machine learning algorithms for predicting the future value of BEDS, the sixth section concludes. The appendix shows additional metric analyses, tables and graphs.
Literature Review
Below we present a brief analysis of the scientific literature to introduce the themes that will subsequently be explored in depth from a metric point of view and with the help of machine learning algorithms. In particular, we focused our attention on three elements: the role of BEDS for efficiency in the provision of health services to the population, the role of BEDS during the Covid-19 pandemic, the role of BEDS in its relations with the technological innovation.
BEDS and Healthcare Services
The efficiency in the production of health services depends both on the supply of BEDS and on a set of other variables. The absolute value of BEDS generally reported on the population does not offer the adequate information necessary for a qualitative evaluation of hospital management. Therefore, it is necessary to consider the value of BEDS in relation to the number of physicians and in connection with other healthcare variables that highlight the role of equipment and human capital in the provision of healthcare services to the population. The number of hospital beds is considered an indicator of the services offered within healthcare facilities (Denver, 2005). However, the number of hospital beds is essentially a quantitative variable; to give a qualitative meaning to the number of hospital beds it is necessary to integrate the analysis also considering the presence of physicians, nurses, and the presence of qualified places and necessary equipment (Jacques et al., 2014). The simple number of beds in hospital facilities is insufficient to grasp the complexity of the hospital efficiency; in fact, the following variables must also be considered: the Percent-age of Public Hospital Beds (PPHB), Bed Occupancy Rate (BOR), Average Length of Stay (ALS), Bed Turnover Rate (BTR) and Turnover Intervals (TI), Average Length Of Stay (AvLOS), Turnover Interval (TOI), Beds Turn Over (BTO) (Srimayarti et al., 2021). The increase in hospital beds in China during the period 2000-2010 is positively associated to the augment in life expectancy and negatively associated to infant mortality rate (Qiu et al., 2023). Considering the case of Japan, it is possible to observe that while on the one hand hospital beds in rehabilitative care have a positive effect on life expectancy and healthy life expectancy, on the other hand hospital beds in long-term care have a negative impact on life expectancy and a positive one on healthy life expectancy (Hosokawa el al., 2020). The number of hospital beds in Saudi Arabia is programmed to growth as a part of a policy oriented to offer efficient healthcare services to the population (Chowdhury et al., 2021).
BEDS and Covid-19
Covid-19 has highlighted the fragility of many healthcare systems nationwide. During the pandemic, the supply of ICU beds was insufficient both in countries with high per capita income and in countries with low per capita income. Furthermore, health systems have experienced shortages in health personnel and equipment, such as in the case of lung ventilators. Certainly, health systems are not created to withstand persistent pressures as in the case of the pandemic. However, there is no doubt that the pandemic has highlighted the need to implement new hospital management models that also take into consideration the provision of healthcare services in the event of extreme events such as pandemics, wars and natural disasters. The lack of hospital beds has reduced India's ability to respond effectively to the Covid-19 pandemic (Kumar et al., 2020). The low availability of beds during the pandemic has generated criticism of hospital management (Tyrrell et al., 2021). The need to increase the offer of new beds during the Covid-19 pandemic has pushed some countries to create ad hoc structures as in the case of Wuhan in China, where in a few days healthcare facilities were built for assistance and treatment of patients (Capolongo et al., 2021). The Covid-19 pandemic has highlighted the insufficiency of intensive care unit beds in Brazil (Daumas et al., 2020). The lack of hospital beds and trained healthcare personnel to combat Covid-19 in Mexico has been partially overcome through the creation of the Respiratory Disease Clinic-RDC (Rodríguez et al., 2023). The ability of low per capita income countries to react to the covid-19 crisis was even worse than that of high per capita income countries: for example in Haiti, a country with 10 million inhabitants, an estimated 124 hospital ICU beds set up for pandemic emergency (Losonczy et al., 2019). The availability of ICU beds in Yemen was insufficient during the Covid-19 pandemic (Zawiah et al., 2020). The Indonesian healthcare system has showed its fragility during the Covid-19 pandemic especially in the offering of ICU beds and in the shortage of physicians (Mahendradhata et al., 2021). Brazil experienced regional inequalities in the supply of ICU beds with the regions of the South and Southeast with higher values in respect to the regions of the North, which experienced a lower furniture of ICU beds (Silva et al., 2021). There is a non-linear relationship between Covid-19 and hospital beds, even if the Covid-19 deaths are negatively associated with the increase in hospital beds (Abdulla et al., 2021). Kenya has experienced a shortage in ICU beds during the Covid-19 pandemic with 600 units for a population of approximately 53 million inhabitants (Ouma et al., 2021).
BEDS and Technology
The use of new information technologies can help hospitals in patient management. However, it is also necessary to address the ethical questions posed by the use of digitalisation applications in the healthcare sector. The possibility of using cameras in nursing and care homes for the elderly raises ethical questions regarding the efficient management of beds (Berridge et al., 2019).
The Econometric Model for the Estimation of BEDS
To estimate the value of BEDS we used data from ISTAT-BES. The data refer to the period between 2004 and 2022 for the 20 Italian regions. The data were analyzed using the following econometric techniques: Panel Data with Fixed Effects, Panel Data with Random Effects, Pooled Ordinary Least Squares-OLS, Weighted Least Squares-WLS, and Dynamic Panel at 1 Stage. Specifically, we estimated the following model, namely:


Specifically, we found that the level of BEDS is positively associated to:
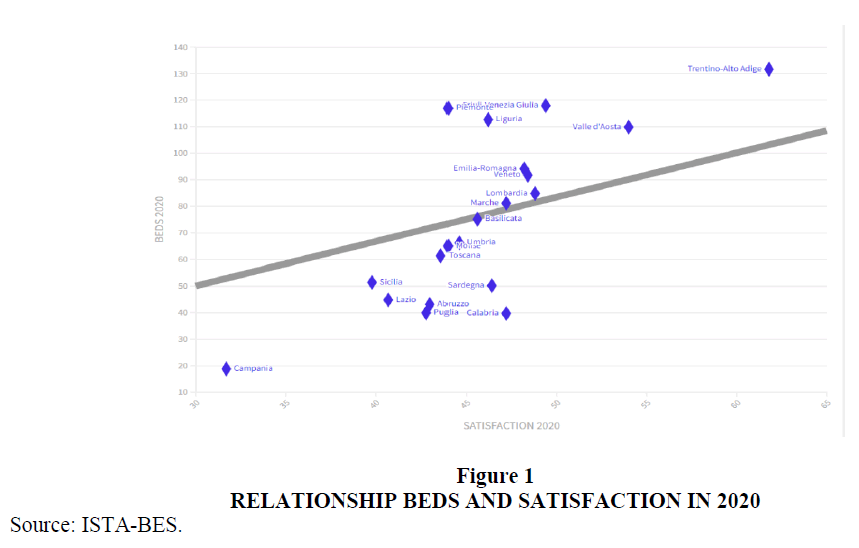
S: percentage of people aged 14 and over who expressed a life satisfaction score between 8 and 10 out of all people aged 14 and over. There is a positive relationship between the value of BEDS and the value of S in the Italian regions. In particular, the regions in which there is greater satisfaction with life are also the people who have higher BEDS values. For example, considering 2020, it is possible to verify that the countries that have high levels of S also have high levels of BEDS, namely: Trentino Alto Adige with an S value of 61.8, and a BEDS value of 131 .6, followed by Valle d'Aosta with an S value of 54 and a BEDS value of 109.8, Friuli Venezia Giulia with an S value of 49.4 and a BEDS value of 117, 9, Lombardy with an S value equal to 48.8 and a BEDS value equal to 84.8, Veneto with an S value equal to 48.4 and a BEDS value equal to 91.7, Emilia Romagna with a S value equal to 48.2 and a BEDS value equal to 94.2 (Figure 1). The regions that have greater satisfaction with life are also countries that have a high BEDS value and also coincide with the Italian regions that have higher per capita income.
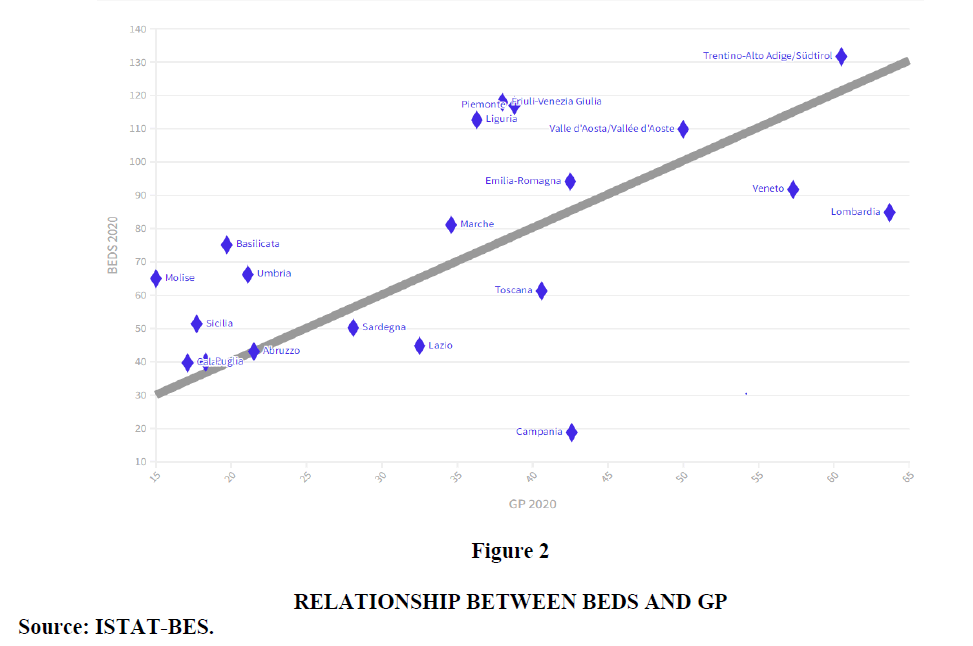
GP: percentage of general practitioners with a number of patients exceeding the maximum threshold of 1500 patients envisaged by the contract for general practitioners. There is a positive relationship between the value of GP and the value of BEDS. Considering the top 6 regions by GP value in 2020, it is possible to note that 5 of the 6 regions have BEDS values above the average, i.e.: Lombardia with GP equal to 63.7 and BEDS equal to 84.8, Trentino Alto Adige with a GP value equal to 60.5 and a BEDS value equal to 131.6, Veneto with a GP value equal to 57.3 and a BEDS value equal to 91.7, Valle d'Aosta with a value of GP 2020 equal to a value of 50 and a BEDS value of 91.7, Emilia Romagna with a GP value of 42.5 and a BEDS value of 94.1 (Figure 2). Furthermore we can note that the regions that have the highest level of GP are the regions of northern Italy which have high per capita incomes. It follows that even in the regions of Italy that are more endowed from an economic-financial point of view, there is a lack of adequate health services with a shortage of physicians and a level of assistance that appears to be insufficient due to the lack of medical personnel. A condition that could be improved through the improvement of methodologies for the recruitment and training of medical-health personnel.
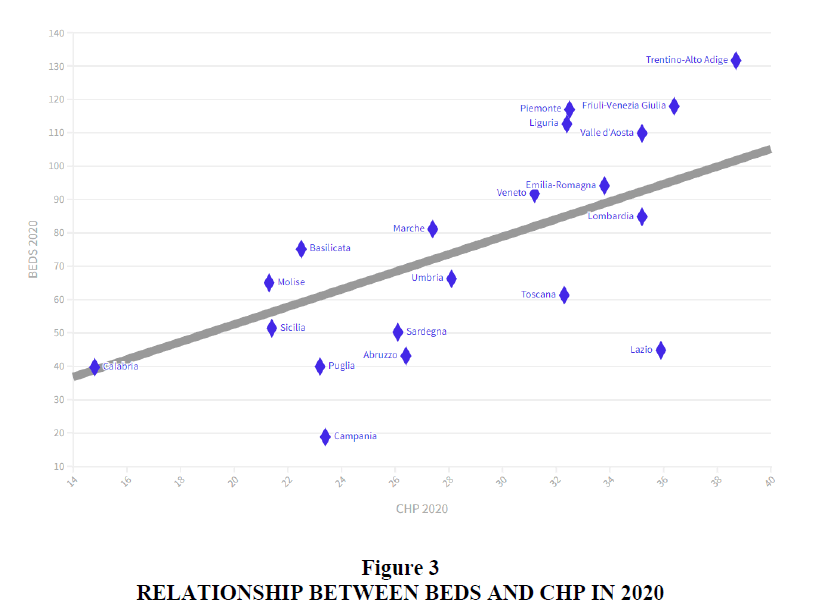
CPAH: percentage of people aged 14 and over who carry out at least one civic and political participation activity out of the total number of people aged 14 and over. The activities considered are: talk about politics at least once a week; inform yourself about the facts of Italian politics at least once a week; participate online in consultations or votes on social (civic) or political issues (e.g. urban planning, sign a petition) at least once in the 3 months preceding the interview; express opinions on social or political issues through websites or social media at least once in the 3 months preceding the interview. There is a positive relationship between the value of CPAH and the value of BEDS in the Italian regions. Specifically, regions that have medium-high levels of CPAH also have medium-high levels of BEDS. Specifically, considering the countries that have high CPAH values we can see that they are the same countries that also have high BEDS values. For example, considering 2020 it appears that Trentino Alto Adige with a CPAH value equal to 38.7 and a BEDS value equal to 131.6, followed by Friuli Venezia Giulia with a CPAH value equal to 36.4 and a value of BEDS equal to 117.9, Lombardy with a CPAH value equal to 35.2 and a BEDS value equal to 84.8, Valle d'Aosta with a CPAH value equal to 35.2 and a BEDS value equal to 109.8, Emilia Romagna with a CPAH value of 33.8 and a BEDS value of 94.1, Piedmont with a CPAH value of 32.5 and a BEDS value of 116.9, Liguria with a CPAH value of 32.4 and a BEDS value of 112.6 (Figure 3).
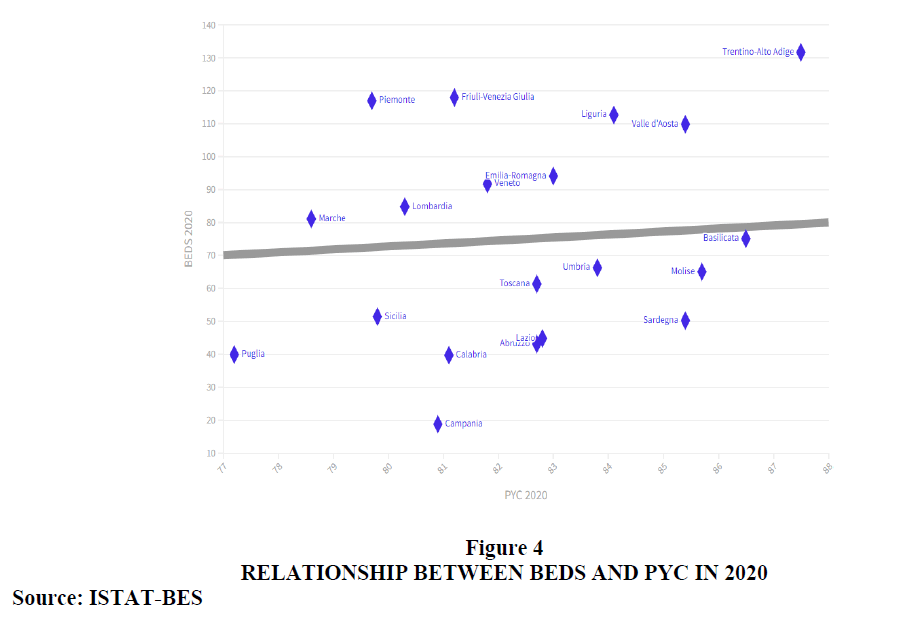
PYC: percentage of people aged 14 and over who have non-cohabiting relatives (in addition to parents, children, brothers, sisters, grandparents, grandchildren), friends or neighbors to rely on out of the total number of people aged 14 and over. There is a positive relationship between the value of PYC and the value of BEDS. Specifically, if we take 2020 into consideration we can note that the countries that have high values in terms of PYC also have high BEDS values, that is: Trentino Alto Adige with a PYC value of 87.5 and a BEDS value of to an amount of 131.6, Basilicata with a PYC value equal to 86.5 and a BEDS value equal to 75.1, Valle d'Aosta with a PYC value equal to an amount 86.5 and a value of BEDS equal to an amount of 75.1, Valle d'Aosta with a PYC value equal to an amount of 85.4 units and a BEDS value equal to an amount of 109.8 units, Liguria with a PYC value equal to to an amount of 84.1 units and a BEDS value equal to an amount of 112.6, Emilia Romagna with a PYC value equal to 83 and a BEDS value equal to an amount of 94.1 (Figure 4).
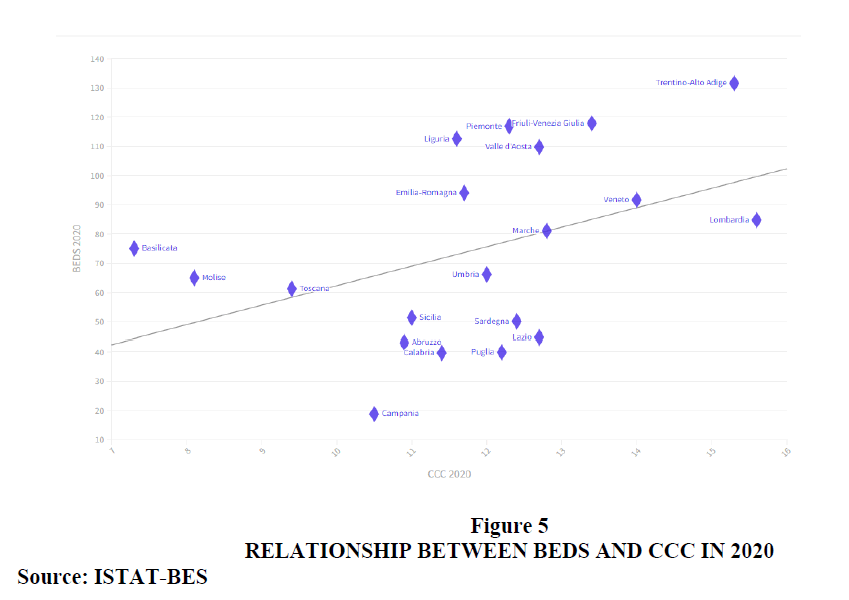
CCC: percentage of people aged 14 and over who consider climate change or the increase in the greenhouse effect and the ozone layer among the top 5 environmental concerns. There is a positive relationship between the value of CCC and the value of BEDS. Considering 2020 we can note that the regions that have a high CCC also have a high BEDS value such as for example: Trentino Alto Adige has a BEDS value equal to 131.6 and a CCC value equal to 15.3, the Friuli Venezia Giulia has a BEDS value of 117.9 and a CCC value of 13.4, Piedmont has a BEDS value of 116.9 and a CCC value of 12.3, Liguria with a BEDS value of 112.6 and a CCC value of 12.3, Valle d'Aosta with a BEDS value of 109.8 and a CCC value of 12.7, Emilia Romagna with a BEDS value equal to 94.1 and a CCC value equal to 11.7, Veneto with a BEDS value equal to 91.7 and a CCC value equal to 14, Lombardy with a BEDS value equal to 84 .8 and a CCC value of 15.6, the Marche with a BEDS value of 81.1 and a CCC value of 12.8. We can therefore note that the Northern regions have a greater endowment of both BEDS and concern for the environmental condition. It is probable that the greater endowment of per capita income and also a greater endowment of human and social capital in the regions of Northern Italy compared to the regions of Southern Italy could generate greater concern for the environmental condition (Figure 5).
DMW: percentage of the total volume of total water losses in the municipal drinking water distribution networks (difference between the volume introduced into the network and the volume dispensed authorized) on the total amount of water introduced. There is a negative relationship between the value of BEDS and the value of DMW. However, it must be considered that this relationship is counterfactual in reality. In fact, if we consider for example a financial year like 2020 we can notice that the regions with the highest level of DMW are the southern regions. Specifically we can note that Basilicata is in first place in terms of DMW value with an amount of 62.1, followed by Abruzzo with 59.8, Sicily with 52.5, Molise with 51.8, Sardinia with 51 ,3, Lazio with 49.7, Umbria with 49.1 and Campania with 46.8. In fact, if we take a period between 2005 and 2020 we can note that many Northern regions have seen the value of DMW grow, namely: Liguria with a value equal to +54.83% equal to an amount of 14.2, followed by Veneto with 43.52% equal to an amount of 13.1 units, followed by Lazio with an amount of 42.00% equal to an amount of 14.7 units, by Tuscany with a value equal to 41.50% equal to a amount of 12.2 units, from Lombardy with an amount of 35.87% equal to an amount of 8 units, Trentino Alto Adige with a value equal to +28.93% equal to an amount of 7 units, Emilia Romagna with a value equal to 19.01% equal to an amount of 5 units, Piedmont with a variation equal to 11.04% equal to 3.5 units, and Friuli Venezia Giulia with a variation of 9.66% equal to an amount of 3 ,7 units. Therefore, even if in an absolute sense the value of DMW is high in the southern regions compared to those of Northern Italy, it is also necessary to consider that in a relative sense the value of DMW has grown in all regions including those of Northern Italy.
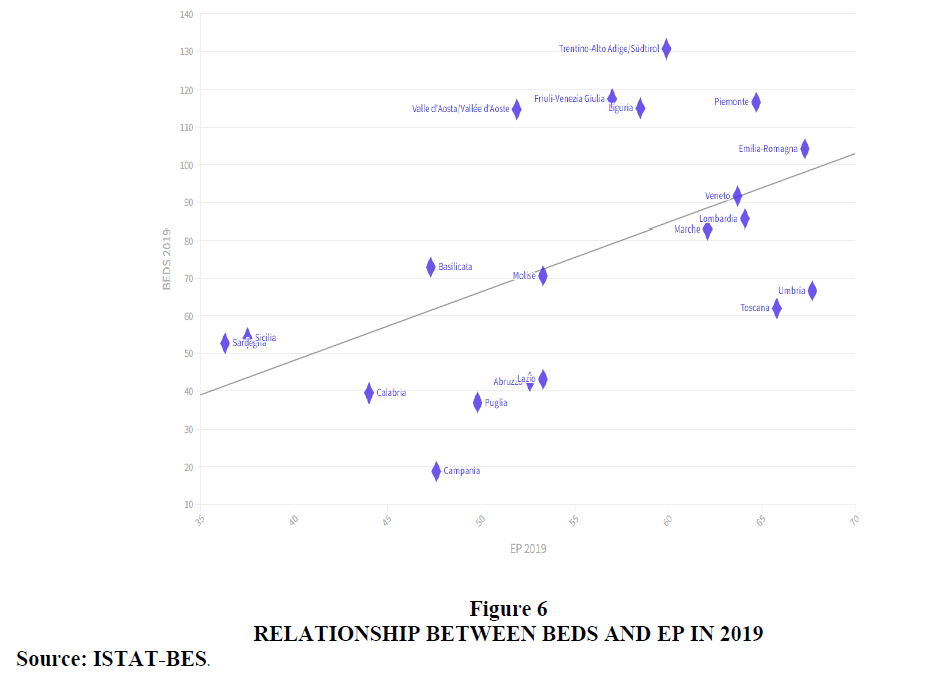
EP: Percentage of people who voted in the last European Parliament elections out of the total number of eligible voters. There is a positive relationship between the value of EP and the value of BEDS. Specifically, if we consider 2019 we can note that the regions that have a high level of EP also have a high level of BEDS, that is: Umbria with an EP value is equal to an amount of 67.7 units, while the BEDS value is equal to 66.7 units, Emilia-Romagna with an EP value equal to 67.3 and a BEDS value equal to 104.3 units, Tuscany with an EP value equal to 65.8 and a BEDS value equal to 62, Piedmont with an EP value equal to 64.7 units and a BEDS value equal to 116.7 units, Lombardy with an EP value equal to 64.1 units and a BEDS value equal to 85.7 units, Veneto with an EP value of 63.7 and a BEDS value of 85.7. We can note that the value of electoral participation tends to grow with per capita income in the Northern regions. That is, the regions that have greater per capita income have both a greater endowment of BEDS and greater electoral participation, i.e. a higher level of human and social capital (Figure 6).
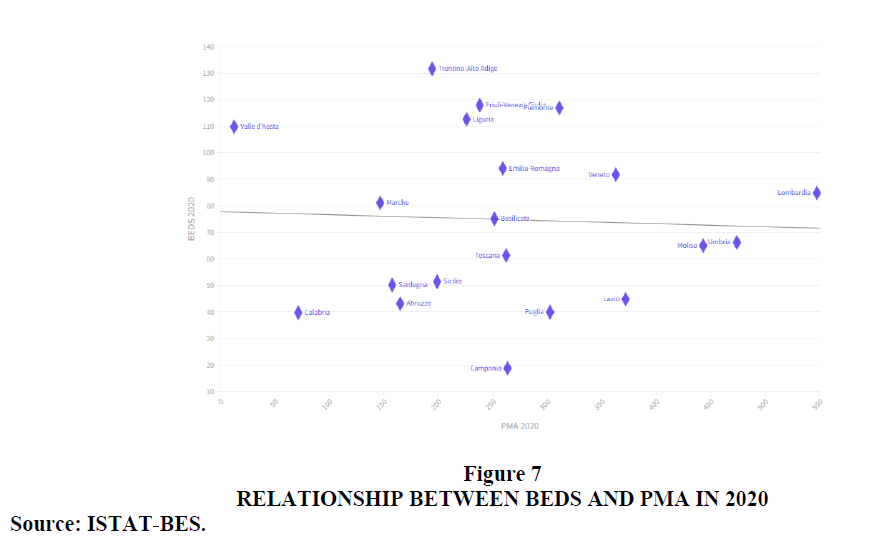
PMA: Pressure resulting from non-energy mining activities (cubic metres) per km^2. There is a negative relationship between the value of PMA and the value of BEDS. Specifically we can note that countries that have high PMA levels also have medium-low BEDS levels. For example, if we take 2020 into consideration we can notice that countries that have a high value of PMA also have a low value of BEDS. For example, the following countries such as Umbria with a PMA value equal to 474.1 and a BEDS value equal to 66.2 units, Molise with a PMA value equal to 443.2 units and a BEDS value equal to an amount of 65 units. Lazio with a PMA value equal to 372 units and a BEDS value equal to an amount of 44.8 units (Figure 7).
ER: percentage of employed people aged 20-64 out of the population aged 20-64. There is a negative relationship between the value of ER and the value of BEDS. This relationship could appear paradoxical because the regions that have higher levels of BEDS are the northern regions, which also have higher per capita income and therefore higher level of employment. However, if we take into consideration the period between 2018 and 2020 we can note that due to the presence of Covid-19, there was a change in trend in determining the size of the employed from North to South. In fact, due to Covid-19 many jobs have been lost and the employment rate has reduced in the regions of Northern Italy much more than it has reduced in the regions of Southern Italy. This trend had a quantitative impact on determining the relationship between the ER value and the BEDS value. Specifically we can note that between 2018 and 2020 the value of ER decreased in many regions of the central north such as Valle D'Aosta with -1.38%, Tuscany with -1.54%, Emilia Romagna with -1 .61%, Veneto with -1.82%, Lombardy with -2.07%, Lazio with -2.30%, Liguria with -2.37%, Trentino Alto Adige with -2.75%, Piedmont with -2 ,83%. It therefore follows that the relationship between BEDS and ER was influenced by the manifestation of Covid-19 which reduced the employment rate especially in the regions of Northern Italy creating a negative connection between the two variables.
PJFP: Percentage of people aged 14 and over who believe that their personal situation will improve in the next 5 years out of the total number of people aged 14 and over. We can see that there is a negative relationship between the value of PJFP and the value of BEDS. This negative relationship might appear paradoxical and counterfactual. In fact, generally in regions where there is greater gross domestic product it is also more likely that the conditions will be created for a growth in positive expectations about the future. However, if we take into consideration the period between 2014 and 2022 we can verify that the value of PJFP has grown especially in the southern regions. In fact we can see that the value of PJFP in Campania grew by 44.50%, in Puglia by 43.72%, in Abruzzo by 36.24%, in Sardinia by 28.20%, in Sicily with +25.38% , in Basilicata with a value of +25.20%. This variation was much more positive in the Southern regions than in the Northern regions. In fact, the Southern regions were behind in terms of PJFP and in alignment with the Northern regions, they showed a very high growth rate of PJFP which influenced the metric analysis by creating a negative relationship between the value of PJFP and the value of BEDS.
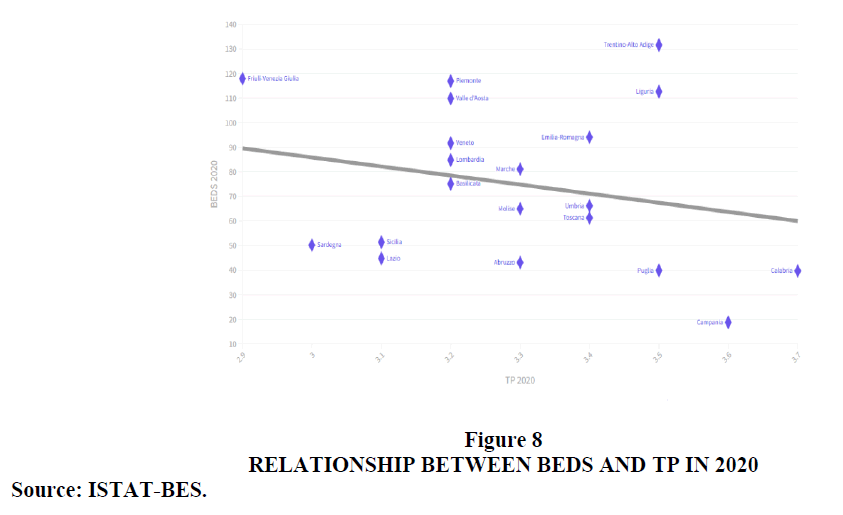
TP: average score of trust in parties (on a scale of 0 to 10) expressed by people aged 14 and over. There is a positive relationship between the value of TP and the value of BEDS. Many regions that have a high average value of TP also have a low average value of BEDS. For example, considering 2020, it appears that Calabria has a TP value of 3.7 and a BEDS value of 39.7, Campania has a TP value of 3.6 and a BEDS value of at 18.8, Puglia has a TP value of 3.5 and a BEDS value of 39.9, Tuscany has a TP value of 3.4 and a BEDS value of 61.3 , Umbria has a TP value equal to 3.4 and a BEDS value equal to 66.2, Abruzzo has a TP value equal to 3.3 and a BEDS value equal to 43.1, the Marche has a TP value of 3.3 and a BEDS value of 81.1 and Molise has a TP value of 3.3 and a BEDS value of 65 (Figure 8).
The econometric results are synthetized in the table 1.
| Table 1 Synthesis of the Econometric Results | ||||||||||||||
| A8 | A11 | A35 | A42 | A45 | A64 | A66 | A73 | A84 | A94 | A120 | A107(-1) | |||
| Constat | Cultural participation away from home | Employment rate (20-64 years) | People you can count on | Electoral participation | Trust in parties | Satisfaction with one's life | Positive judgment on future prospects | Pressure from mining activities | Dispersion from the municipal water network | Concern about climate change | General practitioners with a number of clients over the threshold | Beds in residential social-welfare and social-health facilities | ||
| CPAH | ER | PYC | EP | TP | S | PJFP | PMA | DMW | CCC | GP | BEDS | |||
| Fixed-effects | Coefficient | -35.022 | 0.788 | -0.339 | 0.491 | 0.260 | -7.552 | 1.584 | -1.739 | -0.056 | 0.328 | 0.352 | 1.849 | |
| Std. Error | 2.691 | 0.211 | 0.048 | 0.042 | 0.039 | 1.860 | 0.088 | 0.394 | 0.010 | 0.056 | 0.169 | 0.134 | ||
| p-value | *** | *** | *** | *** | *** | *** | *** | *** | *** | *** | ** | *** | ||
| Random-effects | Coefficient | -34.0532 | 0.8419 | -0.3322 | 0.4948 | 0.2632 | -7.9355 | 1.6082 | -1.8242 | -0.0537 | 0.3381 | 0.3794 | 0.7603 | |
| Std. Error | 4.590 | 0.208 | 0.047 | 0.042 | 0.039 | 1.845 | 0.088 | 0.388 | 0.010 | 0.055 | 0.167 | 0.126 | ||
| p-value | *** | *** | *** | *** | *** | *** | *** | *** | *** | *** | ** | *** | ||
| Pooled OLS | Coefficient | -27.399 | 1.240 | -0.241 | 0.531 | 0.290 | -13.174 | 1.912 | -2.403 | -0.047 | 0.383 | 0.579 | 1.198 | |
| Std. Error | 2.842 | 0.257 | 0.061 | 0.053 | 0.051 | 2.300 | 0.108 | 0.443 | 0.011 | 0.070 | 0.197 | 0.099 | ||
| p-value | *** | *** | *** | *** | *** | *** | *** | *** | *** | *** | *** | *** | ||
| WLS | Coefficient | -25.488 | 1.202 | -0.218 | 0.501 | 0.255 | -9.675 | 1.600 | -2.140 | -0.047 | 0.350 | 0.479 | 1.212 | |
| Std. Error | 2.215 | 0.203 | 0.049 | 0.042 | 0.039 | 1.881 | 0.089 | 0.332 | 0.009 | 0.054 | 0.146 | 0.078 | ||
| p-value | *** | *** | *** | *** | *** | *** | *** | *** | *** | *** | *** | *** | ||
| 1-step dynamic | Coefficient | 0.87476 | -0.26894 | 0.44077 | 0.32294 | -8.15737 | 0.82236 | -2.26130 | -0.06145 | 0.28690 | 0.60521 | 1.67219 | 0.34516 | |
| Std. Error | 0.18231 | 0.02817 | 0.05390 | 0.02830 | 2.20212 | 0.11746 | 0.49098 | 0.01506 | 0.04749 | 0.18688 | 0.25839 | 0.06734 | ||
| p-value | *** | *** | *** | *** | *** | *** | *** | *** | *** | *** | *** | *** | ||
| Average | 0.990 | -0.280 | 0.492 | 0.278 | -9.299 | 1.505 | -2.074 | -0.053 | 0.337 | 0.479 | 1.338 | 0.069 | ||
Ranking. Variations and Clusterization with k-Means Algorithm Optimized with the Silhouette Coefficient
Ranking of Italian regions for the number of BEDS in 2020
Trentino Alto Adige is in first place for BEDS value in 2020 among the Italian regions with an amount of 131.6, followed by Friuli Venezia Giulia with 117.9, and Piedmont with an amount of 116.9, In the middle of the ranking are the Marches with an amount of 81.1, followed by Basilicata with an amount of 75.1 and Umbria with an amount of 66.2. Puglia closes the ranking with an amount of 39.9, followed by Calabria with an amount of 39.7, and Campania with an amount of 18.8 units. We can see that almost all the regions of Northern Italy have high values in terms of BEDS compared to the central-southern regions. The analysis therefore suggests the growth of the value of BEDS in association with the growth of per capita income in the Italian regions.
Ranking delle regioni italiane per tasso di variazione del valore di BEDS tra il 2009 ed il 2020
Basilicata is in first place for the rate of variation of the value of BEDS between 2009 and 2020 with an amount equal to 117.05% or equal to 40.5 units, followed by Umbria with a variation equal to 45.81%, equal to an amount of 20.8 units and from Campania with an amount of 25.33% equal to 3.8 units. In the middle of the ranking are Valle d'Aosta with a value of 10.24% equivalent to 10.2 units, followed by the Marches with a variation of 9.89% equal to 7.3 units and Friuli Venezia Giulia with a change of 7.57%, equal to 8.3 units. Lombardy closes the ranking with a value equal to -21.19% equivalents to an amount of -22.8 units, followed by Molise with -29.35% equal to -27 units and Abruzzo with -43.06% equal to -32.6 units. In the period between 2009 and 2020, the value of BEDS grew by an average of 3.23%.
Trend in BEDS value for the Italian macro-regions between 2009 and 2020
If we look at the rate of change of the Italian macro-regions we can see that the only macro-regions characterized by economic growth are the South with +7.40% equal to 2.3 units, followed by the Centre with +2.37% equal to 1.3 units. In the middle of the ranking are Southern Italy which between 2009 and 2020 reduced the number of BEDS by an amount equal to -0.51%, equal to -0.2 units, followed by the North-East with -0.60 % equal to an amount of -0.6, from the North with a variation equal to -4.79% equal to -4.9 units, from the North-West with -7.68% equal to -8 units, and from the Islands with -9.56% equal to -5.4 units. From the point of view of the absolute value, we note that in 2020 the value of BEDS in the Northeast was 99.1, followed by 97.4 in the North, 96.2 in the North-West, 56.1 in the Centre, 51.1 of the Islands, from Southern Italy with 39.1 and from the South with 33.4.
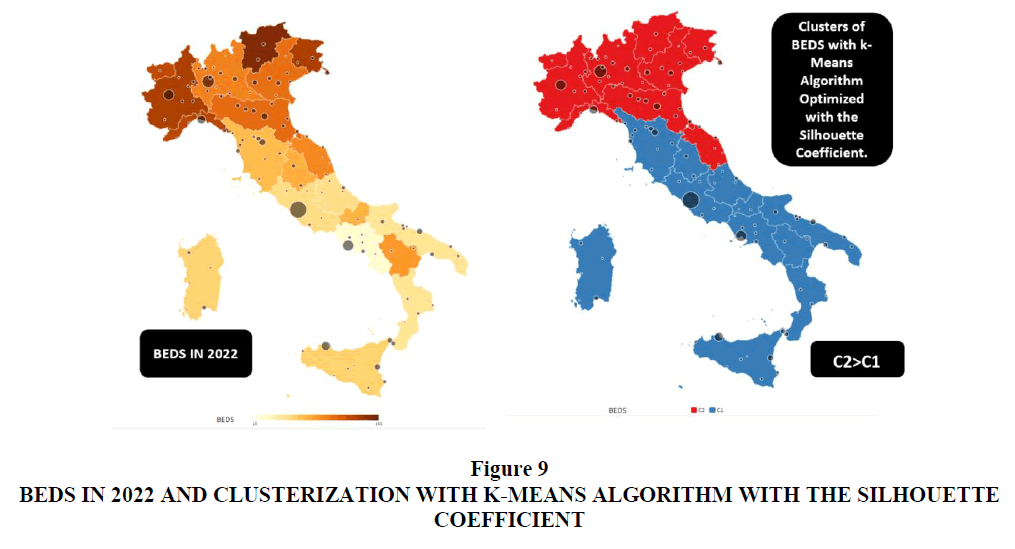
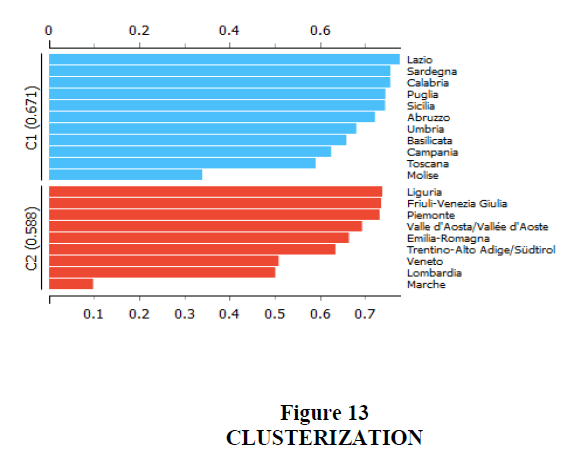
Clusterization with the k-Means algorithm optimized with the Silhouette Coefficient. A clustering with k-Means algorithm optimized with the Silhouette coefficient is presented below. Through the proposed analysis, two different clusters are identified, namely:
a) Cluster 1: Lazio, Sardinia, Calabria, Puglia, Sicily, Abruzzo, Umbria, Basilicata, Campania, Tuscany, Molise;
b) Cluster 2: Liguria. Friuli Venezia Giulia. Piedmont. Valle d'Aosta. Emilia-Romagna. Trentino Alto Adige. Veneto. Lombardy. Marche.
From the point of view of the median, it appears that the median of cluster 2-C2 is equal to 109.8. While the median of cluster 1-C1 is equal to 50.8. Hence the following ordering C2=109.8>C1=50.8 (Figure 9).
From a strictly geographical point of view, we can note that the regions of Cluster 2 are located in Northern Italy. The Marches are the only region extraneous to the Northern area and present in Cluster 2. There is therefore a clear separation between Northern Italy and Central-Southern Italy in terms of the presence of BEDS value. The central-southern regions appear to be far behind in terms of the value of BEDS. The median value of cluster 1, i.e. the cluster that brings together the southern regions, is approximately half of the median value of cluster 2. i.e. the cluster of northern regions. The fact that the regions with the highest BEDS value are also the northern regions suggests the existence of a positive relationship between the BEDS value and the per capita income calculated at the regional level. Regions that have higher per capita incomes also tend to have higher BEDS. This difference between Northern Italy and Central-Southern Italy raises the question of efficiency and equality of opportunity in accessing treatment pathways and the health service on a regional basis. The regions of Southern Italy appear to be penalized with a significant gap compared to the regions of Northern Italy in terms of BEDS. We must consider that the historical series analysed does not take into consideration the post-pandemic dimension, since the data relating to the period 2020-2022 is missing. It is probable that due to the manifestation of the pandemic, the value of BEDS has grown both in Northern Italy and in Central-Southern Italy.
A Confrontation among Eight Machine Learning Algorithms for the Prediction of the Future Value of BEDS in Italian Regions
Below we present a comparison of eight different machine-learning algorithms for predicting the value of BEDS. The algorithms are optimized based on their ability to maximize the R-Squared and to minimize the following statistical errors. i.e. MAE-Mean Average Error, MSE-Mean Squared Error, RMSE-Root Mean Squared Error. The algorithms were trained with 70% of the data while the remaining 30% of the data was built for actual prediction. Each algorithm receives a placement within the single ranking for each statistical indicator. Then the placements in the various rankings are added up and the total scores of the algorithms are compared. It therefore follows that the algorithms that have a lower ranking value are those characterized by greater predictive capacity. We have therefore obtained the following ordering of the algorithms by predictive capacity. i.e.:
a) Linear Regression with a payoff value equal to 4;
b) Gradient Boosted Tree with a payoff value of 9;
c) ANN-Artificial Neural Network with a payoff value of 11;
d) Tree Ensemble Regression with a payoff value of 16;
e) Random Forest with a payoff value of 21;
f) PNN-Probabilistic Neural Network with a payoff value of 23;
g) Simple Tree Regression with a payoff value of 28;
h) Polynomial Regression with a payoff value of 32.
Therefore based on the comparison of the numerical values of the statistical indicators as indicated in Table 2.
| Table 2 Statistical Errors and Ranking of Machine Learning Algorithms for the Prediction of Beds | |||||||||
| Algorithm | R^2 | MAE | MSE | RMSE | PAYOFF | ||||
| Rank | Statistics | Rank | Statistics | Rank | Statistics | Rank | Statistics | ||
| Linear Regression | 1 | 0.9777234 | 1 | 0.030966 | 1 | 0.001807 | 1 | 0.042512 | 4 |
| Gradient Boosted Tree | 3 | 0.9592373 | 2 | 0.040485 | 2 | 0.002287 | 2 | 0.047818 | 9 |
| ANN-Artificial Neural Network | 2 | 0.9654742 | 3 | 0.042315 | 3 | 0.002347 | 3 | 0.048446 | 11 |
| Tree Ensemble Regression | 4 | 0.9258912 | 4 | 0.053941 | 4 | 0.004207 | 4 | 0.06486 | 16 |
| Random Forest | 6 | 0.8211493 | 5 | 0.062822 | 5 | 0.007839 | 5 | 0.088536 | 21 |
| PNN-Probabilistic Neural Network | 5 | 0.848639 | 6 | 0.116135 | 6 | 0.018555 | 6 | 0.136216 | 23 |
| Simple Tree Regression | 7 | 0.810946 | 7 | 0.123079 | 7 | 0.022108 | 7 | 0.148688 | 28 |
| Polynomial Regression | 8 | -5.486071 | 8 | 0.512116 | 8 | 0.310068 | 8 | 0.556837 | 32 |
Through the application of the Linear Regression algorithm. It is possible to predict the trend of the BEDS value. Two subgroups of regions have been identified: winning regions i.e. regions in which a growth in the value of BEDS is predicted and losing regions i.e. regions in which a reduction in the value of BEDS is predicted in the Italian regions.
Winning Regions
The Linear Regression algorithm predicts a growth in the BEDS value in these regions. These regions are: Tuscany with +11.45%, Umbria with +10.11%, Emilia Romagna with +9.00%, Molise with +7.92%, Sicily with +6.39%, Campania with +5. 27% , Marche with +3.01%. Trentino Alto Adige with +2.36%, Valle d'Aosta with +1.96%, Veneto with +1.5%, Calabria with +1.32%, Friuli Venezia Giulia with +1.01%, Piedmont with +0.03%.
Losing Regions
Losing regions are regions for which the Linear Regression algorithm predicts a reduction in the BEDS value. i.e.: Sardinia with -5.34%, Lazio with -8.02%, Puglia with -10.33%, Liguria with -13.83%, Lombardy with -25.55%, Abruzzo with -30.42%, Basilicata with -32.26%.
The average value of BEDS is predicted to decrease by a value of -2.844%. The results of the prediction with machine learning algorithms are summarized in Table 3 & Table 4.
| Table 3 Predictions with Linear Regression Algorithm | ||||
| Regions | 2020 | Prediction | Abs Var | % Var |
| Toscana | 61.3 | 68.32 | 7.02 | 11.45 |
| Umbria | 66.2 | 72.895 | 6.69 | 10.11 |
| Emilia Romagna | 94.1 | 102.568 | 8.47 | 9 |
| Molise | 65 | 70.148 | 5.15 | 7.92 |
| Sicilia | 51.4 | 54.684 | 3.28 | 6.39 |
| Campania | 18.8 | 19.79 | 0.99 | 5.27 |
| Marche | 81.1 | 83.54 | 2.44 | 3.01 |
| Trentino-Alto Adige | 132 | 134.706 | 3.11 | 2.36 |
| Valle d'Aosta | 110 | 111.954 | 2.15 | 1.96 |
| Veneto | 91.7 | 93.078 | 1.38 | 1.5 |
| Calabria | 39.7 | 40.223 | 0.52 | 1.32 |
| Friuli-Venezia Giulia | 118 | 119.091 | 1.19 | 1.01 |
| Piemonte | 117 | 116.93 | 0.03 | 0.03 |
| Sardegna | 50.2 | 47.52 | -2.68 | -5.34 |
| Lazio | 44.8 | 41.205 | -3.6 | -8.02 |
| Puglia | 39.9 | 35.778 | -4.12 | -10.33 |
| Liguria | 113 | 97.03 | -15.57 | -13.83 |
| Lombardia | 84.8 | 63.13 | -21.67 | -25.55 |
| Abruzzo | 43.1 | 29.99 | -13.11 | -30.42 |
| Basilicata | 75.1 | 50.87 | -24.23 | -32.26 |
| Average | 74.8 | 72.6725 | -2.128 | -2.844 |
| Table 4 Variables for the Econometric Estimations of Beds | |||
| Variables | Acronym | Definition | Source |
| Beds in residential social-welfare and social-health facilities | BEDS | Beds in social-welfare and social-health residential structures per 10,000 inhabitants. | Istat, Indagine sui presidi residenziali socio-assistenziali e socio-sanitari. |
| Cultural participation far from home | CPAH | Percentage of people aged 14 and over who carry out at least one civic and political participation activity out of the total number of people aged 14 and over. The activities considered are: talk about politics at least once a week; inform yourself about the facts of Italian politics at least once a week; participate online in consultations or votes on social (civic) or political issues (e.g. urban planning, sign a petition) at least once in the 3 months preceding the interview; express opinions on social or political issues through websites or social media at least once in the 3 months preceding the interview. | Istat, Indagine Aspetti della vita quotidiana. |
| Employment rate (20-64 years) | ER | Percentage of employed people aged 20-64 out of the population aged 20-64 | Istat, Rilevazione sulle Forze di lavoro. |
| People you can count on | PYC | Percentage of people aged 14 and over who have non-cohabiting relatives (in addition to parents, children, brothers, sisters, grandparents, grandchildren), friends or neighbors to rely on out of the total number of people aged 14 and over. | Istat, Indagine Aspetti della vita quotidiana. |
| Electoral participation | EP | Percentage of people who voted in the last European Parliament elections out of the total eligible voters. | Ministero dell’Interno |
| Trust in parties | TP | Average score of trust in parties (on a scale of 0 to 10) expressed by people aged 14 and over | Istat, Indagine Aspetti della vita quotidiana. |
| Satisfaction with one's life | S | Percentage of people aged 14 and over who expressed a life satisfaction score between 8 and 10 out of all people aged 14 and over. | Istat, Indagine Aspetti della vita quotidiana. |
| Positive opinion on the future prospects of the | PJFP | Percentage of people aged 14 and over who believe that their personal situation will improve in the next 5 years out of the total number of people aged 14 and over. | Fonte: Istat, Indagine Aspetti della vita quotidiana |
| Pressure resulting from mining activities | PMA | Pressure from non-energy mining activities (cubic meters) per km^2 | |
| Leaks from the municipal water supply | DMW | Percentage of the total volume of total water losses in the municipal drinking water distribution networks (difference between the volume introduced into the network and the volume dispensed authorized) on the total amount of water introduced. | Istat, Censimento delle acque per uso civile. |
| Concern about climate change | CCC | Percentage of people aged 14 and over who consider climate change or the increase in the greenhouse effect and the ozone hole among their top 5 environmental concerns. | Istat, Indagine Aspetti della vita quotidiana. |
| GPs with a number of clients beyond the family doctor threshold | GP | Percentage of general practitioners with a number of patients exceeding the maximum threshold of 1500 patients envisaged by the contract for general practitioners. | Istat, Elaborazione su dati Ministero della salute. |
Conclusions
The level of BEDS is positively associated, among others, to the number of general physicians with a number of clients over the threshold and with the level of life satisfaction. Furthermore, the level of BEDS is negatively associated, among others, to the level of trust in parties and positive future expectations. Essentially, on a strictly economic point of view, we found that the level of BEDS increases with GDP per capita among Italian regions. In fact, the level of BEDS is unequally distributed among Italian regions. The application of cluster analysis shows the presence of two clusters: a cluster of Central-Northern regions and a cluster of Central-Southern regions. The cluster of Central-Northern regions dominates the cluster of Central-Southern regions in terms of BEDS, confirming that the level of BEDS is positively associated to the GDP per capita. Finally, we confront eight machine-learning algorithms for the prediction of the future value of BEDS among Italian regions and we find that the average value of BEDS is expected to decrease by a value of 2.844%.
Declarations
Data Availability Statement
The data presented in this study are available on request from the corresponding author.
Funding
The authors received no financial support for the research, authorship, and/or publication of this article.
Declaration of Competing Interest
The authors declare that there is no conflict of interests regarding the publication of this manuscript. In addition, the ethical issues, including plagiarism, informed consent, misconduct, data fabrication and/or falsification, double publication.
Software
The authors have used the following software: Gretl for the econometric models, Orange for clusterization and network analysis, and KNIME for machine learning and predictions. They are all free version without licenses.
Acknowledgements
We are grateful to the teaching staff of the LUM University “Giuseppe Degennaro” and to the management of the LUM Enterprise s.r.l. for the constant inspiration to continue our scientific research work undeterred.
Appendix
Fixed-effects. using 358 observations
Included 20 cross-sectional units
Time-series length: minimum 17. maximum 19
Dependent variable: A107(Table 5)
| Table 5 Dependent Variable | |||||
| Coefficient | Std. Error | t-ratio | p-value | ||
| const | −35.0219 | 2.69077 | −13.02 | <0.0001 | *** |
| A8 | 0.788413 | 0.210753 | 3.741 | 0.0002 | *** |
| A11 | −0.339248 | 0.047698 | −7.112 | <0.0001 | *** |
| A35 | 0.491345 | 0.042059 | 11.68 | <0.0001 | *** |
| A42 | 0.259715 | 0.03912 | 6.639 | <0.0001 | *** |
| A45 | −7.55192 | 1.85968 | −4.061 | <0.0001 | *** |
| A64 | 1.58405 | 0.08843 | 17.91 | <0.0001 | *** |
| A66 | −1.73886 | 0.393742 | −4.416 | <0.0001 | *** |
| A73 | −0.0555486 | 0.010412 | −5.335 | <0.0001 | *** |
| A84 | 0.327559 | 0.05596 | 5.853 | <0.0001 | *** |
| A94 | 0.352394 | 0.168697 | 2.089 | 0.0375 | ** |
| A120 | 1.84932 | 0.133679 | 13.83 | <0.0001 | *** |
Joint test on named regressors -
Test statistic: F(11. 327) = 155.832
with p-value = P(F(11. 327) > 155.832) = 7.93307e-123
Test for differing group intercepts -
Null hypothesis: The groups have a common intercept
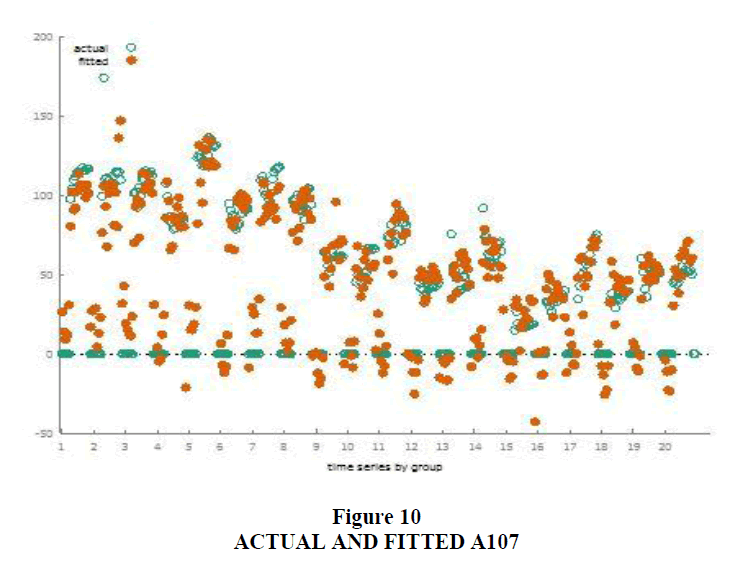
Test statistic: F(19. 327) = 14.4619 (Table 6 & Figure 10)
| Table 6 Joint Test | |||
| Mean dependent var | 48.10196 | S.D. dependent var | 42.52565 |
| Sum squared resid | 80270.43 | S.E. of regression | 15.66765 |
| LSDV R-squared | 0.875667 | Within R-squared | 0.839796 |
| LSDV F(30. 327) | 76.76801 | P-value(F) | 3.0e-129 |
| Log-likelihood | −1476.840 | Akaike criterion | 3015.679 |
| Schwarz criterion | 3135.976 | Hannan-Quinn | 3063.521 |
| rho | 0.338832 | Durbin-Watson | 1.225763 |
with p-value = P(F(19. 327) > 14.4619) = 4.65576e-33
Random-effects (GLS). using 358 observations
Using Nerlove's transformation
Included 20 cross-sectional units
Time-series length: minimum 17. maximum 19
Dependent variable: A107(Table 7)
| Table 7 Dependent Variable | |||||
| Coefficient | Std. Error | z | p-value | ||
| const | −34.0532 | 4.58957 | −7.420 | <0.0001 | *** |
| A8 | 0.841936 | 0.208315 | 4.042 | <0.0001 | *** |
| A11 | −0.332156 | 0.0474185 | −7.005 | <0.0001 | *** |
| A35 | 0.494835 | 0.0417791 | 11.84 | <0.0001 | *** |
| A42 | 0.263246 | 0.0389199 | 6.764 | <0.0001 | *** |
| A45 | −7.93552 | 1.84495 | −4.301 | <0.0001 | *** |
| A64 | 1.60818 | 0.0876359 | 18.35 | <0.0001 | *** |
| A66 | −1.82424 | 0.387728 | −4.705 | <0.0001 | *** |
| A73 | −0.0537397 | 0.0102287 | −5.254 | <0.0001 | *** |
| A84 | 0.338083 | 0.0554179 | 6.101 | <0.0001 | *** |
| A94 | 0.379357 | 0.166667 | 2.276 | 0.0228 | ** |
| A120 | 1.76026 | 0.126468 | 13.92 | <0.0001 | *** |
'Between' variance = 262.126
'Within' variance = 224.219
mean theta = 0.786374
Joint test on named regressors -
Asymptotic test statistic: Chi-square(11) = 1740
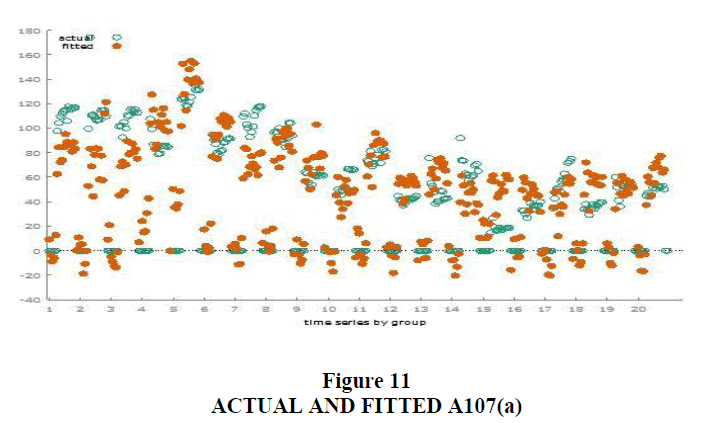
with p-value = 0 (Table 8 & Figure 11)
| Table 8 Joint Test | ||||
| Mean dependent var | 48.10196 | S.D. dependent var | 42.52565 | |
| Sum squared resid | 164797.3 | S.E. of regression | 21.79267 | |
| Log-likelihood | −1605.597 | Akaike criterion | 3235.194 | |
| Schwarz criterion | 3281.760 | Hannan-Quinn | 3253.714 | |
| rho | 0.338832 | Durbin-Watson | 1.225763 | |
Breusch-Pagan test -
Null hypothesis: Variance of the unit-specific error = 0
Asymptotic test statistic: Chi-square(1) = 408.593
with p-value = 7.41989e-91
Hausman test -
Null hypothesis: GLS estimates are consistent
Asymptotic test statistic: Chi-square(11) = 14.5774
with p-value = 0.202674
Pooled OLS. using 358 observations
Included 20 cross-sectional units
Time-series length: minimum 17. maximum 19
Dependent variable: A107(Table 9 & Table 10)
| Table 9 Values | |||||
| Coefficient | Std. Error | t-ratio | p-value | ||
| const | −27.3986 | 2.84221 | −9.640 | <0.0001 | *** |
| A8 | 1.24040 | 0.257449 | 4.818 | <0.0001 | *** |
| A11 | −0.241138 | 0.0614088 | −3.927 | 0.0001 | *** |
| A35 | 0.530841 | 0.0534514 | 9.931 | <0.0001 | *** |
| A42 | 0.289622 | 0.0511866 | 5.658 | <0.0001 | *** |
| A45 | −13.1738 | 2.29963 | −5.729 | <0.0001 | *** |
| A64 | 1.91163 | 0.108464 | 17.62 | <0.0001 | *** |
| A66 | −2.40332 | 0.443178 | −5.423 | <0.0001 | *** |
| A73 | −0.0471706 | 0.0112928 | −4.177 | <0.0001 | *** |
| A84 | 0.383437 | 0.0703680 | 5.449 | <0.0001 | *** |
| A94 | 0.578863 | 0.197261 | 2.934 | 0.0036 | *** |
| A120 | 1.19812 | 0.0994641 | 12.05 | <0.0001 | *** |
| Table 10 Dependent Variable | |||
| Mean dependent var | 48.10196 | S.D. dependent var | 42.52565 |
| Sum squared resid | 147721.3 | S.E. of regression | 20.66253 |
| R-squared | 0.771191 | Adjusted R-squared | 0.763917 |
| F(11. 346) | 106.0163 | P-value(F) | 1.2e-103 |
| Log-likelihood | −1586.016 | Akaike criterion | 3196.033 |
| Schwarz criterion | 3242.599 | Hannan-Quinn | 3214.552 |
| rho | 0.600746 | Durbin-Watson | 0.781108 |
WLS. using 358 observations
Included 20 cross-sectional units
Dependent variable: A107
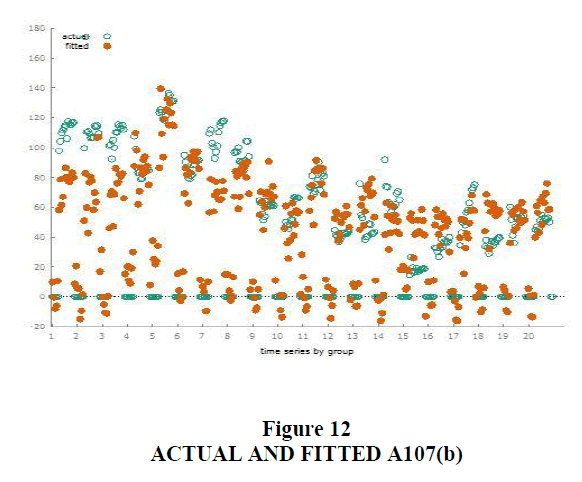
Weights based on per-unit error variances (Table 11, Table 12 & Figure 12)
| Table 11 Statistics Based on the Weighted Data | |||
| Sum squared resid | 334.1126 | S.E. of regression | 0.982672 |
| R-squared | 0.821912 | Adjusted R-squared | 0.816251 |
| F(11. 346) | 145.1694 | P-value(F) | 2.3e-122 |
| Log-likelihood | −495.6192 | Akaike criterion | 1015.238 |
| Schwarz criterion | 1061.805 | Hannan-Quinn | 1033.758 |
| Table 12 Statistics Based on the Original Data | |||
| Mean dependent var | 48.10196 | S.D. dependent var | 42.52565 |
| Sum squared resid | 154564.2 | S.E. of regression | 21.13569 |
1-step dynamic panel. using 319 observations
Included 20 cross-sectional units
Time-series length: minimum 15. Maximum 17
Dependent variable: A107 ( Table 13 & Figure 13)
| Table 13 Dependent Variable | |||||
| Coefficient | Std. Error | z | p-value | ||
| A107(-1) | 0.345156 | 0.0673420 | 5.125 | <0.0001 | *** |
| A8 | 0.874760 | 0.182309 | 4.798 | <0.0001 | *** |
| A11 | −0.268937 | 0.0281669 | −9.548 | <0.0001 | *** |
| A35 | 0.440772 | 0.0539024 | 8.177 | <0.0001 | *** |
| A42 | 0.322939 | 0.0282989 | 11.41 | <0.0001 | *** |
| A45 | −8.15737 | 2.20212 | −3.704 | 0.0002 | *** |
| A64 | 0.822357 | 0.117455 | 7.001 | <0.0001 | *** |
| A66 | −2.26130 | 0.490977 | −4.606 | <0.0001 | *** |
| A73 | −0.0614516 | 0.0150616 | −4.080 | <0.0001 | *** |
| A84 | 0.286898 | 0.0474918 | 6.041 | <0.0001 | *** |
| A94 | 0.605207 | 0.186883 | 3.238 | 0.0012 | *** |
| A120 | 1.67219 | 0.258387 | 6.472 | <0.0001 | *** |
References
Abdulla, F., Nain, Z., Karimuzzaman, M., Hossain, M. M., & Rahman, A. (2021). A non-linear biostatistical graphical modelling of preventive actions and healthcare factors in controlling COVID19 pandemic. International Journal of Environmental Research and Public Health, 18(9), 4491.
Indexed at, Google Scholar, Cross Ref
Berridge, C., Halpern, J., & Levy, K. (2019). Cameras on beds: The ethics of surveillance in nursing home rooms. AJOB empirical bioethics, 10(1), 55-62.
Indexed at, Google Scholar, Cross Ref
Capolongo, S., Gola, M., Brambilla, A., Morganti, A., Mosca, E. I., & Barach, P. (2020). COVID-19 and healthcare facilities: A decalogue of design strategies for resilient hospitals. Acta Bio Medica: Atenei Parmensis, 91(9-S), 50.
Indexed at, Google Scholar, Cross Ref
Chowdhury, S., Mok, D., & Leenen, L. (2021). Transformation of health care and the new model of care in Saudi Arabia: Kingdom’s Vision 2030. Journal of Medicine and Life, 14(3), 347.
Indexed at, Google Scholar, Cross Ref
Daumas, R. P., Silva, G. A., Tasca, R., Leite, I. D. C., Brasil, P., Greco, D. B., & Campos, G. W. D. S. (2020). The role of primary care in the Brazilian healthcare system: limits and possibilities for fighting COVID-19. Cadernos de saude publica, 36.
Indexed at, Google Scholar, Cross Ref
Denver, H. (2005). National Hospital Available Beds for Emergencies and Disasters ( HAvBED ), AHRQ Publication No. 05-0103.
Hosokawa, R., Ojima, T., Myojin, T., Aida, J., Kondo, K., & Kondo, N. (2020). Associations between healthcare resources and healthy life expectancy: a descriptive study across secondary medical areas in Japan. International journal of environmental research and public health, 17(17), 6301.
Indexed at, Google Scholar, Cross Ref
Jacques, C. C., McIntosh, J., Giovinazzi, S., Kirsch, T. D., Wilson, T., & Mitrani-Reiser, J. (2014). Resilience of the Canterbury hospital system to the 2011 Christchurch earthquake. Earthquake spectra, 30(1), 533-554.
Indexed at, Google Scholar, Cross Ref
Kumar, A., Nayar, K. R., & Koya, S. F. (2020). COVID-19: Challenges and its consequences for rural health care in India. Public Health in Practice, 1, 100009.
Indexed at, Google Scholar, Cross Ref
Losonczy, L. I., Barnes, S. L., Liu, S., Williams, S. R., McCurdy, M. T., Lemos, V., & Research and Education consortium for Acute Care in Haiti (REACH) Study Group. (2019). Critical care capacity in Haiti: a nationwide cross-sectional survey. PLoS One, 14(6), e0218141.
Indexed at, Google Scholar, Cross Ref
Mahendradhata, Y., Andayani, N. L. P. E., Hasri, E. T., Arifi, M. D., Siahaan, R. G. M., Solikha, D. A., & Ali, P. B. (2021). The capacity of the Indonesian healthcare system to respond to COVID-19. Frontiers in public health, 9, 649819.
Indexed at, Google Scholar, Cross Ref
Ouma, P. N., Masai, A. N., & Nyadera, I. N. (2020). Health coverage and what Kenya can learn from the COVID-19 pandemic. Journal of Global Health, 10(2).
Indexed at, Google Scholar, Cross Ref
Qiu, L., Yang, L., Li, H., & Wang, L. (2023). The impact of health resource enhancement and its spatiotemporal relationship with population health. Frontiers in Public Health, 10, 1043184.
Indexed at, Google Scholar, Cross Ref
Rodríguez, A. L., Aranda, Z., Brun, E., DiChiara, S., Esquinca, A., González, E., & Chacón-Hernández, S. (2023). A comprehensive and healthcare equity promoting response by a civil society–public partnership to COVID-19 in Chiapas, Mexico. BMJ global health, 8(3), e011244.
Indexed at, Google Scholar, Cross Ref
Silva, L. L., Carvalho Dutra, A. D., Andrade, L. D., Iora, P. H., Rodrigues Ramajo, G. L., Peres Gualda, I. A., ... & Fressatti Cardoso, R. (2021). Emergency care gap in Brazil: geographical accessibility as a proxy of response capacity to tackle COVID-19. Frontiers in Public Health, 9, 740284.
Indexed at, Google Scholar, Cross Ref
Srimayarti, B. N., Leonard, D., & Yasli, D. Z. (2021). Determinants of Health Service Efficiency in Hospital: A Systematic Review. International Journal of Engineering, Science and Information Technology, 1(3), 87-91.
Indexed at, Google Scholar, Cross Ref
Tyrrell, C. S., Mytton, O. T., Gentry, S. V., Thomas-Meyer, M., Allen, J. L. Y., Narula, A. A., & Pari, A. A. A. (2021). Managing intensive care admissions when there are not enough beds during the COVID-19 pandemic: a systematic review. Thorax, 76(3), 302-312.
Indexed at, Google Scholar, Cross Ref
Zawiah, M., Al-Ashwal, F. Y., Saeed, R. M., Kubas, M., Saeed, S., Khan, A. H., & Abduljabbar, R. (2020). Assessment of healthcare system capabilities and preparedness in Yemen to confront the novel coronavirus 2019 (COVID-19) outbreak: a perspective of healthcare workers. Frontiers in public health, 8, 419.
Indexed at, Google Scholar, Cross Ref
Received: 03-Oct-2023 Manuscript No. AAFSJ-23-14092 ; Editor assigned: 04-Oct-2023, PreQC No. AAFSJ-23-14092 (PQ); Reviewed: 15-Oct-2023, QC No. AAFSJ-23-14092 ; Revised: 21-Oct-2023, Manuscript No. AAFSJ-23-14092 (R); Published: 30-Oct-2023
