Research Article: 2023 Vol: 27 Issue: 1S
Behavioral Factors Influencing Individual Investment Decision in Amhara Region of Ethiopia
Adane Agegn, Debark University
Citation Information: Agegn, A. (2023). Behavioral factors influencing individual investment decision in amhara region of ethiopia. Academy of Accounting and Financial Studies Journal, 27(S1), 1-12
Abstract
This study examined behavioral factors influencing investment decision using micro-level data from individual investors in Amhara Region of Ethiopia. The study employed an explanatory research design with a target population of individual investors who invest their money in manufacturing, trade and service sectors. Data collected using survey questionnaire from 235 individual investors. The empirical results using multinomial logistic regression revealed that representativeness bias, mental accounting, loss aversion bias, regret aversion bias and herding behavior has significant influence on investment decision of individual investors. Accordingly, government should give attention through formulating and implementing better policies to minimize negative impact of behavioral factors on investment decision, and investors should evaluate information objectively and independently before relying on others investor’s action.
Keywords
Behavioral Finance, Individual Investors, Multinomial Logistic Regression, Psychological Factor.
Introduction
In earlier finance theory, investor’s psychology and feeling is not considered as influencing factor of investment decision, and it assumes that investors are rational and make investment decision based on fundamental factor particularly on risk –return trade off model. However, the modern theory of finance known as behavioral finance theory is emerged opposing the assumption of earlier finance theory inferring that investors are irrational and their investment decision would be influenced by different psychological and cognitive bias such as fear of losing money, herding behavior, regret, overconfidence, excessive dependence on past experience, reliance only on easily available information (Kahneman & Tversky, 1979). It also assumes that investors make investment decision based on the way of mental factor and rule of thumb not only directed by traditional finance rule of risk-return trade-off model (Budhiraja, 2018).
Many behavioral finance theories have been developed by different scholars among those the most popular theories and concerns of this study are; prospect theory, heuristic theory, and herding theory. For this study, investors are those who invest money with intention of generating return in the future (Damodaran, 2014). Behavioral factors may sometimes help individual investors during investment decision making yet they are not reliable tool because they do not include important fundamental factors which guide rational investment decision making process and leads bias on investment decision and result market inefficiency (Budhiraja, 2018) Selecting best investment option among many with the intention of future return is not an easy task, rather it needs careful evaluation and analysis of each investment alternatives in order to decide investment mix, time horizon and amount of fund (Subrahmanyam, 2008). Investors use short cut method which is called behavioral factors due to many investment alternatives available, lack of knowledge about valuation system, time to analysis, and other constraints (Karanja, 2017). These factors may lead bias on investment decision, which consequently leads to huge financial loss, make investor out of competitor and make market inefficient (Wamae, 2013). Existing literatures evidenced that investors are usually not rational in their choice of investment alternatives instead they use their mental short cut methods rather than the looking the nature of the market and evaluate information objectively.
Many empirical studies have been done on the issues of behavioral finance and its impact on investment decision in different countries. For instance, (Bakar & Yi, 2016), (Kengatharan & Kengatharan, 2014), (Mahanthe & Sugathadasa, 2018), (Onsomu, 2014), (Rekik & Boujelbene, 2013), and (Subrahmanyam, 2008), among others, examined the influence of behavioral factors on investment decision and their findings generally support the behavioral finance theories. Indeed, empirical studies come up with inconclusive and contradictory judgments on the actual behavioral factors influencing individual investment decision and none of them concluded it single handedly. Besides, most existing studies have focused on investment decisions on organized stock markets with little attention to individual investor’s investment decision in real asset investment alternatives. Therefore, it is plausible to empirically examine the effect of behavioral factors on investment decision of individual investors in Amhara region of Ethiopia.
Related Literature Review
Behavioral bias are human factor that influence investment decision process and affect choice on how, when and where to put money for future return without careful analysis and evaluation of each investment options objectively (Ojwang, 2011). There are three theories namely; heuristic, herding theory.
Heuristic Theory
According to Ritter (2003) heuristics are shortcut method, which makes investment decision making process easier in unusual and uncertain environment by reducing the difficulty of situation and anticipating values through investors their own subjective prediction and evaluation. But, it is not right mechanism for investment decision making and it ignores important fundamental factors that affect investment decision rationally and create bias on individual investor’s investment decision (Budhiraja, 2018) and thus this study addressed representativeness bias, availability bias and overconfidence bias and their effect on investment decision as follows.
Overconfidence is overestimating the reliability of their knowledge and skill than others (Debondt, 1995). It causes investors to underrate uncertainty and overestimate their ability and made them to think themselves they are more knowledgeable than they actually are and from others (Odean, 1998) and belief on their knowledge only as true and ignore the threat related with investing activities (Khalid et al., 2018) and this made them to earn less return from their large amount of money because of their overconfidence (Hirshleifer, 2001) and others are less interested to diversify their investment activities rather they invest too much fund in what one is familiar with and better skilled (Ritter, 2003). However, it’s only overconfidence comes from having enough knowledge and skill regarding helps for greater achievement and improve their investment decision process and increase rationalities of the investors than the former (Damodaran, 2014). Accordingly, the study hypothesized that overconfidence bias have significant influence on individual investment decision.
Representativeness refers to the extent to which an event look like its population and it causes investors to put too much weight on recent experience and forget the average long term experience and future event (Tversky & Khaneman, 1974). This led investors to assume investments that had good performance as good in future and they tend to choice which actually might not happened (Budhiraja, 2018). Moreover, it causes investors fail to consider current situation of each investment alternatives particularly the demand and supply of each investment option instead they make investment decision based on past experience not consider current as well as future condition of the market than evaluating objectively (Ojwang, 2011). Accordingly, the study hypothesized that representativeness bias have significant influence on individual investment decision.
Availability bias happens when individual investors use easily accessible information excessively to make investment decision and forget hidden information (Budhiraja, 2018) and information that has been recently available in the news or has been heard from peers but ignore invisible information that may be very essential to investment decision making (Suzaida, 2016). However, information that can be easily remembered and recalled was not enough to make investment decision objectively and used only available information to make investment decision may leads to wrong investment decision making (Damodaran, 2014). Accordingly, the study hypothesized that availability bias have significant influence on individual investment decision.
Prospect Theory
Prospect theory developed by Kahneman & Tversky (1979) states that there are persistent bias motivated by psychological factor that influence investment choice under the condition of uncertainty and they states that investor have irrational propensity to less willing to gamble with profit than loss and it stress over the subjective decision of investor which are influenced by investors system of valuation and perception and also found that investor underweight outcome that are probable in comparison with certain because of misunderstanding on meaning of probabilities which are explained as follows as loss and regret aversion and mental accounting.
Loss aversion explains how people gauge decision under uncertainty. It is mental penalty associated with loss is greater than reward from equal amount of gain since naturally, individual dislike lose than they enjoy winning. Loss aversion influence investor in that they will be slow to invest in risky investment alternatives that generate high return to avoid loss and mostly invest in less risky investment alternatives that generate less return (Karanja, 2017). Accordingly, the study hypothesized that loss aversion bias have significant influence on individual investment decision.
Mental accounting is the process by which investor analyzes their investment decision (Lad, 2018). Thaler (1999) noted that mental accounting include three components; the first components capture how outcomes are perceived, evaluated and decided, the second component the how activities assigned and allocated to specific account in monitoring in flow and out flow of money from each specific mental account separately and differently, and the third component concerns with the frequency of account evaluation like daily, weekly, and monthly or yearly depend on the nature of the activities assigned to specific mental account. However, it causes investors manage and organize their investment activities in different accounts (Ritter, 2003).
Accordingly, the study hypothesized that mental accounting have significant influence on individual investment decision.
Regret is a negative feeling occur after individual made error, even small error (Shiller, 1999). Investor refuse regret by delay selling asset that have gone down in value and accelerate the selling of the asset that have risen in value and investor tend to be more regretful about holding losing asset too long than selling winning ones too soon (Kahneman & Tversky, 1979). It’s also an emotion in which people tend to avoid making decisions that will result in action out of fear that the decision will turn out poor (Pompains, 2012). Accordingly, the study hypothesized that regret aversion have significant influence on individual investment decision.
Herding Theory
Shiller (2000), state that people are influenced by their social and environment interaction and they are often pressured to follow others action and they believe when large group of people is common in its judgment they are certainly right. Lifestyle and fashion are good example of herd behavior that people are always pressured to copy, and psychologically, imitation has often been assumed to be derived by behavioral bias of human nature itself (Hirshleifer, 2001). In line with this, when individual investors want to invest large amount of money, they tend to follow the others’ actions in order to reduce the fear of losing money (Debondt, 1995). They may rationally follow the action of the other investors whom they perceive to have access to unpublished or hidden information in the market than individual. Both irrational and irrational herding explain investors do not make their investment decision based on careful analysis and evaluation of information objectively Christie-Huang as cited in (Bui, 2015). However, investment decision needs careful analysis and evaluation of available investment avenues in order to select best investment alternatives (Huetone, 2014). Accordingly, the study hypothesized that herd behaviors have significant influence on individual investment decision.
Materials and Methods
For collecting and analyzing data in a way that find to combine relevance of research purpose to the economy in the procedure (Kothari, 2004), an explanatory research design was employed to offer insight in measuring causal relationship between behavioral factors and investment decision of individual investors by taking a sample of 235 individual investors in Amhara region of Ethiopia. The survey is conducted in 2020 on private investors in three investment alternatives including manufacturing, service and trade sectors due to the fact that these sectors are core for economic policy and development of Ethiopia.
The survey questionnaire was distributed with exactly with the same phrasing and in the same order for all respondents. Additionally, to assure quality of survey questions and to ensure quality of data collected, a trained research assistants were hired that would help respondents aware each question. Moreover, the questionnaire was distributed in the form of Amharic version so as to include both illiterate and literate investors as well as all respondents were necessarily speaker of the aforesaid language (Smith, 2019).
In this study, a quantitative data analysis technique was used to explain the population from the sample via descriptive and inferential statistics tools in order to organize, summarize, analyze and explain the data. Hence, up on competition of data collection, data were edited, coded and entered into SPSS version 20 and a series of Likert type item that represent similar feature were combined into single composite variable by using mean index and it was analyzed through a multinomial logistics regression model (MNLRM) to determine the effect of independent variable on dependent variable with holding other variables constant by using probability. Categorical variable independent variables in the form five point Likert was combined into two categories as 1 stands for (Yes) and 0 stands for (no). In this study the dependent variable investment decision is meant for investment choice categorized in to manufacturing, service and trade sectors hypothesized to be influenced Availability bias (investor focus on available information only may create bias on investment decision), Representativeness bias (investors predict future performance based on previous activities lone), Overconfidence bias (investors overestimate them than other), Loss aversion bias (fear of lose originated from investment activities), Regret aversion bias (mental penalty originated from mistake), Mental accounting bias (separating of each investment activities in mental compartment) and Herd behavior (investors imitate others action than through financial analysis).
In this study the dependent variable was measured by investment choice which was categorized in to three. Hence, multinomial logistic regression model was employed to analyze this outcome variable, it had three categories, 0 investment in manufacturing sector, 1 investment in service sector and 2 investment in trade sector.
At this point, the independent variable hypothesized as those explanatory variables (behavioral factors) affect response variable (investment decision) in the study area. Accordingly, based on review of different literature and research finding, seven potential explanatory variables were explained such as availability bias, representativeness bias, overconfidence bias, loss aversion bias, regret aversion bias, mental accounting bias and herd behavior which all were called behavioral factors expected to have influence on individual investment decision in Amhara region of Ethiopia Table 1.
| Table 1 Description Of Variables Used In Multinomial Logistic Regression |
||
|---|---|---|
| Variables | Variable description | Scale |
| Investment decision | Categorical variable: 0 if investment in manufacturing,1 investment in service and 2 investment in trade | Nominal |
| Availability bias | Categorical:1strongly disagree, 2 disagree, 3 neutral, 4 agree and 5 strongly agree | Ordinal |
| Representativeness bias | Categorical: 1strongly disagree, 2 disagree, 3 neutral, 4 agree and 5 strongly agree | Ordinal |
| Overconfidence bias | Categorical: 1strongly disagree, 2 disagree, 3 neutral, 4 agree and 5 strongly agree | Ordinal |
| Loss aversion bias | Categorical: 1strongly disagree, 2 disagree, 3 neutral, 4 agree and 5 strongly agree | Ordinal |
| Regret aversion bias | Categorical: 1strongly disagree, 2 disagree, 3 neutral, 4 agree and 5 strongly agree | Ordinal |
| Mental accounting bias | Categorical: 1strongly disagree, 2 disagree, 3 neutral, 4 agree and 5 strongly agree | Ordinal |
| Herd behavior | Categorical: 1strongly disagree, 2 disagree, 3 neutral, 4 agree and 5 strongly agree | Ordinal |
In this study a multinomial logistic regression model was employed since it has more than two nominal or unordered categories to identify factors that affect investment decision in the study area (Gujarati, 2004). Like that of binominal logistic regression model, multinomial logistic regression model uses maximum likelihood estimation to analyze the probability of categorical membership (Brooks, 2008). Among categorized dependent variable 0 (manufacturing sector) was used as reference category and the likelihood of membership in other category is compared with the likelihood of membership in reference category to explain relationship between dependent variables and independent variables.
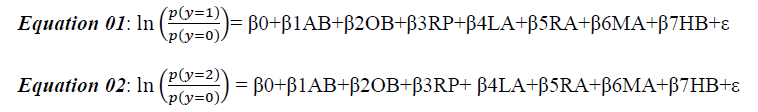
Where,
Y is dependent variable, investment decision measured by investment alternative (manufacturing, service and trade) in which manufacturing is a reference category. AB, RP, OB, LA, RA, MA, HB are independent variables (behavioral factors).
Where,
AB= Availability Bias
RP= Representativeness bias
OB= Overconfidence bias
LA= loss aversion bias
RA=regret aversion bias
MA =mental accounting bias
HB =Herd behavior
ε= error term
And β1, β2, β3, β4, β5, β6, β7 in the first and second regression equations are regression coefficients representing the change in probability of investing in service and trade respectively as compared to manufacturing resulting due to X.
To avoid the doubt of questions and to know understanding of respondents, Chronbach’s Alpha was used to measure internal consistency of the instrument before doing empirical analysis and to assure the reliability of measurement for further analysis and a 0.79 was scored.
Results and Discussion
As shown in the following Table 2, a correlation results showed that availability bias, representativeness bias, overconfidence, loss aversion, and regret aversion has a positive correlation with investment decision measured by investment choice with decimal points of 0.038, 0.085, 0.013, 0.056 and 0.0201, respectively. However, mental accounting and herding behavior has a negative correlation with investment decision with negative coefficients of 0.081 and 0.011 respectively and the significant variable was identified at 5% significance level.
| Table 2 Correlation Analysis |
||||||||
|---|---|---|---|---|---|---|---|---|
| Variable | ID | AB | RB | OB | LA | RA | MA | HB |
| ID | 1.00 | |||||||
| AB | 0.038 | 1.00 | ||||||
| RB | 0.085 | 0.051 | 1.00 | |||||
| OB | 0.013 | 0.104 | 0.187 | 1.00 | ||||
| LA | 0.056 | 0.045 | 0.322 | 0.480 | 1.00 | |||
| RA | 0.201 | 0.055 | 0.183 | 0.261 | 0.219 | 1.00 | ||
| MA | -0.081 | 0.044 | -0.097 | 0.042 | -0.044 | 0.148 | 1.00 | |
| HB | -0.011 | 0.161 | 0.157 | 0.249 | 0.249 | 0.211 | 0.064 | 1.00 |
Source: Survey data (2020)
The result from deviance and Pearson test displayed that data at chi-square of 180.443 and 175.196 at degree of freedom 158 and at P-value greater than 0.05 and it inferred that the model fit the data well.
The model resulted model fitting information which had a chi-square value of 249.711 with degree of freedom 14 and statistically significant at 5% significance level.
Moreover, the strength of the model was tested by using pseudo R- square such as cox - Snell R -square and Nagerlkere R square value, which explained the amount of variation of dependent variable by predicted independent variable yet there are many R - square calculation method especially in MNLRM the SPSS output shows three R square and still no agreement on which is best measure of model and the pseudo Square value of Nagerlkere R-square showed 26.2%.
The predictive accuracy of the model show that from investment alternative included in the cell in the diagonal were correctly predicted which is about 51.9% manufacturing, 62.0% service and 50.7% trade with overall classification accuracy 54.9% case were correctly predicted.
Likelihood ratio test determines the overall relationship between each independent variable and dependent variable whereas the Wald’s test determines significant independent variables differentiated between each category of dependent variables and presented in the following Table 3.
| Table 3 Likelihood Ratio Test |
||||
|---|---|---|---|---|
| Effect | Model fitting criteria | Likelihood ratio test | ||
| -2log likelihood of reduced model | Chi-Square | DF | Sig. | |
| Intercept | 249.711a | 0.000 | 0 | . |
| AB | 250.161 | 0.450 | 2 | 0.798 |
| RP | 261.193 | 11.483 | 2 | 0.003 |
| OB | 250.919 | 1.209 | 2 | 0.546 |
| LA | 256.516 | 6.805 | 2 | 0.033 |
| RA | 260.507 | 10.796 | 2 | 0.005 |
| MA | 265.673 | 15.962 | 2 | 0.000 |
| HB | 260.756 | 11.046 | 2 | 0.004 |
Source: Survey data (2020)
In this study, the first category of the dependent variable manufacturing was taken as reference category and category (yes) in independent variable was taken as reference category and result interpreted accordingly. The validity of the model was measured by p- value, the model was found to be significant at 5% significance level and MNLRM beta coefficient taken different value for each category of dependent variable and the odd ratio for each category varies. The influence of each independent variable on dependent variable in MNLRM is varies from each other for each dependent and independent category, this is due to the nature of Likert scale data which is not treated as continuous and nature of the model. Whereas, the influence of independent variable in the log it that compares first category (reference) category and second category was denoted by β1. The influences of independent variable in the log it compare the first (reference) category with third category denoted by β1. The intercept in the MNLRM constructed was different for each category and it’s interpreted as how much the probability higher or lower as compared to reference category. The results of multinomial logistics regression /MNLRM/ result are shown below Table 4.
| Table 4 Coefficient, Standard Deviation, Probability Estimates, And P-Value Of Mnlrm Regression |
|||||||||
|---|---|---|---|---|---|---|---|---|---|
| Reference category Manufacturing |
Beta/ Coefficient |
Standard Error |
Wald | Df | Sig | Exp (B) | 95 CI of exp (B) | ||
| Lower | Upper | ||||||||
| Service | Intercept | -0.086 | 0.310 | 0.077 | 1 | 0.782 | . | . | . |
| AB=(no) | -0.223 | 0.366 | 0.371 | 1 | 0.542 | 0.800 | 0.391 | 1.639 | |
| RP=(no) | -1.866 | 0.619 | 9.097 | 1 | 0.003 | 0.155 | 0.046 | 0.520 | |
| OB=(no) | -0.327 | 0.391 | 0.697 | 1 | 0.404 | 0.721 | 0.336 | 1.553 | |
| LA=(no) | -0.928 | 0.431 | 4.630 | 1 | 0.031 | 0.395 | 0.170 | 0.921 | |
| RA=(no) | -0.439 | 0.392 | 1.250 | 1 | 0.264 | 0.645 | 0.299 | 1.391 | |
| MA=(no) | 1.451 | 0.379 | 14.621 | 1 | 0.000 | 4.268 | 2.028 | 8.978 | |
| HB=(no) | 1.352 | 0.437 | 9.573 | 1 | 0.002 | 3.864 | 1.641 | 9.098 | |
| Trade | Intercept | 0.151 | 0.293 | 0.268 | 1 | 0.603 | 0.000 | 0.000 | 0.000 |
| AB=(no) | -0.184 | 0.342 | 0.288 | 1 | 0.591 | 0.832 | 0.426 | 1.627 | |
| RP=(no) | -0.403 | 0.418 | 0.931 | 1 | 0.335 | 0.668 | 0.295 | 1.516 | |
| OB=(no) | 0.079 | 0.358 | 0.049 | 1 | 0.825 | 1.083 | 0.537 | 2.184 | |
| LA=(no) | 0.092 | 0.383 | 0.057 | 1 | 0.811 | 1.096 | 0.517 | 2.324 | |
| RA=(no) | -1.261 | 0.401 | 9.870 | 1 | 0.002 | 0.283 | 0.129 | 0.622 | |
| MA=(no) | 0.608 | 0.382 | 2.529 | 1 | 0.112 | 1.836 | 0.868 | 3.883 | |
| HB=(no) | 0.301 | 0.412 | 0.534 | 1 | 0.465 | 1.351 | 0.603 | 3.027 | |
Reference category is manufacturing.
Source: Survey data (2020)
Categorical Comparison of Service versus Manufacturing
The probability of individual investors who have no representativeness bias to invest in service sector as compared with invest in manufacturing sector was 0.155 times lower than that of individual investor who have representativeness bias. This implied that individual investors who have representativeness bias had more probability of investing in service sector than manufacturing sector. This was statistically significant at 5% significance level.
The probability of individual investor who have no loss aversion bias to invest in service sector as compared with invest in manufacturing sector was 0.395 times lower than that of individual investors who have loss aversion bias. In other ward individual investors who have loss aversion bias had more probability of investing in service sector than manufacturing sector.
This was statistically significant at 5% significance level.
The probability of individual investor who have no mental accounting bias to invest in service sector as compared with invest in manufacturing sector was 4.268 times higher than that of investor who have mental accounting bias. This implied those individual investors who have mental accounting bias had less probability of investing in service than manufacturing. This was statistically significant at 5% significance level.
The probability of individual investors who have no herding behavior to invest in service sector as compared with invest in manufacturing sector was 3.648 times higher than that of individual investors who have herd behavior. This implied those individual investors who have herding behavior had more probability of investing in manufacturing. This was statistically significant at 5% significance level.
Categorical Comparison of Trade versus Manufacturing
The probability of individual investor who have no regret aversion bias to invest in trade sector as compared with invest in manufacturing sector was 0.128 times lower than that of investors who have loss aversion bias. This implied that the individual investors who had regret aversion bias had more probability of investing in trade than manufacturing. This was statistically significant at 5% significance level (Javed, 2017).
Hypothesis testing
The first hypothesis hypothesized that availability bias have significant influence on individual investment decision but the regression result yield a p-value of 0.798 Table 3. It shows that availability bias have insignificant impact on individual investment decision. This finding is inconsistent with Budhiraja (2018) and Suzaida (2016) who concluded that availability bias significantly affects individual investment decision. This inconsistency may be due to environmental difference, investor’s sentiment difference since most of previous studies were conducted in developed countries having organized stock market (Creswell, 2017).
The second hypothesis hypothesized that representativeness bias has significant influence on individual investment decision but the regression result yield a P- value of 0.003 Table 3. This indicated that representativeness bias has significant influence on individual investment decision. It is concurred with the work of Budhiraja (2018); Ojwang, (2011) and Irshad (2016) who found that individual investors excessively relay on past performance by considering past information as representative of their future performance yet the future is uncertain.
The third hypothesis hypothesized that overconfidence has significant influence on individual investment decision yet its p- value was about 0.546 Table 3, implying that investors in the study area were not influenced by overconfidence. This finding is line with the work of Khalid et al. (2018) who found that overconfidence has an insignificant influence on individual investment decision. However, the finding is inconsistent with Subrahmanyam (2008) and Suzaid (2016) who found that overconfidence has significant impact on investment decision.
The fourth hypothesis hypothesized that loss aversion bias have significant influence on individual investment decision and the regression result revealed a p value of 0.033 Table 3. It implies that investors were affected by loss aversion bias. This finding matches with Karanja (2017) and Suzaida (2016) who clinched that loss aversion bias strongly affects investment choice.
The fifth hypothesis hypothesized that regret aversion bias have significant influence on individual investment decision and the model revealed p value of 0.005 Table 3. It shows that individual investors in the study area were affected by regret aversion. The finding is in line with Pietarinen (2014) and Pompains (2012) who admited the influence regret aversion bias on investment decision.
The sixth hypothesis hypothesized that mental accounting have significant influence on individual investment decision and the regression result yield a p-value of 0.000 Table 3. Thus, it inferred that individual investors in the study area were influenced by mental accounting bias. The finding agrees with the study of Rekik & Boujelbene (2013) and Pileroad (2013) who found that mental accounting affected individual investment decision in the Tunisia and Tehran stock exchange respectively (Israel, 1992).
The last hypothesis hypothesized that herding behavior have significant influence on investment decision of individual investor and the regression result yield a p-value of 0.004 Table 3. It implied that individual investors were affected by herding behavior bias. The result is concurred with the work of Bui (2015) and Huetone (2014) who found that herding behavior had significant influence on investment.
Generally, among the seven behavioral factors hypothesized as influencing factors of investment decision in Amhara region of Ethiopia, five behavioral factors i.e. representativeness, loss aversion, regret aversion, mental accounting and herding behavior have significant influence at 5% significance level on investment decision of individual investors based on the utilized multinomial logistic regression result.
Conclusion
The study find that representativeness, loss-aversion, regret aversion, mental accounting biases and herding behavior significantly affected individual investment decision in Amhara region of Ethiopia. Thus, it shows that individual investors were not rational investors; instead they were influenced by psychological biases such as representativeness, loss aversion, regret aversion, mental accounting biases and herding behavior. Therefore, investors are unfounded in their investment decision and they are affected by different psychological biases which inferred the study to support behavioral finance theories.
Accordingly, the study recommended that the negative effect of behavioral factors on investment decision shall be minimized through; establishing training program, seminars, exploitation of investment consultancy and continuous follow-up.
Data availability: The data used to support the findings of this study are available from the corresponding author upon request.
Conflict of Interest: The authors declare that they have no conflicts of interest.
Authors Contribution: All authors have equal contribution, and they reviewed the file together.
Acknowledgement: This study was supported by Bahir Dar University and Debark University, Ethiopia.
References
Alquraan, T., Alqisie, A., & Al Shorafa, A. (2016). Do behavioral finance factors influence stock investment decisions of individual investors? (Evidences from Saudi Stock Market).American international journal of contemporary research,6(3), 159-169.
Bakar, S., & Yi, A. N. C. (2016). The impact of psychological factors on investors’ decision making in Malaysian stock market: a case of Klang Valley and Pahang.Procedia Economics and Finance,35, 319-328.
Indexed at, Google Scholar, Cross Ref
Brooks, C. (2008). Introductory Econometrics for Finance second edition published in the United States of America by Cambridge University Press.New York.
Budhiraja, K., Raman, T. V., & Bhardwaj, G. N. (2018). Impact of behavioral finance in investment decision making.International Journal of Civil Engineering and Technology (IJCIET), 1151-1157.
Bui, N. D., Nguyen, L. T., & Nguyen, N. T. (2015). Herd Behaviour in Southeast Asian Stock Markets–An Empirical Investigation.Acta Oeconomica, 413-429.
Creswell, J. W., & Creswell, J. D. (2017).Research design: Qualitative, quantitative, and mixed methods approaches. Sage publications.
Damodaran, A. (2010).Applied corporate finance. John Wiley & Sons.
De Bondt, W. F., & Thaler, R. H. (1995). Financial decision-making in markets and firms: A behavioral perspective.Handbooks in operations research and management science,9, 385-410.
Indexed at, Google Scholar, Cross Ref
Gujarati, D. N., Porter, D. C., & Gunasekar, S. (2004).Basic econometrics. Tata mcgraw-hill education.
Hirshleifer, D. (2001). Investor psychology and asset pricing.The journal of Finance,56(4), 1533-1597.
Indexed at, Google Scholar, Cross Ref
Huetone, T. (2014). The effect of psychological on individual investors' behavior evidance from vientam stock exchange. Journal of management and sustainability. 125-34.
Irshad, S., Badshah, W., & Hakam, U. (2016). Effect of representativeness bias on investment decision making.Management and Administrative Sciences Review,5(1), 26-30.
Israel, G. D. (1992). Determining sample size.
Javed, M. A., & Marghoob, S. (2017). The effects of behavioural factors in investment decision making at Pakistan stock exchanges.Journal of Advanced Research in Business and Management Studies,7(1), 103-114.
Kahneman, D. (1979). Prospect theory: An analysis of decisions under risk.Econometrica,47, 278.
Karanja, M. M. (2017).Effect Of Behavioral Finance Factors On Investment Decisions Of Individual Investors At The Nairobi Securities Exchange In Nairobi County(Doctoral dissertation, Kca University).
Kengatharan, L., & Kengatharan, N. (2014). The influence of behavioral factors in making investment decisions and performance: Study on investors of Colombo Stock Exchange, Sri Lanka.Asian Journal of Finance & Accounting,6(1), 1.
Khalid, R., Javed, M. U., & Shahzad, K. (2018). Impact of Behavioral Biases on Investment Decision Making with Moderat-ing Role of Financial Literacy Literature Review Investment Decision.Jinnah Business Review,6(2), 34-41.
Kotharic, C. (2004). Research Methodology: Methods & Techniques. New Delhi: New Age International private Ltd.
Lad, J., 2018. A study on behavioral factors influencing individual investment decision making with special reference to south Gujarat region. International journal of latest engineering research and application, pp.70-80.
Mahanthe, J.W.S.M.D.S. & Sugathadasa, D.D. (2018). The impact of behavioral factors on invesment decision making in colombo stock exchange. The International Journal of Business &Management, 6(8), 199-207.
Odean, T. (1998). Are investors reluctant to realize their losses?.The Journal of finance,53(5), 1775-1798.
Indexed at, Google Scholar, Cross Ref
Ojwang, O. (2011). Behavioral factor and investment decision by trader in Kibuye market.Kkisumu. International Journal of Accounting and Taxation.
Onsomu, Z.N. (2014). The impact of behavioral bais on investordecision in kenya. International Journal of Research in humanities, art and literature, 2(6), 87-92.
Pietarinen, J. (2014).Overconfidence and investor trading behavior in the Finnish stock market(Doctoral dissertation, Master thesis, Oulu business school).
Pileroad, E. (2013). Examing the impact of mental accounting on the investment decision in the Tehran Stock Exchange. International Journal of Accounting Research. 6-10.
Pompian, M. M. (2012).Behavioral finance and investor types: managing behavior to make better investment decisions. John Wiley & Sons.
Rekik, Y. M., & Boujelbene, Y. (2013). Determinants of individual investors’ behaviors: Evidence from Tunisian stock market.IOSR Journal of Business and Management,8(2), 109-119.
Ritter, J. R. (2003). Behavioral finance.Pacific-Basin finance journal,11(4), 429-437.
Indexed at, Google Scholar, Cross Ref
Sekaran, U., & Bougie, R. (2016).Research methods for business: A skill building approach. john wiley & sons.
Shiller, R. J. (1999). Human behavior and the efficiency of the financial system.Handbook of macroeconomics,1, 1305-1340.
Indexed at, Google Scholar, Cross Ref
Shiller, R. C. (2000). Irrational exuberance.Philosophy and Public Policy Quarterly,20(1), 18-23.
Smith, M. (2019).Research methods in accounting. Sage.
Subrahmanyam, A. (2008). Behavioural finance: A review and synthesis.European Financial Management,14(1), 12-29.
Indexed at, Google Scholar, Cross Ref
Suzaida, B., & Yi, A. N. C. (2016). The impact of psychological factors on investors’ decision making in Malaysian stock market: a case of Klang Valley and Pahang.Procedia Economics and Finance,35, 319-328.
Indexed at, Google Scholar, Cross Ref
Thaler, R. H. (1999). Mental accounting matters.Journal of Behavioral decision making,12(3), 183-206.
Indexed at, Google Scholar, Cross Ref
Tversky, A., & Kahneman, D. (1974). Judgment under Uncertainty: Heuristics and Biases: Biases in judgments reveal some heuristics of thinking under uncertainty.science,185(4157), 1124-1131.
Indexed at, Google Scholar, Cross Ref
Tversky, A., & Kahneman, D. (1991). Loss aversion in riskless choice: A reference-dependent model.The quarterly journal of economics,106(4), 1039-1061.
Wamae, J. N. (2013). Behavioural factors influencing investment decision in stock market: A survey of investment banks in Kenya.International Journal of Social Sciences and Entrepreneurship,1(6), 68-83.
Waruing, V. (2011). Survey of behaviroul factors influencing individual invesstors choice of the securities at the Nairobi securities. International Journal of Economics and Finance.
Received: 06-Apr-2022, Manuscript No. AAFSJ-22-11702; Editor assigned: 08-Apr-2022, PreQC No. AAFSJ-22-11702(PQ); Reviewed: 22-Apr-2022, QC No. AAFSJ-22-11702; Revised: 18-Nov-2022, Manuscript No. AAFSJ-22-11702(R); Published: 25-Nov-2022