Original Articles: 2017 Vol: 21 Issue: 1
CEO Incentives and the Trade-off Among Earnings Game Strategies
Michele Fabrizi, University of Padova
Antonio Parbonetti, University of Padova
Introduction
This paper analyzes how CEOs’ equity incentives, risk incentives, and career concerns drive the trade-off among earnings game strategies. The accounting literature has documented that investors reward firms that meet or beat earnings expectations (Burgstahler and Dichev, 1997; Degeorge et al., 1999; Brown and Caylor, 2005), and that managers may engage in the “numbers game” to meet earnings targets, choosing among three non-mutually-exclusive strategies. Specifically, executives can alter reported earnings through real earnings management, alter reported earnings through accrual earnings management (e.g., Schipper, 1989; Degeorge et al., 1999; Graham et al., 2005; Roychowdhury, 2006), and/or guide analysts’ expectations downward in an attempt to avoid negative earnings surprises (e.g., Bartov et al., 2002; Matsumoto, 2002).
Extant literature has shown that, after the passage of the Sarbanes-Oxley Act (SOX), firms shifted from accrual-based earnings management and guiding analysts’ expectations to real earnings management because this earnings game strategy is often difficult to detect in a strict regulatory environment (Cohen et al., 2008; Bartov and Cohen, 2009). Thus, real activity manipulation has become a pervasive practice in recent years. Real earnings management presents reasonable concerns because, unlike accrual-based earnings management and guiding analysts’ expectations, it modifies firms’ operations, diverting them from their normal courses without an underlying economic reason. Specifically, Graham et al. (2005) show that, when executives engage in real earnings management, they burn real cash flows and forgo projects with positive net present value, making this earnings game strategy likely the most costly for shareholders since it might impair the firm’s future value. Ge and Kim (2014) show that credit rating agencies and bondholders perceive real earnings management as a credit risk-increasing factor and thus require high risk premiums. In a similar vein, Kim and Sohn (2013) find that the cost of capital is positively associated with the extent of earnings management through the real activities manipulation after controlling for the effect of the accrual-based earnings management.
Given the negative impact of real earnings management on firms’ future value and the pervasiveness of this strategy in recent years, we investigate what types of incentives might induce CEOs to substitute real earnings management with other earnings game strategies that do not alter firm’s real operations.
Using a sample of 4,471 quarterly observations from 1,088 US firms that are likely to have engaged in the earnings game over the period 2003-2010, along with an instrumental variable approach in order to address endogeneity concerns, we focus on the role of CEOs’ equity incentives, risk incentives, and career concerns in driving earnings game decisions. Specifically, we find that CEOs with high equity incentives and high career concerns engage less in real activity manipulations than do executives with low incentives, and that they substitute this earnings game strategy with alternatives. We also document that firms that use real activity manipulation to meet/beat targets have lower future market performances than do firms that use accrual earnings management or that guide analysts’ expectations. This result validates our conjecture that earnings game strategies that rely largely on the alteration of real activities impose high costs on shareholders. CEOs appear to understand and anticipate these effects and, when equity incentives and career concerns align their interests with those of shareholders, they avoid choosing real earnings management strategies.
This paper adds to three research streams in the accounting literature. First, to the best of our knowledge, this is the first study to investigate the effect of CEOs’ incentives on all earnings game strategies simultaneously. Previous studies have considered the earnings game alternatives one by one but have not analyzed the trade-off among them as a function of CEOs’ personal incentives (e.g., Pourciau, 1993; Wells, 2002; Cheng and Warfield, 2005; Bergstresser and Philippon, 2006; Fabrizi and Parbonetti, 2016). As long as executives consider earnings game strategies as substitutes (Cohen et al., 2008; Zang, 2012), the focus on just one or two alternatives does not help to clarify the trade-off CEOs face when deciding how to meet/beat earnings targets. By jointly analyzing all three earnings game strategies, we show how personal incentives motivate CEOs to substitute earnings game strategies. We add to the results in Matsumoto (2002), Cohen et al. (2008), Bartov and Cohen (2009), and Zang (2012) by showing that reporting-environment and firm-related characteristics are not the only determinants of earnings game strategies.
Second, we contribute to the recent research stream that investigates the economic consequences of using the various earnings management strategies to meet/beat benchmarks. Findings on this issue are controversial, and conclusions are not unanimous (see Chen et al., 2010; Cohen and Zarowin, 2010; Gunny, 2010; Das et al., 2011). We contribute to this debate by focusing on the effects of engaging in the earnings game using real earnings management instead of managing accruals or guiding analysts’ expectations, as well as by formally considering the presence of endogeneity between reporting strategies and firm’s performance.
Third, we contribute to academic research that investigates the effectiveness of executive incentives in solving agency problems (e.g., Coughlan and Schmidt, 1985; Core et al., 1999; Fabrizi et al. 2014). Specifically, we show that equity and career incentives have the intended effect of aligning CEOs’ and shareholders’ interests by making CEOs less likely to engage in earnings game strategies that impair firms’ future shareholder value.
Background and Motivation
The accounting literature argues that executives can play the earnings game using three strategies:
1. Real earnings management. Managers who engage in real earnings manipulations divert the firm from its normal operational practices in order to mislead at least some stakeholders into believing certain financial reporting goals have been met in the normal course of operations (Roychowdhury, 2006, p. 337).
2. Accrual-based earnings management. Executives use the managerial discretion left by accounting principles to shift income over time (Degeorge et al., 1999).
3. Guiding analysts’ expectations. Managers avoid negative earnings surprises by guiding analysts’ forecasts downward (Bartov et al., 2002; Matsumoto, 2002).
Cohen et al. (2008) show that the passage of SOX in 2002 triggered a shift from accrual to real earnings management, while Bartov and Cohen (2009) point out a decline in both accrual earnings management and in management of earnings expectations and an increase in real earnings management after the passage of SOX. These findings are consistent with the intuition that SOX imposed high costs on accrual manipulation and constrained the ability to guide analysts’ expectations, thus inducing executives to shift to real earnings management, which is more difficult to detect. Therefore, the current accounting literature suggests that real earnings management has become pervasive in recent years.
The increased use of earnings management triggers several concerns because, among all earnings game strategies available to executives to meet/beat targets, it is the most costly option for the firm. In fact, unlike accrual-based earnings management and guiding analysts’ expectations, real earnings management modifies firms’ operations, diverting from their normal courses without an underlying economic reason. Evidence reported in Graham et al. (2005) indicates that, when executives engage in real earnings management, they burn real cash flows and forgo projects with positive net present value, and results from Graham et al.’s (2005) survey indicate that only half of the managers interviewed would take a project that increases shareholder value if it would cause the firm to miss consensus earnings. Moreover, 80 percent of survey participants reported that they would decrease discretionary spending on R&D, advertising, and maintenance to meet an earnings target, and more than half stated that they would delay starting a new project to meet a benchmark.
Given the expected negative impact of real earnings management on firms’ future value and the increasing pervasiveness of this earnings game strategy, this paper investigates the types of incentives that make CEOs likely to substitute real earnings management with other earnings game strategies that do not interfere with firms’ real operations.
Previous literature has shown that firm-specific characteristics influence the trade-off among earnings management strategies. Zang (2012) focuses on accrual and real earnings management and investigates several firm-related characteristics that influence their relative costliness. Results in Zang (2012) indicate that real activity manipulation is constrained by firms’ competitive status in the industry, as well as their financial health, scrutiny from institutional investors, and the tax consequences of manipulation. In a similar vein, Matsumoto (2002) analyzes the trade-off between accrual-based earnings management and guiding analysts’ expectations and suggests that firm characteristics play a role in how companies meet analysts’ expectations. Overall, these contributions suggest that executives choose their earnings game strategies based on the relative costs and benefits.
A related research stream has investigated the relationship between CEOs’ incentives and firms’ decisions to manipulate earnings. For instance, Bauman and Shaw (2006) and Cheng and Warfield (2005) document a positive relationship between equity-based compensation and the probability that a firm will meet analysts’ targets. Bergstresser and Philippon (2006) show that the use of discretionary accruals to manipulate reported earnings is more pronounced in firms in which the CEOs’ total compensation is closely tied to the value of stocks. Duellman et al. (2013) show that the opportunist financial reporting effect of equity incentives documented in previous research increases as the monitoring intensity of the firm decreases. Armstrong et al. (2013) measure misreporting using discretionary accruals, restatements, and enforcement actions, and find evidence of a positive relation between vega and misreporting. Also Grant et al. (2009) focus on CEOs’ risk-taking incentives and show that they are positively related to income smoothing. Although most studies find a positive relation between CEO’s monetary incentives and earnings management, Adut et al. (2013) and Gong and Li (2013) do not find evidence of an opportunistic behavior in the presence of high CEO compensation. Specifically, Adut et al. (2013) show that CEO compensation levels are positively related to predictive earnings management and negatively related to opportunistic earnings management. Similarly, Gong and Li (2013) find that in companies with higher CEO equity incentives, current year earnings are more informative of future earnings than in other companies. Finally, also Khalil and Simon (2014) find little evidence that earnings management is related to managerial equity ownership.
Pourciau (1993) focuses on CEO turnover and shows that incoming executives manage accruals in a way that decreases earnings in the year of the executive change and increases earnings the following year. Pourciau (1993) also indicates that departing executives record accruals and write-offs that decrease earnings during their last year of tenure. Consistent with these findings, Wells’ (2002) results support the notion that new CEOs engage in an earnings bath and Davidson III et al. (2007) find that firms in which CEOs are nearing retirement age have large discretionary accruals in the year prior to turnover. Kuang et al. (2014) predict and find that outside CEOs engage in greater income-increasing manipulation in the early years of their tenure. However, the differences in earnings management practices become insignificant after CEOs survive the short run (Kuang et al. 2014). In a similar vein, Choi et al. (2014) examine the empirical relation between CEO turnover and earnings management and find upward earnings management by the departing CEO only when the departure is forced and the new CEO is an insider. Overall, findings from this strand of literature suggest that CEOs’ personal incentives, both monetary and non-monetary, play a core role in their decision concerning whether to play the numbers game.
Despite the contributions that analyze the relationship between CEOs’ incentives and earnings management, there is a lack of evidence about how CEOs’ incentives shape the trade-off among the earnings game strategies and, more specifically, about which type of incentive might induce CEOs to substitute real earnings management with other strategies that could be less costly for the firm. This lack of evidence is particularly important because earnings game strategies are decided and executed by the CEO, who is likely to consider his or her personal costs and benefits in making the choice among the options.
Bauman et al. (2005) partially fill this gap by providing evidence in the pre-SOX era that stock option compensation affects earnings guidance positively and accrual-based earnings management negatively, but the role of CEOs’ incentives on earnings game strategies— specifically real earnings management—in the post-SOX era remains unclear. Similarly, Demers and Wang (2010) analyze the impact of the CEO’s age on accrual and real earnings management, but their study does not model a trade-off among earnings game strategies. In this paper we jointly analyze the trade-off among real activity manipulation, accrual-based earnings management, and guiding analysts’ expectations that occurs as a result of CEOs’ incentives.
Testable Predictions
We suggest that CEOs trade-off the earnings game strategies, considering the relative costs and benefits of each strategy, according to their personal incentives. The fact that real earnings management encompasses the manipulation of firms’ real operations makes this earnings game strategy particularly costly for the firm. Therefore, CEOs with specific types of incentives might prefer to substitute real earnings management with accrual-based earnings management and/or with guiding analysts’ expectations. Specifically, we focus on three types of CEO incentives that we expect to induce CEOs to substitute real earnings management with other earnings game strategies: equity incentives, risk-related incentives, and career concerns.
Equity Incentives
Equity incentives refer to the change in the value of the executive’s portfolio of stocks and options that is due to a variation in stock price (Murphy, 1999; Core et al., 2003). By motivating CEOs to increase stock price, equity incentives align CEOs’ interests with those of shareholders, thus moderating principal-agent problems (Core et al., 2003). In fact, CEOs with high equity incentives are more concerned than are those with low equity incentives about the long-term value of the company that, under the efficient-market hypothesis, is readily incorporated in the stock price.
Previous literature (e.g. Keung et al., 2010) suggests that all the three earnings game strategies might be detrimental for firms’ value. However, real manipulations are likely to have the strongest negative effect on firms’ future value because of the real costs imposed on the firm. Graham et al. (2005) show that when executives engage in real earnings management, they burn real cash flows and forgo projects with positive net present value. In this vein, Cohen and Zarowing (2010) document a negative impact of real manipulations on firms’ future performance. Since equity incentive align CEOs’ interests with those of shareholders it is more likely that CEOs substitute real earnings management with alternatives that do not modify firms’ operations. Because of that we expect that CEOs with high equity incentives are more likely to substitute real earnings management with accrual earnings management and/or guiding analysts’ expectations than are CEOs with low equity incentives. Therefore, we posit the following research hypothesis:
H1 CEOs with high equity incentives substitute real earnings management with accrual-based earnings management and/or with guidance of analysts’ expectations.
Risk-related Incentives
CEOs’ risk-related incentives stem from the sensitivity of the CEO’s equity portfolio to stock price volatility and provide executives with incentives to take risks in order to increase the value of their option portfolio (Core et al., 2003). In this line, Coles et al. (2006) document that high sensitivity of CEO wealth to stock volatility leads CEOs to implement riskier policy choices, including relatively more investment in R&D. Therefore, we expect that CEOs who are incented to take risk do not engage in real earnings management because doing so would require cutting discretionary expenditures, such as R&D, which might increase future stock price volatility. We expect them to substitute this earnings game strategy with other options. This is consistent with findings in Fabrizi and Parbonetti (2016) showing that CEOs with high risk-related incentives engage less in real activity manipulations that encompass cutting discretionary expenditures than do executives with low incentives.
While the empirical evidence on risk-related incentives and analysts’ guidance is scant, Armstrong et al. (2013) consider misreporting a special case of a risky activity and show that high vegas have a positive effect on the discretionary components of accruals. Even if either accrual-based earnings management or guiding analysts’ expectations might have a negative impact on firms’ stock price volatility, we expect the effects of real earnings management on volatility to be more pervasive and persistent since it requires cutting investments that have a well-documented association with firm’s risk profile (Comin and Philippon, 2005). Therefore, we posit the following research hypothesis:
H2 CEOs with high risk incentives substitute real earnings management with accrual-based earnings management and/or with guidance of analysts’ expectations.
In Fama’s (1980) model, career concerns lead to efficient managerial behavior that can overcome moral hazard problems. The argument is further explored by Holmström (1999), who develops a model in which learning about a qualified measure of the manager’s talent and ability occurs through the observation of the manager’s output. The precision of information about manager’s ability typically increases as time goes on, so the market puts more weight on the output observations during the early stage of the executive’s career when the market has less information and the output observations are more important for inferring the manager’s “type.” As a consequence, young executives have more career concerns than their older colleague because they have stronger incentives to deliver positive outcomes to the market. Therefore, similar to equity incentives, career concerns align CEOs and shareholders’ interests and make executives more likely to put effort into delivering positive, observable outcomes to the market. As a consequence, the negative side effects of real earnings management are particularly costly for executives with career concerns, so we anticipate that they avoid this earnings game strategy and substitute it with other earnings game strategies. Therefore, we posit the following research hypothesis:
H3 CEOs with career concerns substitute real earnings management with accrual-based earnings management and/or with guidance of analysts’ expectations
Variable Measurement
Accrual-based Earnings Management
We use a cross-sectional model, the Modified Jones Model (Dechow et al., 1995), to calculate discretionary accruals, estimating the normal accrual model for each year and quarter for every industry. This approach, which is commonly used in earnings management literature (e.g., Cohen and Zarowin, 2010), partially controls for industry-wide changes in economic conditions that affect total accruals while allowing the coefficients to vary across time. Specifically, we start estimating cross-sectional model (1) for each two-digit SIC/year/quarter groups:

In model (1), for fiscal year t, quarter q, and firm i, TA represents the total accruals computed as the difference between i) earnings before extraordinary items and discontinued operations and ii) operating cash flows from continuing operations. Assets represent firm’s total assets, ΔSALES is the change in revenues from the preceding quarter, and PPE is the gross value of property, plant and equipment1.
The coefficient estimates from (1) are then used to estimate the firm-specific normal accruals (NA) as:

Where ΔAR is the change in accounts receivable from the preceding quarter. Finally, we compute discretionary accruals as the difference between firms’ total accruals (scaled by total assets) and NA. Kothari et al. (2005) argue that traditional accrual earnings management measures tend to be mis-specified because performance and estimated metrics have a mechanical relationship. In order to overcome this problem, we follow their suggestion by computing a performance-matched discretionary accrual metric (Accrual EM). Specifically, for each treatment firm in our sample, we identify a control firm in the same two-digit SIC code, year, and quarter with the smallest difference in terms of ROA. Then we compute the accrual earnings management metric for the treatment firm as the difference between the earnings management proxy for the treatment firm and the control firm.
Real Earnings Management
We build on previous literature to develop our proxies of real earnings management (Roychowdhury, 2006; Cohen et al., 2008; Bartov and Cohen, 2009; Cohen and Zarowin, 2010; Zang 2012). Following Zang (2012), we focus on i) reporting a lower cost of goods sold through increased production and ii) decreasing discretionary expenditures2.
We first generate the normal level of discretionary expenses and production costs using the models developed by Dechow et al. (1998), as implemented by Roychowdhury (2006). Specifically, we use the following model to estimate the normal level of production costs:

where production costs (PROD) are defined as the sum of cost of goods sold and changes in inventory during the quarter. Abnormal production costs (R_PROD) are defined as actual production costs minus normal production costs, computed using the estimated coefficients from (3).
Second, we model discretionary expenses as a function of lagged sales and estimate the following model to derive normal levels of discretionary expenses:
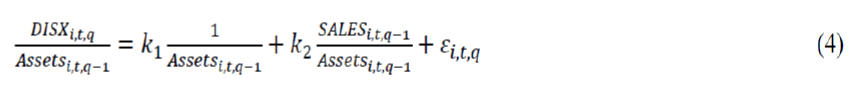
Where DISX is the selling and general and administrative expenses from the Compustat dataset 3 . Abnormal levels of discretionary expenditures (R_DISX) are then defined as actual discretionary expenses minus normal discretionary expenses, computed using the estimated coefficients from (4). In this case we also use a performance match approach to eliminating any bias that may be due to the correlation among real earnings management metrics (R_PROD and R_DISX) and the firms’ performance.
Following Cohen and Zarowin (2010) and Zang (2012), in order to capture the total effect of real earnings management, we combine the two individual measures into one comprehensive metric of real earnings management (Real EM). Specifically, we first multiply abnormal discretionary expenses by -1 (so, as the amount increases, so does the likelihood that the firm is cutting discretionary expenditures) and then add the product to abnormal production costs.
Guiding Analysts’ Expectations
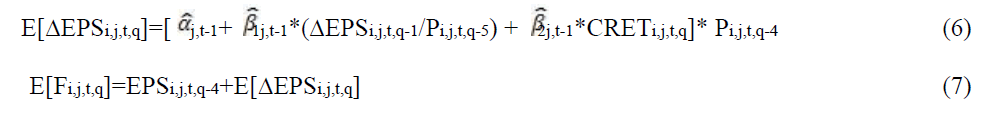
As proxy for guiding analysts’ expectations, we use the model developed and validated by Matsumoto (2002), which adopts a method similar to that of the Jones model (Jones, 1991) for computing abnormal accruals. Specifically, we first estimate the expected portion of analysts’ forecast by modeling the seasonal change in earnings as a function of i) the prior quarter’s seasonal change in earnings and ii) cumulative returns over the current year:

Where ΔEPSijtq is earnings per share for firm i in four-digit SIC code j in quarter q of year t, less earnings per share for the same firm four quarters prior (i.e., quarter t-4), as reported in I/B/E/S;
Pijtq is price per share for firm i in four-digit SIC code j at the end of quarter q of year t, as reported in quarterly Compustat;
CRETijtq is cumulative daily excess returns for firm i in four-digit SIC code j in quarter q of year t obtained from CRSP. Returns are cumulative from three days after the quarter q-4 earnings announcement to twenty days before the quarter q earnings announcement.
Model (5) is estimated for each firm year using all firm quarters in that year from the same four-digit SIC code. Since the estimate of analysts’ expected forecast should use only data that would be available to analysts in making their forecast, we follow Matsumoto (2002) in using the parameter estimates from the prior firm year to determine the expected change in EPS (E[ EPS]). We then add this value to the earnings from the same quarter in the prior year to obtain the expected forecast (E[F]) of the current quarter’s earnings:
Subtracting the expected forecast (computed using equation 7) from the last published consensus forecast for the quarter provides the unexpected portion of the forecast (UEF). We then multiply UEF by -1 (Guidance EM) so, as the amount increases, so does the likelihood that the firm has guided analysts’ forecasts downward.
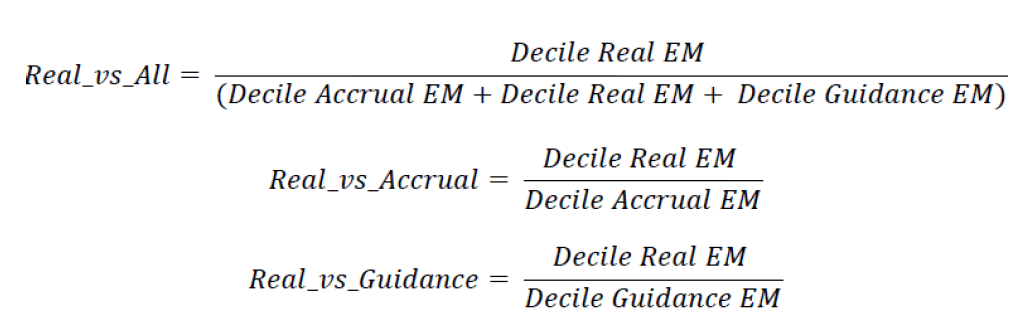
The Trade-off Among Earnings Game Strategies
Given our focus on the use of earnings game strategies, we test our research hypotheses in a setting in which earnings management is likely to occur. Specifically, we restrict our investigation to quarters in which the firm has exactly met analysts’ consensus earnings forecasts or has exceeded analysts’ expectations by one cent (suspect firms) 4 . Since we analyze firms’ trade-off decisions among the three earnings management approaches and not the choice to engage in the earnings game, we create three metrics that directly analyze the trade-off among earnings game strategies. Specifically, using the final sample of suspect firms, we sort the three earnings management proxies (Accrual EM, Real EM, and Guidance EM) into deciles and create three ratios that compare the amount of real earnings management used by the company with respect to the other two earnings game strategies:
CEOs’ Equity Incentives
As Core et al. (2003) emphasize, executive incentives from stocks and options are properly measured only considering portfolio incentives, as the amount of newly granted restricted stock and stock options is not sufficient for the purpose of quantifying the executive’s incentives (Yermack, 1995). We measure CEOs’ equity incentives (Equity Incentives) using the incentive ratio computed as in Bergstresser and Philippon (2006, 519-520). We start by computing the dollar change in the value of executive’s stock and option holdings that would come from a 1 percent increase in the company stock price (ONEPCT). In order to estimate the delta of a CEO’s option portfolio, we follow Core and Guay’s (2002) methodology in dividing the CEOs’ options into three groups—options awarded during the year, options awarded in previous years but not yet exercisable, and options granted in previous years and currently exercisable—and computing separate estimates of the delta. Core and Guay (2002) show that their proxy captures more than 99 percent of the variation in the value and sensitivity of option portfolio values. Starting from 2006, Execucomp reports all the necessary data for directly computing the delta of CEOs’ option portfolios, thus eliminating the need to use Core and Guay’s (2002) approximation. Next, as in Bergstresser and Philippon (2006), we standardize ONEPCT by the amount of cash compensation the executive received during the fiscal year.
CEOs’ Risk Incentives
We measure CEOs’ risk-related incentives (Risk Incentives) using a methodology similar to that used by Rogers (2002, 2005) and Grant et al. (2009), the vega of CEOs’ stock options divided by their delta. This approach is consistent with Core et al. (2003), who claim that risk-taking is a second-order effect in option compensation since the incentive to increase the stock price dominates the incentive to take risks. Therefore, we examine the role of this second-order effect on the choice of earnings game strategies with respect to the first-order effect. We compute CEOs’ option vega as the sensitivity of their option holdings to a unit change in stock price volatility using the first derivative of the Black-Scholes option-pricing model in relation to firms’ volatility. The delta is computed by taking the partial derivative of the Black-Scholes equation with respect to stock price. When necessary, we used Core and Guay’s (2002) methodology to retrieve the data for computing the options’ vega and delta.
Ceos’ Career Concerns
Consistent with our research framework, we proxy CEOs’ career concerns using the CEO’s age as disclosed in Execucomp. Since older CEOs have fewer career concerns than younger executives do, we create the variable Career Concerns, which is equal to the CEO’s age multiplied by -1. Thus, a positive coefficient on Career Concerns indicates that CEOs with high levels of career concerns (younger CEOs) engage more in a given earnings game strategy than do executives with few career concerns (older CEOs).
Control Variables
We include in our models several control variables that previous literature has shown influence earnings game strategies (e.g., Zang, 2012).
Log Assets, the natural logarithm of total assets, proxies for the firm’s size; Cycle, the length of the operating cycle computed as in Dechow (1994), is an underlying determinant of the variability of working capital; M_B, the market value of equity divided by the book value of equity, proxies for growth opportunities; Z Score, Altman’s Z-score (Altman, 2000), proxies for a firm’s financial health; Market Share is the firm’s market share computed as the ratio of the company’s total sales to the total sales of its three-digit SIC code industry in a given year quarter; NOA is the firm’s net operating assets (i.e., shareholders’ equity less cash and marketable securities plus total debt) standardized by total assets; Tenure Auditor is the number of years the auditor has audited the firm; ROA is operating profits divided by total assets; Tenure CEO is a dummy variable that takes a value of 1 if the CEO’s tenure is greater or equal to 3 years, and zero otherwise. The use of the tenure dummy is consistent with Fredrickson et al. (1988), who argue that early vulnerability occurs when the CEO’s tenure is three years or less; after three years CEOs start gaining power and becoming entrenched.
Empirical Analyses
Sample Selection
We start with 348,998 firm-quarter observations from Compustat over the period 2003-2010. Following a common practice in earnings management literature (see Roychowdhury, 2006), we exclude firms in regulated industries (SIC codes 4400-5000) and banks and financial institutions (SIC codes 6000-6500), so we lose 73,176 firm-quarters. We delete 99,288 and 25,385firm-quarters with missing data on Compustat that is needed to compute, respectively, accrual and real earnings management metrics. Then we merge the Compustat database with the I/B/E/S dataset and lose another 98,537 firm-quarters that are missing data needed to compute guidance of analysts’ expectations. Finally, we merge the Compustat and I/B/E/S datasets with Execucomp and delete an additional 24,749 firm quarters with insufficient data on CEOs’ incentives and 871firm quarters with missing control variables. Restricting the sample to suspect firms leads to a final sample of 4,471 firm-quarter observations generated from 1,088 unique firms. Table 1 provides a tabular representation of the sample selection process.
| Table 1 : Sample Selection and Composition | |
| Firm-quarter observations in Compust at (2003-2010) | 348,998 |
| minus | |
| SIC codes from 6000 to 6500 and from 4400 to 5000 | 73,176 |
| Missing data for computing discretionary accruals | 99,288 |
| Missing data for computing real earnings management | 25,385 |
| Missing data for computing analysts' guidance | 98,537 |
| Missing data for computing CEO incentives | 24,749 |
| Missing data for computing control variables | 817 |
| No suspect firms | 22,575 |
| Final Sample | 4,471 |
| Unique firms | 1,088 |
| Table 2: Descriptive Statistics | ||||||
| N | Mean | SD | p25 | p50 | p75 | |
|---|---|---|---|---|---|---|
| Equity Incentives | 4,471 | 0.292 | 0.225 | 0.122 | 0.229 | 0.396 |
| Risk Incentives | 4,471 | 0.637 | 0.442 | 0.363 | 0.566 | 0.805 |
| Career Concerns | 4,471 | -54.746 | 7.239 | -60.000 | -55.000 | -50.000 |
| Accural EM | 4,471 | -0.007 | 0.059 | -0.035 | -0.004 | 0.024 |
| Real EM | 4,471 | -0.005 | 0.079 | -0.046 | -0.004 | 0.037 |
| Guidance EM | 4,471 | -0.007 | 0.144 | -0.079 | -0.006 | 0.065 |
| Log Assets | 4,471 | 7.115 | 1.440 | 6.082 | 6.956 | 8.010 |
| Cycle | 4,471 | 119.590 | 72.338 | 67.682 | 105.858 | 154.384 |
| M_B | 4,471 | 3.373 | 2.954 | 1.735 | 2.645 | 4.055 |
| Z Score | 4,471 | 4.875 | 5.293 | 1.895 | 3.292 | 5.887 |
| Market Share | 4,471 | 0.064 | 0.112 | 0.002 | 0.016 | 0.073 |
| NOA | 4,471 | 0.809 | 0.183 | 0.717 | 0.870 | 0.957 |
| Tenure Auditor | 4,471 | 12.427 | 9.013 | 6.000 | 10.000 | 17.000 |
| ROA | 4,471 | 0.015 | 0.021 | 0.007 | 0.015 | 0.025 |
| Tenure CEO | 4,471 | 0.642 | 0.480 | 0.000 | 1.000 | 1.000 |
| 82 | ||||||
Table 2 presents descriptive statistics of the main variables used in the analysis. Since decile distributions are not informative, we report the row values of earnings management proxies (Accrual EM, Real EM, Guidance EM).
The table presents descriptive statistics for the main variables included in the analysis. Equity Incentives is the dollar change in the value of CEO’s stock and option holdings that would come from a one percentage point increase in the company stock price, standardized by cash compensation; Risk Incentives is the Vega of CEO’s stock options divided by their Delta; Career Concerns is CEO's age multiplied by - 1; Accrual EM is performance-matched signed discretional accruals computed using the Modified Jones Model; Real EM is performance-matched abnormal production costs plus performance-matched abnormal discretionary expenses multiplied by - 1, computed as in Roychowdhury (2006); Guidance EM is the unexpected portion of analysts' forecast computed as in Matsumoto (2002) multiplied by - 1; Log Assets is the natural logarithm of total assets; Cycle is the length of the operating cycle computed as in Dechow (1994); M_B is the market value of equity divided by the book value of equity; Z Score is Altman’s (2000) Z-score; Market Share is firm’s market share computed as the ratio of a company’s total sales to the total sales of its three-digit SIC code industry in a given year-quarter; NOA is firm’s net operating assets (i.e. shareholders’ equity less cash and marketable securities plus total debt) standardized by total assets; Tenure Auditor is the number of years the auditor has audited the firm; ROA is operating profits divided by total assets; Tenure CEO is a dummy variable that takes the value of 1 if the CEO’s tenure is greater or equal to 3, zero otherwise.
All values appear to be in reasonable ranges that are comparable with the ranges in previous studies. Specifically, the median incentive ratio is 0.229, with substantial variability among CEOs, while options’ second-order effect represents in the median 56.6 percent of the first-order effect. The median CEO age is fifty-five years, and the median tenure is more than three years. Firm characteristics show that our sample (as is usual when dealing with the Execucomp database) is made up of large, profitable firms with high growth opportunities.
Table 3 presents the Pearson correlation coefficients among the main variables included in the analysis.
| Table 3: Correlation Matrix | ||||||||
| 1 | 2 | 3 | 4 | 5 | 6 | 7 | ||
|---|---|---|---|---|---|---|---|---|
| 1 | Equity Incentives | 1 | ||||||
| 2 | Risk Incentives | -0.281*** | 1 | |||||
| 3 | Career Concerns | -0.063*** | 0.046** | 1 | ||||
| 4 | Accural EM | -0.030* | 0.005 | -0.036* | 1 | |||
| 5 | Real EM | -0.076*** | -0.001 | -0.067*** | 0.119*** | 1 | ||
| 6 | Guidance EM | 0.083*** | -0.090*** | 0.022 | -0.001 | -0.034* | 1 | |
| 7 | Log Assets | 0.156*** | 0.228*** | -0.096*** | -0.029 | 0.056*** | -0.009 | 1 |
| 8 | Cycle | -0.043** | 0.058*** | -0.069*** | -0.028 | -0.131*** | 0.060*** | -0.022 |
| 9 | M_B | 0.281*** | -0.101*** | 0.007 | -0.021 | -0.097*** | 0.063*** | 0.067*** |
| 10 | Z Score | 0.303*** | -0.216*** | 0.034* | -0.071*** | -0.076*** | 0.096*** | -0.251*** |
| 11 | Market Share | 0.041** | 0.088*** | -0.100*** | 0.025 | 0.101*** | -0.087*** | 0.437*** |
| 12 | NOA | -0.170*** | 0.143*** | -0.164*** | 0.099*** | 0.154*** | -0.084*** | 0.312*** |
| 13 | Tenure Auditor | -0.031* | 0.160*** | -0.096*** | 0.017 | 0.022 | 0.003 | 0.278*** |
| 14 | ROA | 0.213*** | -0.164*** | -0.043** | 0.010 | -0.043** | -0.020 | 0.069*** |
| 15 | Tenure CEO | 0.286*** | -0.149*** | -0.221*** | 0.005 | 0.020 | 0.026 | -0.080*** |
| 8 | 9 | 10 | 11 | 12 | 13 | 14 | ||
| 8 | Cycle | 1 | ||||||
| 9 | M_B | -0.062*** | 1 | |||||
| 10 | Z Score | 0.110*** | 0.271*** | 1 | ||||
| 11 | Market Share | -0.145*** | 0.087*** | -0.159*** | 1 | |||
| 12 | NOA | -0.038* | -0.119*** | -0.460*** | 0.260*** | 1 | ||
| 13 | Tenure Auditor | 0.049** | -0.045** | -0.102*** | 0.139*** | 0.128*** | 1 | |
| 14 | ROA | -0.051*** | 0.340*** | 0.394*** | 0.119*** | -0.007 | 0.025 | 1 |
| 15 | Tenure CEO | 0.025 | -0.009 | 0.075*** | -0.060*** | -0.010 | -0.054*** | 0.069*** |
The table shows Pearson correlation coefficients among the main variables involved in the analysis. Variables are defined in Table 2. *,**,*** indicate statistical significance at 10%, 5%, 1% level, respectively. P-values are two tailed.
As expected, there is a negative correlation between CEOs’ equity and risk incentives since the measure of risk incentives adjusts at the denominator for the sensitivity of CEOs’ option portfolios to changes in stock prices. CEOs’ career concerns are negatively associated with CEOs’ equity incentives since younger executives have smaller equity portfolios than their older colleagues do.
Finally, since executives that hold the CEO position for a long time have more stocks and options in their portfolios than new executives do, there is a positive correlation between CEOs’ equity incentives and CEOs’ tenure.
The table classifies observations into quintiles according to the level of CEO incentives, and tabulates for each group the mean level of the variable Real_vs_All. Real_vs_All is computed as [Decile Real EM/(Decile Accrual EM + Decile Real EM + Decile Guidance EM)]. Variables are defined in Table 2. P-values are two-tailed.
| Table 4: Ceo Incentives And Earnings Game: Univariate Analysis |
||
| Panel A | Real_vs_All | |
|---|---|---|
| Equity Incentives Quintile | Mean | |
| Lowest | 0.347 | |
| 2nd quintile | 0.335 | |
| 3rd quintile | 0.335 | |
| 4th quintile | 0.335 | |
| Highest | 0.306 | |
| H0: Lowest - Highest = 0 | z = 5.819 p-value = 0.015 | |
| Panel B | Real_vs_All | |
| Risk Incentives Quintile | Mean | |
| Lowest | 0.318 | |
| 2nd quintile | 0.332 | |
| 3rd quintile | 0.332 | |
| 4th quintile | 0.339 | |
| Highest | 0.336 | |
| H0: Lowest - Highest = 0 | z = -2.424 p-value = 0.015 | |
| Panel C | Real_vs_All | |
| Career Concerns Quintile | Mean | |
| Lowest | 0.337 | |
| 2nd quintile | 0.343 | |
| 3rd quintile | 0.333 | |
| 4th quintile | 0.329 | |
| Highest | 0.313 | |
| H0: Lowest - Highest = 0 | z = 3.459 p-value = 0.000 | |
Table 4 classifies observations into quintiles according to the level of CEO incentives, and tabulates for each group the mean level of the variable Real_vs_All. Consistent with our first and third hypotheses, univariate results show that, the higher the CEO’s equity incentives (Panel A) and career concerns (Panel C), the lower the amount of real earnings management the company uses with respect to the overall earnings management activity undertaken.
However, in contrast with our second research hypothesis, results from Table 4’s Panel B do not provide evidence that CEOs with high risk incentives engage less in real earnings management than do CEOs with low risk incentives.
In the following we test our hypotheses in a multivariate setting and consider the presence of endogeneity between CEOs’ compensation structure and earnings game strategies.
Multivariate Analysis
In our research setting, endogeneity is likely to be an issue because compensation structure and reporting strategies are jointly determined by the firm. We assume that earnings game strategies can be presented in the following form:
Earnings management strategies = f(Equity Incentives, Risk Incentives, Career Concerns, Log Assets, Cycle, M_B, Z Score, Market Share, NOA, Tenure Auditor, ROA, Tenure CEO) (A)
To control for the endogeneity of equity and risk incentives, our research design uses a system of simultaneous equations by adding the following to (A):
Equity incentives = f(Industry Equity Incentives, Log Assets, Cycle, M_B, Z Score, Market Share, NOA, Tenure Auditor, ROA, Tenure CEO) (B)
Risk incentives = f(Industry Risk Incentives, Log Assets, Cycle, M_B, Z Score, Market Share, NOA, Tenure Auditor, ROA, Tenure CEO) (C)
In this system of simultaneous equations, equation (A) measures the trade-off among earnings game strategies, given the CEO’s incentives. The incentives are specified in (B) and (C) using as an instrument for CEO’s equity (risk) incentives of firm i in year t, the mean of the equity (risk) incentives provided in year t to all CEOs of firms belonging to firm i’s two-digit sic code5.The underlying logic for using these two instruments is that compensation structures tend to be correlated inside given industries (Murphy, 1999), but arguably the industry compensation structure is not related to the reporting strategy of a specific firm. We estimate equations (A), (B), and (C) through three-stage least square (3SLS) estimates.
Table 5 reports results using Real_vs_All as the dependent variable in equation (A). The negative and statistically significant coefficients on CEOs’ equity incentives and career concerns corroborate results from the univariate analysis and, consistent with our first and third research hypothesis, suggest that CEOs with high equity incentives and career concerns tend to substitute real earnings management with other alternatives. Consistently with our research framework, the variable Real_vs_All does not capture the total amount of earnings management but proxies for the relative use of real earnings management with respect to overall earnings management activity.
The variable Real_vs_All combines accrual-based earnings management with guidance of analysts’ expectations. To ensure that the results documented are not driven by just one of these two alternatives to real earnings management, we estimate equations A, B, and C using as the dependent variable in equation A the proxies Real_vs_Accrual and Real_vs_Guidance. These variables compare earnings game strategies two by two and allow us to shed further light on their trade-off.
Three-stage least-square estimates for equation A using Real_vs_Accrual and Real_vs_Guidance as dependent variables are reported in Table 6. For the sake of brevity, we do not report results from equations B and C, which are similar to those presented in Table 5.
| Table 5 : Ceo Incentives and Earnings Game: Univariate Analysis. | |||
|---|---|---|---|
| Dependent variable: | Real_vs_All | Equity Incentives | Risk Incentives |
| Eq. A | Eq. B | Eq. C | |
| Equity Incentives | -1.122*** | ||
| [-4.711] | |||
| Risk Incentives | -0.046 | ||
| [-0.364] | |||
| Career Concerns | -0.002*** | -0.001 | 0.003*** |
| [-3.716] | [-1.636] | [3.845] | |
| Log Assets | 0.056*** | 0.044*** | 0.048*** |
| [5.228] | [18.937] | [10.409] | |
| Cycle | -0.000*** | -0.000*** | 0.000*** |
| [-6.156] | [-3.729] | [3.468] | |
| M_B | 0.009** | 0.012*** | -0.003* |
| [2.555] | [11.499] | [-1.680] | |
| Z Score | 0.011*** | 0.010*** | -0.006*** |
| [3.894] | [14.527] | [-4.702] | |
| Market Share | 0.130*** | 0.014 | -0.028 |
| [4.306] | [0.466] | [-0.493] | |
Consistent with our first (third) research hypothesis, coefficients on CEO’s equity incentives (career concerns) are negative and statistically significant and corroborate findings from Table 5. Specifically, results indicate that CEOs with high equity incentives and career concerns prefer to guide analysts’ expectations or engage in accrual-based earnings management rather than manipulating their firms’ business operations.
| Table 5 (continued): Ceo Incentives And Earnings Game: Univariate Analysis | |||
| Dependent variable: | Real_vs_All | Equity Incentives | Risk Incentives |
|---|---|---|---|
| Eq. A | Eq. B | Eq. C | |
| NOA | -0.038 | -0.135*** | 0.075** |
| [-0.956] | [-7.290] | [2.035] | |
| Tenure Auditor | -0.001** | -0.001*** | 0.003*** |
| [-2.017] | [-3.315] | [4.988] | |
| ROA | -0.058 | 0.208 | -2.383*** |
| [-0.166] | [1.286] | [-7.428] | |
| Tenure CEO | 0.146*** | 0.133*** | -0.094*** |
| [4.004] | [21.795] | [-7.771] | |
| Equity Incentives Industry | 0.664*** | ||
| [12.372] | |||
| Risk Incentives Industry | 0.654*** | ||
| [31.814] | |||
| Year Dummies | YES | NO | NO |
| Quarter Dummies | YES | NO | NO |
| Industry Dummies | YES | NO | NO |
| Observations | 4,471 | 4,471 | 4,471 |
Consistent with the univariate analysis, Table 6 does not support the conjecture that risk incentives that stem from stock-option holdings motivate CEOs to substitute real earnings management with accrual-based earnings management and/or guiding analysts’ expectations (H2). This result may be due to the possibility that risk-related incentives prevent cutting only certain types of discretionary investments (e.g., long-term R&D) while having no effect on other expenditures (e.g., employee training) that determine real earnings management metrics (see Fabrizi and Parbonetti, 2016). Moreover, the use of accrual earnings management and analyst guidance may decrease the firm’s volatility, explaining the absence of results on the risk incentives variable.
| Table 6: Disentangling the effect of ceo incentives on earnings Game strategies |
||
| Dependent variable: | Real_vs_Guidance | Real_vs_Accrual |
|---|---|---|
| (1) | (2) | |
| 3SLS | ||
| Equity Incentives | -13.648*** | -19.989*** |
| [-4.505] | [-7.232] | |
| Risk Incentives | -1.707 | -1.063 |
| [-1.061] | [-0.723] | |
| Career Concerns | -0.020** | -0.023*** |
| [-2.558] | [-3.163] | |
| Log Assets | 0.715*** | 0.981*** |
| [5.232] | [7.797] | |
| Cycle | -0.003*** | -0.004*** |
| [-3.502] | [-5.283] | |
| M_B | 0.120*** | 0.233*** |
| [2.748] | [5.853] | |
| Z Score | 0.121*** | 0.210*** |
| [3.310] | [6.323] | |
| Market Share | 2.230*** | 0.836** |
| [5.748] | [2.286] | |
| NOA | -0.512 | -2.271*** |
| [-1.006] | [-4.870] | |
| Tenure Auditor | -0.009 | -0.021*** |
| [-1.217] | [-2.972] | |
| ROA | 0.015 | -5.269 |
| [0.003] | [-1.283] | |
| Tenure CEO | 1.696*** | 2.587*** |
| [3.649] | [6.112] | |
| Year Dummies | YES | YES |
| Quarter Dummies | YES | YES |
| Industry Dummies | YES | YES |
| Observations | 4,471 | 4,471 |
The table reports 3SLS estimates for equations A, B, and C. Real_vs_All is computed as [Decile Real EM/(Decile Accrual EM + Decile Real EM + Decile Guidance EM)]. Equity (Risk) Incentives Industry is the mean of the equity (risk) incentives provided in year t to all CEOs of firms belonging to firm i’s two-digit sic code (excluding firm i). All other variables are defined in Table 2. *,**,*** indicate statistical significance at 10%, 5%, 1% level, respectively. P-values are two tailed. z-statistics in brackets.
The previous analyses suggest that CEOs with high equity incentives and high career concerns consider real earnings management the most costly earnings game strategy, so they avoid it. Our research framework assumes that this result occurs because real earnings management, unlike accrual-based earnings management and guiding analysts’ expectations, modifies firms’ operations, diverting them from their normal courses without an underlying economic reason. Therefore, real earnings management decreases firms’ future shareholder value. Executives whose interests are more aligned with those of shareholders in terms of equity incentives and career concerns incorporate this cost to a larger extent and use fewer real manipulations to meet/beat benchmarks than do CEOs with low incentives. In this section of the paper, we empirically test this underlying assumption by analyzing whether the future performance of firms that engage in real manipulations trails that of companies that adopt other earnings game strategies. Specifically, we analyze the economic consequences of using real earnings management, rather than accrual earnings management or analyst guidance, by focusing on future market performance, which is a direct measure of shareholder value.
In our empirical analysis we consider the potential presence of engogeneity between CEOs’ compensation and earnings game strategies, as well as between earnings game strategies and firms’ market performance. In fact, executives are likely to decide current earnings game strategies by considering their firms’ performance prospects, thus raising potential endogeneity problems. We model firm’s future market performance as follows:
The table reports 3SLS results for equations A simultaneously estimated with equations B and C (untabulated). Real_vs_Guidance is computed as (Decile Real EM/ Decile Guidance EM); Real_vs_Accrual is computed as (Decile Real EM/ Decile Accrual EM). All other variables are defined in Table 2. *,**,*** indicate statistical significance at 10%, 5%, 1% level, respectively. P-values are two tailed. z-statistics in brackets.
Future market performance = f(Earnings Management Strategies, Log Assets, M_B, Z CashFlow,Growth,Leverage) (D)
To control for endogeneity, we add the following equations to (D):
Earnings management strategies = f(Equity Incentives, Risk Incentives, Career Concerns, Log Assets, Cycle, M_B, Z Score, Market Share, NOA, Tenure Auditor, ROA, Tenure CEO) (A)
Equity incentives = f(Industry Equity Incentives, Log Assets, Cycle, M_B, Z Score, Market Share, NOA, Tenure Auditor, ROA, Tenure CEO) (B)
Risk incentives = f(Industry Risk Incentives, Log Assets, Cycle, M_B, Z Score, Market Share, NOA, Tenure Auditor, ROA, Tenure CEO) (C)
Table 7 reports the results for equation (D) obtained by estimating the simultaneous equation system made by equations (D), (A), (B), and (C) through 3SLS.
| Table 7 : Earnings Game Strategies And Future Market Performance | ||||
| Dependent variable: | Returns (Q+1) | Returns (Q+2) | Returns (Q+3) | Returns (Q+4) |
|---|---|---|---|---|
| (1) | (2) | (3) | (4) | |
| 3SLS | ||||
| Real_vs_All | -0.355*** | -0.572*** | -0.558*** | -0.393*** |
| [-4.635] | [-5.200] | [-4.250] | [-2.695] | |
| Log Assets | -0.007*** | -0.012*** | -0.018*** | -0.024*** |
| [-3.496] | [-4.084] | [-4.959] | [-5.935] | |
| M_B | -0.005*** | -0.008*** | -0.010*** | -0.010*** |
| [-4.625] | [-4.700] | [-4.667] | [-4.303] | |
| Z Score | -0.003*** | -0.004*** | -0.005*** | -0.007*** |
| [-4.082] | [-3.375] | [-4.150] | [-4.424] | |
| Cash Flow | 0.110** | 0.163** | 0.206*** | 0.225** |
| [2.447] | [2.532] | [2.623] | [2.541] | |
| Growth | -0.006 | -0.030 | -0.013 | -0.038 |
| [-0.298] | [-1.002] | [-0.348] | [-0.898] | |
| Leverage | 0.010 | 0.017 | 0.012 | -0.008 |
| [0.478] | [0.574] | [0.316] | [-0.188] | |
| Observations | 4,377 | 4,376 | 4,358 | 4,328 |
The table reports 3SLS results for equations D simultaneously estimated with equations A, B and C (untabulated). Returns (Q+x) is firm’s cumulated market returns x quarters ahead; Real_vs_All is computed as [Decile Real EM/(Decile Accrual EM + Decile Real EM + Decile Guidance EM)]; Cash Flow is operating cash flow divided by total assets; Growth is firm’s sales growth with respect to the previous quarter; Leverage is total liabilities divided by total assets. All other variables are defined in Table 2. *,**,*** indicate statistical significance at 10%, 5%, 1% level, respectively. P-values are two tailed. z-statistics in brackets.
In order to investigate the effect of using real earnings management, rather than accrual-based earnings management or guidance of analysts’ expectations, we use as regressor in (D) the variable Real_vs_All. To document the persistence of this effect, we use as the dependent variable in (D) firms’ market returns accumulated from one quarter ahead (Returns Q+1), two quarters ahead (Returns Q+2), three quarters ahead (Returns Q+3), and four quarters ahead (Returns Q+4). In equation (D), Cash Flow is firm’s operating cash flow standardized by total assets, Growth is firm’s sale growth with respect to the previous quarter, and Leverage is total liabilities divided by total assets.
The negative and statistically significant coefficients on Real_vs_All in Table 7 provide support for our conjecture that real manipulation is the most costly earnings game strategy for shareholders, since it is systematically negatively associated with future market performance. This finding is consistent with those reported in Graham et al. (2005), which show that executive who engage in real activity manipulations are willing to undertake economic actions that could have negative long-term consequences and that sacrifice long-term value. The magnitude of the coefficients on Real_vs_All suggest that the negative impact of real manipulations follows a parabolic pattern, indicating that the effects of real manipulations are persistent over time but are particularly strong after one quarter.
Therefore, our results suggest that equity and career incentives are effective in aligning CEOs’ behavior and shareholders’ interests since they prevent CEOs from managing firms’ operations with negative effects on shareholder value.
Additional Analysis
Our investigation focused on the trade-off between real earnings management versus the other two options available to executives to engage in the numbers game. However, we did not directly compare accrual-based earnings management and guiding analysts’ expectations because it is challenging to ex-ante anticipate which is more costly. Academic research and the popular press has argued that it became particularly costly for firms to engage in accrual-based earnings management activities in the post-SOX period because of increased regulatory and auditing scrutiny and the more stringent enforcement of securities regulations (Cohen et al., 2008; Bartov and Cohen, 2009). The increase in fines and regulatory scrutiny implies that the expected penalty for aggressive financial reporting has also increased (Lobo and Zhou, 2006). Guiding analysts’ expectations might also be a costly strategy because it requires that the firm disseminate bad news to analysts to decrease their expectations, with the possibility of a reputational cost for the company and the CEO. In this line, results in Keung et al. (2010) suggest that managing analysts’ earnings expectations downward may also have a cost for the firm. Therefore, if neither accrual-based earnings management or analysts’ guidance alter firms’ real operations— and, thus, impose less real costs on the firm—the relative costliness of the two strategies becomes an empirical issue, which we address in this part of the paper.
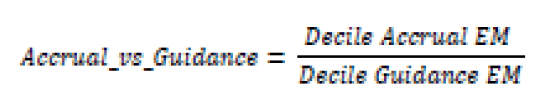
Table 8 replicates the analysis reported in Table 6 using as the dependent variable the variable Accrual_vs_Guidance, which is defined as:
| TABLE 8: Aem Vs Guiding Analysts' Expectations | |
| Dependent variable: Accrual_vs_Guidance | |
|---|---|
| 3SLS | |
| Equity Incentives | -11.078*** |
| [-3.780] | |
| Risk Incentives | 3.287** |
| [2.103] | |
| Career Concerns | -0.029*** |
| [-3.779] | |
| Log Assets | 0.317** |
| [2.431] | |
| Cycle | -0.002** |
| [-2.453] | |
| M_B | 0.143*** |
| [3.378] | |
| Z Score | 0.114*** |
| [3.221] | |
| Market Share | 0.922** |
| [2.481] | |
| NOA | -1.040** |
| [-2.104] | |
| Tenure Auditor | -0.017** |
| [-2.259] | |
| ROA | 14.650*** |
| [3.374] | |
| Tenure CEO | 1.675*** |
| [3.705] | |
| Year Dummies | YES |
| Quarter Dummies | YES |
| Industry Dummies | YES |
| Observations | 4,471 |
The negative and statistically significant coefficients on CEOs’ equity incentives and career concerns in Table 8 suggest that, when CEOs are aligned with shareholders in terms of equity incentives and career concerns, they prefer to guide analysts instead of manipulating accruals. This finding is consistent with the fact that CEOs perceive accrual manipulations in the post-SOX period to be a particularly costly form of earnings management.
The positive and significant coefficient on CEOs’ risk incentives is consistent with results documented in Grant et al. (2009), showing that managers incented to take risks use incomesmoothing to reduce the unintended consequences of risk-taking without reducing the intended consequences. These results are also in line with those of Armstrong et al. (2013), who argue that CEOs have incentives to create accounting reserves to protect themselves when they engage in future risky projects with potentially low payoffs.
The table reports 3SLS estimate results for equations A simultaneously estimated with equations B and C (untabulated). Accrual_vs_Guidance is computed as (Decile Accrual EM/ Decile Guidance EM). All other variables are defined in Table 2. *,**,*** indicate statistical significance at 10%, 5%, 1% level, respectively. P-values are two tailed. z-statistics in brackets.
| Table 9: Aem Vs Guiding Analysts' Expectations: Effects On Performance | ||||
| Dependent variable: | Returns (Q+1) | Returns (Q+2) | Returns (Q+3) | Returns (Q+4) |
|---|---|---|---|---|
| (1) | (2) | (3) | (4) | |
| 3SLS | ||||
| Accrual vs Guidance | -0.027*** | -0.053*** | -0.052*** | -0.013 |
| [-4.690] | [-6.210] | [-5.000] | [-1.120] | |
| Additional Controls | Included | Included | Included | Included |
| Observations | 4,377 | 4,376 | 4,358 | 4,328 |
To investigate the impact on future market performance of using accrual manipulations instead of guiding analysts, and triangulate our results, we estimate equation system A-D using as earnings management proxy the variable Accrual_vs_Guidance (Table 9). The negative and statistically significant coefficient on Accrual_vs_Guidance provides support for the assumption that accrual earnings management is more costly than guiding analysts. Specifically, results show that, as firms substitute analyst guidance with accrual earnings management, their future market performance declines. Therefore, once again equity-based incentives and career concerns appear to be effective in aligning CEOs’ and shareholders’ interests, at least in terms of influencing the earnings game strategy to be used.
The table reports 3SLS results for equations D simultaneously estimated with equations A, B and C (untabulated). The analysis includes all controls used in Table 7. *,**,*** indicate statistical significance at 10%, 5%, 1% level, respectively. P-values are two tailed. z-statistics in brackets.
Robustness Checks
Performance-Matched Earnings-Management Measures
Since Kothari et al. (2005) and Cohen et al. (2011) argue that traditional accrual and real earnings management measures tend to be mis-specified, we used a performance-matched approach in the main analyses. However, to test the robustness of our results to alternative earnings management proxies, we conduct our analyses using raw earnings management metrics (i.e., without performance matching) and find results qualitatively similar to those reported.
Suspect Firms
Since our research framework assumes that firms engage in the earnings game in order to meet/beat earnings targets, we conducted our investigation focusing on suspect firms, as commonly defined in the literature. Since this conservative approach reduces our final sample, we repeated the analysis using the full sample of observations and found results that were qualitatively similar to those reported.
Endogeneity Between CEOs’ Incentives and Future Market Performance
Equation (D) does not include CEOs’ incentives among the independent variables. Since 3SLS estimates might be particularly sensitive to the inclusions/exclusion of regressors that are modeled as endogenous in the system, we estimate equations A, B, C, and D by including in D CEOs’ equity incentives, risk incentives, and career concerns. Untabulated results show that the coefficient on the variable Real_vs_All continues to be negative and statistically significant across all model specifications.
Conclusions
The literature has shown that the market rewards firms that meet or beat their earnings expectations (Degeorge et al., 1999; Brown and Caylor, 2005), so companies that are not able to meet earnings targets in the normal course of their operations may engage in the “earnings game” by choosing among three non-exclusive strategies: accrual-based earnings management, real activity manipulation, and guiding analysts’ expectations. These strategies are not equivalent in terms of the costs they impose on the firm because real earnings management, unlike accrual-based earnings management and guiding analysts’ expectations, causes firms’ real operations to deviate from their normal course without an underlying economic reason, possibly impairing future performance. Previous literature has shown that the introduction of SOX in 2002 increased the use of real earnings management, so further research aimed at clarifying what kinds of incentives might induce firms to substitute real earnings management with another alternative is needed.
Using a sample of quarterly observations from US firms over the period 2003-2010, we show that CEOs with high equity incentives and high career concerns are more likely than other CEOs to substitute real activity manipulations with other earnings management strategies. We also analyze the economic impact of the three earnings game strategies and find that, when firms use real earnings management rather than accrual-based earnings management or guidance of analysts, their firms’ future market performance decreases. Therefore, our results confirm our conjecture that real earnings management imposes particularly high costs on firms. Equity incentives and career concerns are effective in aligning CEOs’ and shareholders’ interests since they prevent executives from manipulating real operations with negative effects on shareholder value.
EndNotes
1 Following Matsumoto (2002), for firms that report a balance for PPE in the fourth fiscal quarter but report missing data in quarters 1-3, we compute the year-to-year change in PPE and add to each of the interim quarters a proportional amount of this change based on the proportion of annual depreciation incurred in that quarter.
2 Following Zang (2012), we do not examine abnormal cash flows from operations because real activities manipulation impacts it in various directions, and the net effect is ambiguous (see also Roychowdhury, 2006).
3 Since we are using quarterly data, we follow Bartov and Cohen (2009) in focusing on selling and general and administrative (SG&A) expenses that are available on a quarterly basis. In Compustat, quarterly SG&A expenditures also include R&D investments.
4 We focus on analysts’ forecasts because Brown and Caylor (2005) show that, in recent years, managers seek to avoid missing quarterly earnings more than missing other targets and because analysts’ earnings forecast is the only target that can be reached using all three of the earnings game strategies considered here.
5 We excluded firm i from the computation. Note that since our instruments are computed for each year/industry combination, we cannot include fixed effects in equations (B) and (C).
References
- Adut, D., A.D. Holder, & A. Robin (2013). Predictive versus opportunistic earnings management, executive compensation, and firm performance. Journal of Accounting and Public Policy, 32 (3), 126-146.
- Altman, E. (2000). Predicting financial distress of companies: Revisiting the Z-Score and ZETA models. New York University Working Paper.
- Armstrong, C. S., D. F. Larcker, G. Ormazabal, & D. J. Taylor (2013). The relation between equity incentives and misreporting: The role of risk-taking incentives. Journal of Financial Economics. In Press.
- Bartov, E., & D. A. Cohen (2009). The “numbers game” in the pre- and post- Sarbanes-Oxley eras. Journal of Accounting, Auditing & Finance, 24 (4), 505–534.
- Bartov, E., D. Givoly, & C. Hayn (2002). The rewards to meeting or beating earnings expectations. Journal of Accounting and Economics, 33 (2), 173–204.
- Bauman, M. P., & K. W. Shaw (2006). Stock option compensation and the likelihood of meeting analysts’ quarterly earnings targets. Review of Quantitative Finance and Accounting, 26 (3), 3-25.
- Bauman, M. P., M. Braswell & K. W. Shaw (2005). The numbers game: How do managers compensated with stock options meet analysts’ earnings forecasts? Research in Accounting Regulation, 18 (1), 3-25.
- Bergstresser, D., & T. Philippon (2006). CEO incentives and earnings management. Journal of Financial Economics, 80 (3), 511–529.
- Brown, L. D., & M. L. Caylor (2005). A temporal analysis of quarterly earnings thresholds: Propensities and valuation consequences. The Accounting Review, 80 (2), 423–440.
- Burgstahler, D., & I. Dichev (1997). Earnings management to avoid earnings decreases and losses. Journal of Accounting and Economics, 24 (1), 99–126.
- Chen, J. Z., L. L. Rees, & S. Sivaramakrishnan (2010). On the use of accounting vs. real earnings management to meet earnings expectations - a market analysis. SSRN Working Paper.
- Cheng, Q., & T. D. Warfield (2005). Equity incentives and earnings management. The Accounting Review, 80 (2), 441–476.
- Choi, J. S., Y.M. Kwak, & C. Choe (2014). Earnings Management Surrounding CEO Turnover: Evidence from Korea. Abacus, 50 (1), 25-55.
- Cohen, D. A., & P. Zarowin (2010). Accrual-based and real earnings management activities around seasoned equity offerings. Journal of Accounting and Economics, 50 (1), 2–19.
- Cohen, D. A., S. Pandit, C. E. Wasley, & T. Zach (2011). Measuring real activity management. SSRN Working Paper.
- Cohen, D., Dey, & T. Lys (2008). Real and accrual-based earnings management in the pre- and post-Sarbanes-Oxley periods. The Accounting Review, 83 (3), 757–787.
- Coles, J. L., N. D. Daniel, & L. Naveen (2006). Managerial incentives and risk-taking. Journal of Financial Economics, 79 (2), 431–468.
- Comin, D., & T. Philippon (2005). The rise in firm-level volatility: Causes and consequences. NBER Macroeconomics Annual 2005, 20 (1), 167-228.
- Core, J. E., R. W. Holthausen, & D. F. Larcker (1999). Corporate governance, chief executive officer compensation, and firm performance. Journal of Financial Economics, 51 (3), 371–406.
- Core, J. E., W. Guay, & D. F. Larcker (2003). Executive equity compensation and incentives: A survey. Economic Policy Review, 9 (1), 27–50.
- Core, J., & W. Guay (2002) Estimating the value of employee stock option portfolios and their sensitivities to price and volatility. Journal of Accounting Research, 40 (3), 613–630.
- Coughlan, A. T., & R. M. Schmidt (1985). Executive compensation, management turnover, and firm performance: An empirical investigation. Journal of Accounting and Economics ,7 (1–3), 43–66.
- Das, S., K. Kim, & S. Patro (2011). An analysis of managerial use and market consequences of earnings management and expectation management. The Accounting Review, 86 (6), 1935-1967.
- Davidson III, W. N., B., Xie, W., Xu, & Y., Ning. (2007). The influence of executive age, career horizon and incentives on pre-turnover earnings management. Journal of Management & Governance, 11 (1), 45-60.
- Dechow, P. M. (1994). Accounting earnings and cash flows as measures of firm performance: The role of accounting accruals. Journal of Accounting and Economics, 18 (1), 3–42.
- Dechow, P. M., R. G. Sloan, & A. P. Sweeney (1995). Detecting earnings management. The Accounting Review, 70(2), 193-225.
- Dechow, P. M., S. P. Kothari, & R. Watts (1998). The relation between earnings and cash flows. Journal of Accounting and Economics, 25 (2), 133-168.
- Degeorge, F., J. Patel, & R. Zeckhauser (1999). Earnings management to exceed thresholds. Journal of Business, 72(1), 1-33.
- Demers, E., & C. Wang (2010). The impact of CEO career concerns on accruals based and real earnings management. INSEAD Working Paper No. 2010/13/AC.
- Duellman, S., A.S. Ahmed, & A.M. Abdel-Meguid (2013). An empirical analysis of the effects of monitoring intensity on the relation between equity incentives and earnings management. Journal of Accounting and Public Policy, 32 (6), 495-517.
- Fabrizi, M., C. Mallin, & G. Michelon (2014). The role of CEO’s personal incentives in driving corporate social responsibility. Journal of Business Ethics, 124 (2), 311-326.
- Fabrizi, M., & A. Parbonetti (2016). CEO Risk Incentives and Real Earnings Management. International Journal of Business and Management, 11 (3), 37-51.
- Fama, E. (1980). Agency problems and the theory of the firm. Journal of Political Economy, 88 (2), 288-307. Fredrickson, J. W., D. C. Hambrick, & S. Baumrin (1988). A model of CEO dismissal. Academy of ManagementReview, 13 (2), 255–270.
- Ge, W., & J.B. Kim (2014). Real earnings management and the cost of new corporate bonds. Journal of Business Research, 67 (4), 641-647.
- Gong, J. J., & S. Li (2013). CEO incentives and earnings prediction. Review of Quantitative Finance and Accounting, 40 (4), 647-674.
- Graham, J. R., C. R. Harvey, & S. Rajgopal (2005). The economic implications of corporate financial reporting.Journal of Accounting and Economics, 40 (1-3), 3–73.
- Grant, J., G. Markarian, & A. Parbonetti (2009). CEO risk-related incentives and income smoothing. Contemporary Accounting Research, 26 (4), 1029–1065.
- Gunny, K. A. (2010). The relation between earnings management using real activities manipulation and future performance: evidence from meeting earnings benchmarks. Contemporary Accounting Research, 27 (3), 855–888.
- Holmström, B. (1999). Managerial incentive problems: a dynamic perspective. Review of Economic Studies, 66 (1):169-182.
- Jones, J. (1991). Earnings management during import relief investigations. Journal of Accounting Research, 29 (2), 193-229.
- Keung, E., Z. Lin, & M. Shih (2010). Does the stock market see a zero or small positive earnings surprise as a red flag? Journal of Accounting Research, 48 (1), 105-136.
- Khalil, M., & J. Simon (2014). Efficient contracting, earnings smoothing and managerial accounting discretion. Journal of Applied Accounting Research, 15 (1), 100-123.
- Kim, J. B., & B.C. Sohn (2013). Real earnings management and cost of capital. Journal of Accounting and Public Policy, 32 (6), 518-543.
- Kothari, S. P., A. J. Leone, & C. E. Wasley (2005). Performance matched discretionary accrual measures. Journal of Accounting and Economics, 39 (1), 163–197.
- Kuang, Y. F., B. Qin, & J.L. Wielhouwer (2014). CEO Origin and Accrual-Based Earnings Management. Accounting Horizons, 28 (3), 605-626.
- Lobo, J. L., & J. Zhou (2006). Did conservatism in financial reporting increase after the Sarbanes-Oxley Act? Initial evidence. Accounting Horizons, 20 (1), 57–73.
- Matsumoto, D. A. (2002). Management’s incentives to avoid negative earnings surprises. The Accounting Review, 77 (3), 483–514.
- Murphy, K. J. (1999). Executive compensation. Handbook of Labor Economics, 3, 2485–2563.
- Pourciau, S. (1993). Earnings management and nonroutine executive changes. Journal of Accounting and Economics, 16 (1-3), 317–336.
- Rogers, D. A. (2002). Does executive portfolio structure affect risk management? CEO risk-taking incentives and corporate derivatives usage. Journal of Banking and Finance, 26 (2-3), 271–295.
- Rogers, D. A. (2005). Managerial risk-taking incentives and executive stock option repricing: A study of US casino executives. Financial Management, 34 (1), 95–121.
- Roychowdhury, S. (2006). Earnings management through real activities manipulation. Journal of Accounting and Economics, 42 (3), 335–370.
- Schipper, K. (1989). Commentary on earnings management. Accounting Horizons, 3 (4-5), 91-102.
- Wells, P. (2002). Earnings management surrounding CEO changes. Accounting & Finance, 42 (2), 169-193. Yermack, D. (1995). Do corporations award CEO stock options effectively? Journal of Financial Economics, 39 (2- 3), 237–269.
- Zang, A. Y. (2012). Evidence on the trade-off between real activities manipulation and accrual-based earnings management. The Accounting Review, 87 (2), 675-703.