Research Article: 2021 Vol: 25 Issue: 3S
CEO Ownership, Family Ownership, and Stock Performance: Evidence from Thailand
Salakbun Wongakaradeth, Globlex Securities Bangkok Thailand
Sakkakom Maneenop, University Bangkok Thailand
Abstract
We examine the roles of CEO and family ownerships in firm performance using data from listed companies in Thailand. We find that family firms whose CEO holds the significant level of shares deliver the higher stock returns and accounting performance than the other firms. Our results suggest that, in markets with weak legal protection for investors, investors can gain abnormal returns by investing in firms with this specific ownership structure. This type of firm can reduce the agency problems type I (conflict between manager and shareholders) and type II (conflict between majority and minority shareholders), whereas other firms may be able to mitigate only type I problems.
Keywords:
CEO and Family Ownership, Agency Problems, Stock Performance
Introduction
Several studies have investigated the effect of concentrated-ownership structure, such as CEO or family ownership on stock returns or company performance (Lilienfeld-Toal & Ruenzi, 2014; Eugster & Isakov, 2019). These studies have linked evidence of stock returns or solid performance to agency problems and found that these companies had higher performance because agency problems could be reduced when a CEO holds a large number of shares. However, the results in developed countries as compared to emerging countries are different because of the legal protection of investors.
Agency problems are one of the crucial factors that affect the firm performance and market value in both developed countries and emerging countries (Sheng & Shan, 2011). There are two types of agency problems. The first is the famous owner-manager conflict or Type I agency problem, which occurs with the separation of managers from shareholders, which might lead to managers becoming uninterested to do the best for the shareholder (Jensen & Meckling, 1976). On the other hand, a Type II agency problem is a conflict between majority and minority shareholders. The majority shareholders, mostly the family members, may seek personal benefits at the expense of minority shareholders as they hold substantial ownership and have controlling position in the firm. Founding families are the primary type of block holders to hold control privileges in excess of their cash-flow rights.
According to managers’ and shareholders’ different interests, the Type I agency problems may arise. However, these Type I agency problems can be mitigated by having a family or CEO as the family shareholders hold control over the manager, or the owner having the same interest if CEO owners and shareholders are the same persons. Jensen and Murphy (1990) explain that the solution to the problem is that the principal should pay the manager adequately. As a result, in developed countries, the CEO's greatest incentive is to own a stake in the company. In a developed country, investors are not excessively concerned about Type II as high legal protections for investors are offered to minority investors, which is dissimilar to emerging countries. In contrast, companies in an emerging country like Thailand are family- based companies in which Type II agency problems often occur. A solution to this issue is to have multiple shareholders within a company, or managers having ample power not to be under the majority shareholder control. Therefore, it is expected that if the company consists of CEO and family members’ shareholding, it will be able to reduce both type I AND type II agency problems as a result.
As one of emerging countries, Thailand has experienced the agency problem of both Type I and Type II. However, the family companies where CEOs hold significant shares deliver the best stocks and stable performance. This can imply that these firms can decrease the agency problems. In terms of Type I, the CEO is motivated to maximize the company's value, while family members monitor the manager to increase the wealth. At the same time, the structure of ownership is transformed into having more than two shareholder groups, CEO ownership, family ownership and minority ownership, which counterbalance each other and protect the expropriation of personal interests, thus solving the Type II problems. On the other hand, the only-CEO or only-family firms can mitigate the Type 1 agency problem which generates firm performance well as opposed to stock performance.
This paper investigates the stock performance of Thai listed companies which focus on the firms in which the CEO holds the significant portion of shares in the family firm from January 2003 to December 2018. The study examines the relationship of stock returns and the shareholder groups using the model of multivariate regression with the control variables suggested by Eugster & Isakov, (2019) to find whether the interesting-shareholder group can deliver the higher stock returns. Four-factor model of Carhart (1997) is also administered to measure the abnormal returns of the shareholder group. Moreover, the source of stock returns relying on the firm’s performance is explored using the measurement of a multivariate regression model. We find that family firms whose CEO holds the significant level of shares deliver abnormal returns of 4.68% per year. Moreover, they also generate higher profitability and Tobin’s Q.
Literature Review
Agency Problem
According to Agency theory, the principal’s wealth cannot be maximized if there is conflict between agent and principal or if they have different objectives and accesses to information. (Tipuri & Podrug, 2010). In corporate finance, an agency problem also known as a conflict of interest between a company's management and the company's stockholders. The manager, or agent, is supposed to maximize the shareholder wealth. Normally, the agency problem will not happen if there is no relationship between the principal and agent. Regarding the agency problem, there are two main types of problems: Type I is the conflict between managers and shareholders, and Type II is the conflict between majority and minority shareholders.
Jensen & Meckling, (1976) originally look into the agency problem and found conflicts between managers and shareholders widely spreading in U.S. companies. These problems arise from the reason that frequently, managers are not the true owners of the firms they manage. Additionally, most CEOs of large U.S. companies hold only a small amount of their firm’s stock. In general, shareholders need CEOs to do normal action such as deciding which issue or project to continue working on, and which project needs to be dropped if the cost to continue is more than the return. However, the CEOs only focus on their private gains and forget to follow the financial activities. It is believed that the conflicts can be reduced by tying the CEO’s benefit and welfare to shareholder wealth. So, the CEO can make appropriate decisions that are aligned with shareholder interests.
Separating the CEO from the shareholders can prevent the CEO from acting in the best interests of the shareholders. Type I agency problems can also be mitigated in family companies for several reasons. Firstly, family owners tend to hold concentrated ownership of their firms as they are likely to have strong motivations to monitor managers in order to decrease free rider problems in their firm. (Shleifer & Vishny, 1986). Secondly, family CEOs tend to have longer investment plans than other shareholders (Stein, 1988) for the reason that they view the firms as an asset to pass on to future generations. Thirdly, founding families want to protect their family’s reputation and also want to build up wealth. Therefore, they tend to deal with other stakeholders by themselves. As a result, family companies have a stronger incentive to perform a more powerful audit than any other shareholder. Lastly, in a family firm with a family CEO, the owner and the CEO are the same person, so, there should be no incentive misalignment and Type I agency problems should not exist. Moreover, Jensen and Murphy (1990) also find that having ownership in their firm’s stock is the largest CEO performance incentive. A firm can reduce conflict between the owner and CEO and provide incentives for a CEO to take appropriate actions with a compensation policy that ties the CEO’s welfare to shareholder’s wealth such as providing CEOs the firm stocks. This implies that providing a CEO with stock ownership is an approach to lessen the Type I agency problems.
Conflicts between majority and minority shareholders are viewed as the second type of agency problems. In this case, the majority shareholder may expropriate the private benefits from minority shareholders (Shleifer & Vishny, 1986). Family ownership firms have a large number of shareholders with other small shareholders. As a result, family firms are subject to severe agency problems between family owners or majority shareholders and minority shareholders.
Burkart, et al., (2003) explains the cause of this agency problem. It occurs when the ownership structure is concentrated with significant control in their firms, then giving them the opportunity to extract private benefits from the controlling shareholders. In the same way, Villalonga & Amit, (2009) explain that the Type II occurs when the ownership has the power of control rights and cash-flow rights. Moreover, family ownership is the main type of blockholder to hold control rights in excess of the cash-flow rights in the U.S. firms.
However, this problem may also be minimized by either providing the CEOs as a shareholder or compensating them based on stock price performance so that they would be incentivized to maximize the company's value with the right motivations. The interests of both the shareholders and the CEOs will be consistent and aligned with benefits from the share price increase.
Sarkar (2010) differentiates the nature of the entity problems, which are characterized by ownership and intensive control. For non-concentrated ownership structures, agency issues can arise from a Type I agency problem. In many countries with concentrated ownership, conflicts of interests between large controlling shareholders and small outside shareholders are greater (Eun & Resnick, 2008).
In developed countries, the Type I agency problem occurs between manager and shareholders (Katah, 2009). Accordingly, there are several governance mechanisms to reduce the Type I and align the interests between shareholders and managers. These include internal mechanisms such as a concentrated ownership committee, executive compensation packages, and external regulatory mechanisms such as product competition, management-labor market, etc. (Damsetz & Lehn, 1985). Moreover, developed countries such as the U.S., the U.K. and Canada are common law countries which offer the strongest form of law protection for the investors.
However, in emerging countries, legal institutions are less developed (Pirinsky & Stulz, 2007) which lead the controlling shareholder to more easily take advantage of minority shareholders. Hence, conflicts between majority and minority shareholders or the Type II agency problem may arise. These conflicts are likely to increase the cost of capital since firms must pay higher dividends to attract investors (Bae et al., 2002; Lins, 2003) which mean higher costs of capital, leading to lower firm valuations. Consequently, the Type II problem can undermine firm competitiveness and discourage investor participation.
Since concentrated ownership is the primary cause of conflicts, the principle of increasing ownership concentration is irreversible and can make things worse (Faccio et al., 2001), even if the concentrated ownership as governance mechanisms in emerging countries may reduce Type I agency conflict. However, controlling shareholders is different from dispersed shareholders in terms of audit roles and expropriation capabilities. North (1990) provides three reasons why monitoring costs may be higher in emerging countries with principal-principal conflicts. First, the legal protection of investors in emerging countries is ambiguous, leading to higher audit costs as it is more difficult to determine the duration of the contract. Secondly, in emerging countries, managers are also controlling shareholders; they can bypass traditional mechanisms such as the board of directors to take control of the benefits (Dharwadkr et al., 2000). Finally, ownership concentration reduces the liquidity of the stock market which results in less information content in share prices.
Controlling ownership in emerging countries often occurs in family firms (Chen, 2001; La Porta et al., 1999) which may reduce agency problems by aligning the interests between managers and shareholders. On the other hand, family firms may increase the situation of expropriation of non-family shareholders which will be able to destroy the firm performance (Bloom & Reenen, 2006). Therefore, we can find both Type I and Type II agency problems in emerging countries.
However, in the case of Thailand as one of the emerging countries, a study by Sitthipongpanich (2017) finds that the ownership structure in Thailand is highly concentrated. This is similar to the situation of many Southeast Asian countries with economic and institutional developments reflecting weak investor protection due to a large shareholding taking control of the agency problems and ownership incentives to maximize firm values.
Stock Returns and Accounting Performance
Several studies have found that companies, whose ownership and control are aligned, achieve better corporate performance than those with ownership and control separation (Daily & Dollinger, 1992). Anderson & Reeb, (2003) also find that family firms perform better than non-family firms. However, performance may differ between developed and emerging countries due to other factors such as different ownership structures, investor legal protections, etc. as previously described. The following sections describe previous studies on stock and firm performances between CEO ownership and family ownership firms, separated by developed and emerging countries.
Lilienfeld-Toal & Ruenzi, (2014) examined the relationship between CEO-owned companies and the company performance in the United States. They find that companies with high-management ownership generate higher return on assets (ROA) and lower expenses. They explain that CEO owners do not extract large rents in terms of higher total compensation. The agency conflicts were reduced in CEO ownership firms with the ability to deliver the positive annual abnormal returns from 4% to 10%. CEOs attempt to increase their firm values in relation to the CEO’s shareholding as an incentive; and the market cannot fully reflect this feature, which lead finally to initiate the abnormal return. Moreover, there are also several studies which support the argument that managerial ownership helps align manager’s interests to maximize firm values (Jensens & Meckling, 1976; Jensen & Murphy, 1990). The result investigated by Eugster & Isakov, (2019) is somewhat similar. The family ownership firms in Switzerland reveal stronger incentive that can maximize the firm performance illustrating that the family firms are more profitable than other types of firms measured by ROA and Tobin’s Q. The evidence was found disclosing the family firms’ stock returns are significantly higher than non-family firms generating an abnormal return of 2.8% to 7.1% per year.
Some researchers argue that conclusions drawn from developed countries may not be valid for emerging markets due to institutional voids (Chung & Luo, 2012). Al-Khouri (2008) studies CEO ownership and firm performance operating in 89 industries in Sudan, an emerging country. An insignificant relationship below 25% is found. The results also indicate a negatively significant relationship between ownership by a CEO of less than 5%. This was verified by Kuan, et al., (2000) who agree that CEO ownership in Singapore listed companies is a positive function of market value. Therefore, it seems that low ownership by management does not give them incentives to work for the interest of shareholders if the CEOs expect their firms to have better investment opportunities and perform well.
In another study concerning the family ownership in Turkey, Sener (2014) explores the relationship between family ownership and firm performance. Family firms there widely use pyramidal structure with the absence of legal safeguards. Positive contribution of family involvement has been found to result in profitability reaching its peak at moderate ownership levels (20%-30%) but disappear above the 50% ownership level. This study confirms that family ownership generates higher firm performance than non-family ownership.
In Thailand, the investor’s legal protection is considered relatively low allowing the controlling shareholders to easily extract private benefits from other investors. Pisanpan (2014) and Sitthipongpanich (2017) have found that Thai family-firm owners have been motivated to decrease the agency costs and maximize the shareholder’s wealth. This evidence also leads to the increase of firm performance and provide positive results on return on assets (ROA) and return on equity (ROE). Some studies reveal that concentrated ownership in emerging countries, either family ownership or CEO ownership, has higher firm performance but lower firm value (Sener, 2014) due to the lack of well-developed legal and regulatory institutions.
Data and Methodology
Data
This empirical study analyzes public information of the dataset of 721 companies listed in the Stock Exchange of Thailand (SET) from January 2002 to December 2018 covering a seventeen-year period excluding finance and property sectors. The analysis begins in January 2002 because of the data availability on the risk-free rate applying the portfolio-based approach. The total sample is equal to 58,555 firm-month observations. We collect CEO and family member ownership information from SETSMART. Financial and stock price data are collected from Eikon Datastream.
We generate the main variables into 4 types including 1) CEO ownership, 2) Family ownership, 3) Both CEO and family ownership, and 4) The non-specific type ownership. In terms of the family ownership, the cut-off point of family members holding the firm shares more than 25% following Eugster & Isakov, (2019) has been applied. However, the family ownership with holding of manager’s shares is net if they come from the family. In terms of the CEO ownership, the cut-off point of holding more than 10% shares is applied following the study of Lilienfeld-Toal & Ruenzi, (2014) and Raff (2018). For robustness check, we also use other cut-off point criteria: 5%, 10%, Top10%, and Top20% to confirm that our results are not driven by a small number of very large firms. However, the results are rather similar on the stock abnormal returns test of the four-factor model of Carhart (1997).
The dependent variable is monthly stock returns of each firm. As for the control variables, the study has applied the approach proposed by Lilienfeld-Toal & Ruenzi (2014); Eugster & Isakov (2019) for example, logBM, logSize, Price, Volatility, Amihud’s illiquidity, Dividend yield, Leverage, Operating margin, Sales to total assets, AG_1year, AG_5year, SG_1year, SG_5year, Return_2_3, Return_4_6, Return_7_12, and CG Score. Besides the industry dummy fixed effect, 69 classifications of the Global Industry Classification Standard (GICS) are administered. In terms of the measurement of firm performance, the return-on-asset (ROA) and Tobin’s Q have been used. Variable definitions can be found in Appendix.
Methodology
To examine the role of CEO and family ownerships to firm performance, we use multivariate regression and portfolio-based approach.
Stock Returns of the Both CEO and Family Ownership
Firstly, we find a relationship between both the CEO and family ownership and stock returns using multivariate regression with clustered standard error (PCSE) where the standard errors are two dimensional along the firm and time dimension. The cluster standard error (PCSE) is a good choice when the panel dataset has a fixed effect or both time and static effects. This approach is used by Lilienfeld-Toal & Ruenzi, (2014); Eugster & Isakov, (2019).
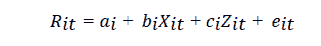
According to equation (1), Rit is the total returns of firm i in month t, Xit is the dummy variable for firm i in each group of ownership structure in month t, Zit a vector of firm characteristics or control variables composed of logBM, logSize, Price, Volatility, Amihud’ s illiquidity, Dividend yield, Leverage, Operating margin, Sales to total assets, AG_1year, AG_5year, SG_1year, SG_5year, Return_2_3, Return_4_6, Return_7_12, and GICS industry dummy.
We also use a portfolio-based approach to investigate if firms with specific ownership structures can earn abnormal returns. We use Fama-French-Carhart four-factor model that captures market risk, size, value, and momentum factors. We form three different portfolios; (1) portfolio with firms with CEO ownership, (2) portfolio with firms with family ownership, and (3) portfolio with both CEO and family ownership. We rebalance each portfolio at the end of June.
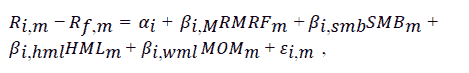
where Ri,m is the return of portfolio i in month m, Rf,m is the risk-free rate in month m,
RMRFm is the excess return between the market portfolio and the risk- free rate in month m,
SMBm is the return difference between small and large capitalization stocks in month m,
HMLm is the return difference between high and low book- to- market stocks in month m,
MOMm is the return difference between stocks having outperformed past returns and stocks
having underperformed past returns in month m, and αi is the abnormal return in month m.
The Firm Performance of Both CEO and Family Ownership
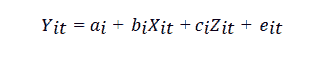
Moreover, company performance measured by ROA and Tobin Q has been examined with the same methods, the multivariate regression of firm- characteristic approach, but the dependent variable has been changed to ROA and Tobin’ s Q, and the control with logSize, Leverage, Capex/ PP&E, SG_1, and GICS industry dummy accordingly with the work of Eugster & Isakov, (2019). Also, the period of month has been altered to the period of year (t) because the study is aimed to find out whether or not the source of higher stock returns during the year comes from the annual operating performance. The multivariate regression:
Empirical Results
Baseline Results
First of all, the statistics of a full example for Thai listed companies is summarized excluding financial firms and real estate investment trusts (REITs) between 2002 and 2018, shown in Table 1. The table is divided into two parts, which are 1) the percentage of the ownership ratio and 2) the average of each nature of the company.
| Table 1 Summary Statistics |
|||||||||||
|---|---|---|---|---|---|---|---|---|---|---|---|
| Variables (Mean) | Type of ownership structure | (1) - (2) | (1)-(3) | (1) - (4) | (2) - (3) | (2) - (4) | (3) - (4) | ||||
| ALL | CEO | Family | Both | None | Difference | Wilcoxon Rank-sum test | ||||||
| (%) Ownership Stake | 0 | 1 | 2 | 3 | 4 | 5 | 6 | 7 | 8 | 9 | 10 |
| Net Family Ownership | 15.53 | 14.153 | 43.802 | 40.739 | 8.135 | ||||||
| CEO Ownership | 7.352 | 26.197 | 2.013 | 24.646 | 1.235 | ||||||
| Firm Characteristic | |||||||||||
| logSize | 8.114 | 7.92 | 7.666 | 7.582 | 8.306 | 0.254*** | 0.339*** | -0.385*** | 0.084 | -0.640*** | -0.724*** |
| logBM | -0.1 | -0.209 | -0.165 | -0.05 | -0.062 | -0.044 | -0.159*** | -0.147*** | -0.114** | -0.103*** | 0.012 |
| ROA | 0.052 | 0.048 | 0.058 | 0.063 | 0.052 | -0.01 | -0.016* | -0.004 | -0.006 | 0.006 | 0.012* |
| logTobin's Q | 0.231 | 0.29 | 0.3 | 0.22 | 0.203 | -0.01 | 0.070** | 0.087*** | 0.080** | 0.097*** | 0.017 |
| AG_1 | 0.094 | 0.126 | 0.093 | 0.11 | 0.084 | 0.033*** | 0.016 | 0.042*** | -0.017 | 0.009 | 0.026* |
| SG_1 | 0.067 | 0.078 | 0.069 | 0.087 | 0.061 | 0.009 | -0.009 | 0.017 | -0.018 | 0.008 | 0.026 |
| Dividend Yield | 0.05 | 0.048 | 0.052 | 0.052 | 0.05 | -0.004 | -0.004* | -0.002* | 0 | 0.002 | 0.002 |
| CGS | 0.732 | 0.7 | 0.733 | 0.755 | 0.739 | -0.033** | -0.055** | -0.040*** | -0.022 | -0.006 | 0.016 |
| SGA | 0.174 | 0.26 | 0.161 | 0.126 | 0.157 | 0.099* | 0.134*** | 0.102*** | 0.035* | 0.003 | -0.031* |
| N | 5891 | 1070 | 698 | 375 | 3748 | *** p<0.01, ** p<0.05, * p<0.1 | |||||
Columns 1 to column 4 are presenting the mean of each type of ownership structure. Each type of ownership is compared to the firm characteristics. Following Table 1, we find that the both CEO and family firms (column (3)) in Thailand have the firm-characteristic statistics better than the other groups which it might be one of the reasons why this group should generate higher stock performance. 1) Both CEOs and family groups have the lowest market capitalization, with the natural logSize (logSize) 7.582, while the non-specific type of company has the highest, 8.306 logSize with the average of 8.1142). In terms of the natural logarithm of book-to-market (logBM) and Tobin’s Q (logTobin’s Q) which represent the valuation, it has been found that they are the value stocks which are cheaper than the other groups’ stocks . Their logBM and logTobin’s Q are -0.050 and 0.220, respectively, while the average is -0.100 and 0.231, correspondingly. Moreover, 3) do the best in the return on assets (ROA), which is 0.063 and the average is 0.052. 4) The growth of assets and sales is 0.110 and 0.087, while the average is 0.094 and 0.067, respectively.
Baseline Results
To identify the relationship between each ownership structure and stock returns of listed companies in the Stock Exchange of Thailand ( SET) , the regression models are applied. In Table 2, the results of ordinary least squares regression with two- dimensional clustering of standard errors at time and firm dimensions (PCSE) are displayed. The dependent variable is a firm’ s monthly stock return. The main independent variables are the ownership dummy for each ownership structure. In column (1) is the CEO ownership dummy; column (2) is the family ownership dummy; column (3) is the both CEO and family ownership; column (4) is the non- specific type ownership dummy; while columns (5) to (7) include all main dummy variables together in order to support the results. In all regressions, we include the industry fixed effects. While the control variables are logBM, logSize, Price, Volatility, logAmihud, Dividend Yield, Leverage, Op_margin, SalesToAssets, AG_1, AG_5, SG_1, SG_5, RET_2_3, RET_4_6, RET_7_12, and CG Score.
| Table 2 Multivariate Regression: Main Results |
|||||||
|---|---|---|---|---|---|---|---|
| VARIABLES | 1 | 2 | 3 | 4 | 5 | 6 | 7 |
| RET | RET | RET | RET | RET | RET | RET | |
| CEO Ownership | -0.0022 | -0.0015 | 0 | 0 | |||
| (-1.4224) | (-0.9366) | (-0.0205) | (-0.0149) | ||||
| Family Ownership | -0.0015 | -0.0022 | 0.0004 | 0.0001 | |||
| (-0.9447) | (-1.4106) | -0.2226 | -0.0331 | ||||
| Both Ownership | 0.0046** | 0.0039** | 0.0066*** | 0.0066*** | |||
| -2.3873 | -1.9622 | -2.7543 | -2.7228 | ||||
| Non-Specific Ownership | 0.0009 | ||||||
| -0.7256 | |||||||
| logBM | -0.0100*** | -0.0100*** | -0.0099*** | -0.0100*** | -0.0100*** | -0.0095*** | -0.0093*** |
| (-4.5387) | (-4.5755) | (-4.4922) | (-4.5821) | (-4.5563) | (-3.1747) | (-3.1185) | |
| logSize | -0.0049*** | -0.0049*** | -0.0048*** | -0.0049*** | -0.0049*** | -0.0055*** | -0.0051*** |
| (-4.3969) | (-4.3227) | (-4.2738) | (-4.3062) | (-4.3108) | (-4.0571) | (-3.7215) | |
| Price | 0.0000** | 0.0000** | 0.0000** | 0.0000** | 0.0000** | 0.0000** | 0.0000** |
| -2.1602 | -2.1156 | -2.2303 | -2.103 | -2.1059 | -2.3958 | -2.5507 | |
| Volatility | 0.5542*** | 0.5551*** | 0.5561*** | 0.5545*** | 0.5549*** | 0.5285*** | 0.5283*** |
| -6.8897 | -6.9047 | -6.9228 | -6.9072 | -6.9102 | -5.4926 | -5.4922 | |
| logAmihud (illiquid) | -0.0070*** | -0.0070*** | -0.0070*** | -0.0070*** | -0.0070*** | -0.0075*** | -0.0075*** |
| (-9.0036) | (-9.0112) | (-9.0349) | (-9.0050) | (-9.0329) | (-7.8040) | (-7.8298) | |
| Dividend Yield | 0.0186 | 0.0184 | 0.0179 | 0.0185 | 0.0187 | -0.041 | -0.0394 |
| -0.9596 | -0.9489 | -0.9262 | -0.952 | -0.9624 | (-1.1632) | (-1.1128) | |
| Leverage | -0.0219*** | -0.0221*** | -0.0219*** | -0.0221*** | -0.0218*** | -0.0264*** | -0.0247*** |
| (-3.2635) | (-3.2989) | (-3.2552) | (-3.2848) | (-3.2568) | (-3.7727) | (-3.5935) | |
| Op_margin | 0.0142*** | 0.0142*** | 0.0142*** | 0.0142*** | 0.0142*** | 0.0115*** | 0.0117*** |
| -7.3302 | -7.2857 | -7.311 | -7.3213 | -7.2938 | -5.9364 | -6.043 | |
| SalesToAssets | 0.0036*** | 0.0036*** | 0.0036*** | 0.0036*** | 0.0036*** | 0.0039** | 0.0039** |
| -2.8443 | -2.8414 | -2.8453 | -2.8409 | -2.8462 | -2.3775 | -2.3366 | |
| AG_1 | -0.0082* | -0.0083* | -0.0082* | -0.0083* | -0.0083* | -0.0041 | -0.0045 |
| (-1.7204) | (-1.7293) | (-1.7091) | (-1.7290) | (-1.7330) | (-0.7397) | (-0.8206) | |
| AG_5 | -0.0070*** | -0.0069*** | -0.0071*** | -0.0069*** | -0.0069*** | -0.0076*** | -0.0076*** |
| (-2.8241) | (-2.8133) | (-2.8495) | (-2.8245) | (-2.8364) | (-3.0940) | (-3.0683) | |
| SG_1 | -0.0026 | -0.0026 | -0.0026 | -0.0026 | -0.0026 | -0.0015 | -0.0016 |
| (-0.7816) | (-0.7826) | (-0.7820) | (-0.7826) | (-0.7782) | (-0.3473) | (-0.3812) | |
| SG_5 | -0.0007 | -0.0008 | -0.0007 | -0.0007 | -0.0008 | -0.0006 | -0.0006 |
| (-0.3100) | (-0.3332) | (-0.3190) | (-0.3228) | (-0.3300) | (-0.2483) | (-0.2763) | |
| RET_2_3 | -0.0048 | -0.0048 | -0.0049 | -0.0048 | -0.0049 | -0.0163 | -0.0166 |
| (-0.2367) | (-0.2359) | (-0.2390) | (-0.2356) | (-0.2399) | (-0.6508) | (-0.6625) | |
| RET_4_6 | 0.0157 | 0.0157 | 0.0157 | 0.0157 | 0.0157 | 0.0261 | 0.0258 |
| -1.0448 | -1.0457 | -1.0426 | -1.0459 | -1.0417 | -1.4069 | -1.3931 | |
| RET_7_12 | -0.0226** | -0.0226** | -0.0227** | -0.0226** | -0.0227** | -0.0250** | -0.0251** |
| (-2.4600) | (-2.4574) | (-2.4635) | (-2.4575) | (-2.4635) | (-2.1682) | (-2.1812) | |
| High_CG | 0.0024 | ||||||
| -0.9563 | |||||||
| CG_5 | -0.004 | ||||||
| (-0.8362) | |||||||
| CG_4 | 0.0044 | ||||||
| -1.5405 | |||||||
| CG_3 | 0.0021 | ||||||
| -0.8749 | |||||||
| Constant | -0.0554** | -0.0571** | -0.0590** | -0.0570** | -0.0565** | -0.0546** | -0.0633** |
| (-2.1836) | (-2.2416) | (-2.3172) | (-2.2360) | (-2.2130) | (-1.9624) | (-2.2048) | |
| Industry Dummy | Yes | Yes | Yes | Yes | Yes | Yes | Yes |
| Method | PCSE | PCSE | PCSE | PCSE | PCSE | PCSE | PCSE |
| Observations | 58,555 | 58,555 | 58,555 | 58,555 | 58,555 | 42,765 | 42,765 |
| R-squared | 0.0294 | 0.0294 | 0.0294 | 0.0294 | 0.0295 | 0.0308 | 0.0312 |
The results of the regression are shown in Table 2. Companies in which the CEO holds at least 10% and family members hold at least 25% of the voting rights generate a significant 0.46% monthly or 5.52% annual increase in stock returns compared to other PCSE segments. The ownership dummy of 3 groups including CEO ownership, Family ownership, both ownership and the control group of the non-specific ownership have been examined to see the results as held and shown in the columns (5) to (7). More control variable of corporate governance score (CG Score) in the columns (6) and (7) have also been added in order to confirm whether the superior stock performance is due to a high CG score. However, it is worth noting significantly higher stock returns occur in the both CEOs and family companies. The coefficient of both CEO and family ownership has been observed and it has displayed significant positive correlation. The results are interpreted as both CEO and family ownership delivers additional stock returns higher than the other groups.
However, the stock performance of CEO firms (column (1)) and family firms (column (2)) generate the insignificant additional stock returns including -0.22% and -0.15% per month, respectively. They are in contrast to the main paper of the developed countries which CEO firms deliver the significantly additional returns of 0.38% per month, and 0.52% per month in family firms (Lilienfeld-Toal & Ruenzi, 2014; Eugster & Isakov, 2019). Regarding the non- specific type of ownership, the result shows the insignificant additional stock return of 0.9% per month.
The portfolio- based approach has been applied to provide the investigation on the impact of each ownership structure on the stock abnormal returns. The premium of stock returns to holding the shares in the both CEO and family firms has been anticipated following the administration of Lilienfeld-Toal’s & Ruenzi’s of (2014); Eugster & Isakov’s (2019) method, the four-factor model of Carhart (1997), which capture the factor of market risk (Rm- Rf), Size (SMB), Book- to- market (HML), and Momentum (MOM). It shows the results of long-only each ownership structure portfolios. The portfolios are yearly rebalanced at the end of March and conducted on both the equal-weighted and value-weighted. To be more realistic, long-only portfolio is drawn since the aspect of normal investors in Thailand restricts the short- sale transaction in terms of the commission fee. as shows in Table 3.
| Table 3 Portfolio-Based Approach: Main Results |
||||||
|---|---|---|---|---|---|---|
| Value-Weighted | Equally-Weighted | |||||
| CEO | Family | Both | CEO | Family | Both | |
| (1) | (2) | (3) | (5) | (6) | (7) | |
| a | -0.002 | -0.001 | 0.001 | 0.002 | 0.001 | 0.005** |
| Rm-Rf | 1.248*** | 0.885*** | 0.812*** | 1.011*** | 0.914*** | 0.624*** |
| SMB | 0.457*** | 0.190*** | 0.497*** | 0.775*** | 0.725*** | 0.566*** |
| HML | 0.200*** | -0.051 | 0.532*** | 0.389*** | 0.280*** | 0.452*** |
| MOM | 0.021 | 0.071 | 0.085 | -0.037 | 0.034 | -0.074 |
| Adj.R2 | 0.822 | 0.667 | 0.613 | 0.848 | 0.828 | 0.595 |
| N(Period) | 192 | 192 | 192 | 192 | 192 | 192 |
In Table 3, we first focus on the column (3) and (6) where both CEO and family firms is examined. It can be found that the first row of Alpha (α) values reflects abnormal returns. The results of the equally-weighted portfolio shows that the family firms in which the CEO also hold the shares (column (6)) deliver the significantly positive abnormal returns of 0.5% per month or 6% per year. The abnormal return of this group is the highest compared to the others. The CEO ownership and family ownership (columns (4) and (5)) generate insignificant monthly abnormal returns of 0.2% and 0.1% or 2.4% and 1.2% per year, respectively. However, their abnormal returns are also less than the both CEO and family group. In order to perform robustness check for our result to prove that this is not driven by smaller firms, the analysis in value-weighted portfolios (columns (1) to (3)) has been performed. In column (3), positive abnormal returns of the both CEO and family group have been found, but it is insignificant and smaller abnormal return at 0.1% per month or 1.2% per year. The group of CEO ownership (column (1)) and family ownership (column (2)) deliver an insignificantly negative abnormal return of -0.2% and -0.1% per month or -2.4% and -1.2% per year, respectively. Non-specific type return in (column (3)) remains significantly and positively abnormal at 0.4% per month or 4.8% per year. However, the results from portfolio-based approach in CEO firms and family firms are opposed to the developed countries, which earn a monthly premium return of 0.29%- 0.40% and 0.23%-0.57%, respectively (Lilienfeld-Toal & Ruenzi, 2014; Eugster & Isakov, 2019).
Firm Performance
According to Lilienfeld-Toal & Ruenzi, (2014), the main reason why these firms offer higher stock returns is due to the positive incentive effects of the ownership structure to increase firm value. Therefore, the study aims to investigate whether these firms are also more profitable than the others. To obtain the answer, multivariate regressions have been applied to seek the profitability and valuation ratio using the method of ordinary least squares regressions with two-dimensional clustering of standard errors at time and firm dimension (PCSE). The dependent variable is the return-on-assets (ROA) in column 1 to column 7, and the natural logarithm of Tobin’s Q (logTobin’s Q) in column 8 to column 14. All regressions are controlled according to the firm size, leverage, investment intensity, sales growth, CG Score, and GICs industry classification dummies (coefficients not shown). The main independent variables are each ownership structure dummy in column 1 to column 8.
The result of abnormal return following the portfolio-based approach that the family firms in which the CEO holds the shares deliver the positive abnormal returns of 0.1% to 0.5% per month or 1.2% to 6% per year. However, the results only show the significant value in the equally-weighted portfolio excluding the value-weighted portfolio. It means that the abnormal returns of both CEO and family ownership are determined by the small-size firms. as shows in Table 4.
| Table 4 Firm Performance |
|||||||
|---|---|---|---|---|---|---|---|
| Variables | 1 | 2 | 3 | 4 | 5 | 6 | 7 |
| ROA | |||||||
| CEO Ownership | 0.0007 | 0.0056 | 0.0185*** | 0.0185*** | |||
| -0.1791 | -1.3802 | -4.8446 | -4.7775 | ||||
| Family Ownership | 0.0170*** | 0.0200*** | 0.0102*** | 0.0096*** | |||
| -4.7281 | -5.3204 | -3.304 | -2.9902 | ||||
| Both Ownership | 0.0174*** | 0.0214*** | 0.0231*** | 0.0223*** | |||
| -4.4191 | -5.4646 | -6.3266 | -6.0052 | ||||
| Non-Specific Ownership | -0.0104*** | ||||||
| (-3.2203) | |||||||
| logSize | 0.0238*** | 0.0240*** | 0.0240*** | 0.0244*** | 0.0243*** | 0.0221*** | 0.0229*** |
| -16.4636 | -16.5553 | -16.6129 | -16.1537 | -16.3201 | -15.5713 | -15.9773 | |
| Leverage | -0.1343*** | -0.1348*** | -0.1336*** | -0.1349*** | -0.1338*** | -0.1414*** | -0.1382*** |
| (-6.1702) | (-6.1661) | (-6.1452) | (-6.1453) | (-6.1496) | (-13.0174) | (-12.6942) | |
| Capex/PP&E | 0.0001*** | 0.0001*** | 0.0001*** | 0.0001*** | 0.0001*** | 0.0001*** | 0.0001*** |
| -10.1255 | -9.8672 | -10.1063 | -9.7813 | -9.7804 | -10.5421 | -9.7668 | |
| SG_1 | 0.0003 | 0.0003 | 0.0003 | 0.0003 | 0 | 0.0219*** | 0.0215*** |
| -0.6297 | -0.6699 | -0.6369 | -0.6841 | -0.6982 | -3.0873 | -3.0721 | |
| High_CG | 0.0251*** | ||||||
| -5.1229 | |||||||
| CG_5 | 0.0123* | ||||||
| -1.8214 | |||||||
| CG_4 | 0.0247*** | ||||||
| -4.6489 | |||||||
| CG_3 | 0.0281*** | ||||||
| -5.1117 | |||||||
| Constant | -0.0970*** | -0.0983*** | -0.0977*** | -0.1012*** | -0.1064*** | -0.0994*** | -0.1059*** |
| (-6.6251) | (-7.4247) | (-7.3865) | (-7.3396) | (-6.9105) | (-8.4145) | (-8.8105) | |
| Industry Dummy | Yes | Yes | Yes | Yes | Yes | Yes | Yes |
| Method | PCSE | PCSE | PCSE | PCSE | PCSE | PCSE | PCSE |
| Observations | 5,892 | 5,892 | 5,892 | 5,892 | 5,892 | 4,351 | 4,351 |
| R-squared | 0.1553 | 0.1577 | 0.1568 | 0.1573 | 0.1599 | 0.2424 | 0.2442 |
| -8 | -9 | -10 | -11 | -12 | -13 | -14 | |
| logTobin's Q | |||||||
| CEO Ownership | 0.0739*** | 0.1082*** | 0.1435*** | 0.1434*** | |||
| -4.6059 | -6.6786 | -7.3551 | -7.366 | ||||
| Family Ownership | 0.1046*** | 0.1415*** | 0.1199*** | 0.1152*** | |||
| -7.1481 | -9.3264 | -7.5138 | -7.2214 | ||||
| Both Ownership | 0.1019*** | 0.1444*** | 0.1549*** | 0.1507*** | |||
| -5.5662 | -7.512 | -5.9667 | -5.8082 | ||||
| Non-Specific Ownership | -0.1048*** | ||||||
| (-7.1461) | |||||||
| logSize | 0.1848*** | 0.1856*** | 0.1851*** | 0.1899*** | 0.1883*** | 0.1961*** | 0.2014*** |
| -16.4227 | -16.452 | -16.239 | -17.2964 | -17.1562 | -42.743 | -42.4255 | |
| Leverage | -0.4987*** | -0.5038*** | -0.4968*** | -0.5068*** | -0.4956*** | -0.6896*** | -0.6685*** |
| (-6.9543) | (-6.9893) | (-6.9574) | (-6.9386) | (-6.9122) | (-12.5637) | (-12.1645) | |
| Capex/PP&E | 0.0010*** | 0.0010*** | 0.0010*** | 0.0010*** | 0.0010*** | 0.0009*** | 0.0009*** |
| -10.2831 | -10.0764 | -10.1295 | -10.2846 | -10.1108 | -10.1674 | -9.5096 | |
| SG_1 | 0.0002 | 0.0003 | 0.0002 | 0.0004 | 0 | 0.0088 | 0.0056 |
| -0.1249 | -0.1476 | -0.112 | -0.1959 | -0.2043 | -0.5098 | -0.3268 | |
| High_CG | -0.0501*** | ||||||
| (-3.6990) | |||||||
| CG_5 | -0.1421*** | ||||||
| (-6.1396) | |||||||
| CG_4 | -0.0410** | ||||||
| (-2.5124) | |||||||
| CG_3 | -0.0383** | ||||||
| (-2.4390) | |||||||
| Constant | -0.0243 | 0.0421 | 0.0467 | 0.0053 | -0.0892 | -0.1714 | -0.2119 |
| (-0.2507) | -0.4331 | -0.4753 | -0.0557 | (-0.9360) | (-0.6143) | (-0.7610) | |
| Industry Dummy | Yes | Yes | Yes | Yes | Yes | Yes | Yes |
| Method | PCSE | PCSE | PCSE | PCSE | PCSE | PCSE | PCSE |
| Observations | 5,892 | 5,892 | 5,892 | 5,892 | 5,892 | 4,351 | 4,351 |
| R-squared | 0.4225 | 0.4236 | 0.4218 | 0.4284 | 0.4324 | 0.4676 | 0.4676 |
The results in column (3) and column (5-7) show the coefficient of the both CEO and family ownership dummy which bare the highest value. It can be said that these firms are significantly more profitable (ROA) than others. As for the interpretation on the ownership structure owned by both CEO and family, this type of a firm ownership reveals high incentives that help maximize the firm value. Measured by Tobin’s Q, the firm valuation result is displayed in column (8) to column (14). It is observed that both CEO and family ownership is positively related to the firm valuation (column (10) and column (12-14)) which means that most investors have strong confidence towards the family firms in which CEOs hold the shares. It has also been observed that the family firms have a significantly positive ROA (column (2)), meaning that the family firms also perform well in the profitability. Moreover, the family firms (column (9)) and the CEO ownership firms (column (8)) also receive strong confidence. However, the coefficient dummies of family firms and CEO ownership firms in both firm and valuation performance are still less than the both CEO and family ownership
group.
Concluding Remarks
This research paper provides the evidence that the firms in which the CEO holds a large number of shares in in family companies and yield higher deliver the higher stock returns. the publicly information of the dataset of 721 companies listed in the Stock Exchange of Thailand (SET) from January 2002 to December 2018, covering a seventeen-year period have been examined. The total sample is equal to 58,555 firm-month observations. The paper links the ownership structure and stock returns which have gained little attention in Thailand and have filled the gap of the agency problems as well the offer on the context between developed and emerging countries which are considered to be different perspectives compared to other studies.
Thai listed companies have also experienced the agency problems; however, the family firms or CEO ownership firms have the ability to ease only the Type I agency problem, not type II. Even if these firms have an incentive to increase firm performance, the investors are still concerned about the expropriation of the private benefits from controlling shareholders. This results in their underperforming stock returns. However, the CEO shares’ holding and family members in a firm can still be able to reduce both Type I and Type II agency problems. In terms of Type I, the CEO will have an incentive to maximize firm value, while the family members will monitor their manager to increase their wealth. At the same time, the ownership structure will be shifted to have more than two shareholder groups as CEO, family ownership, and minority ownership, which will counterbalance each other and protect the expropriation of private interests. Type II agency issues are resolved, and outside investors are more confident to invest in these companies. As a result, both the CEO and family ownership will generate higher stock returns compared to the others.
References
- Al-Khouri, R. (2011). Assessing the risk and performance of the GCC banking sector. International Research Journal of Finance and Economics, 65(1), 72-81.
- Anderson, R.C., & Reeb, D.M. (2003). Founding?family ownership and firm performance: Evidence from the S&P 500. The journal of finance, 58(3), 1301-1328.
- Bae, K.H., Kang, J.K., & Kim, J.M. (2002). Tunneling or value added? Evidence from mergers by Korean business groups. The journal of finance, 57(6), 2695-2740.
- Bloom, N., & Van Reenen, J. (2007). Measuring and explaining management practices across firms and countries. The quarterly journal of Economics, 122(4), 1351-1408.
- Burkart, M., Panunzi, F., & Shleifer, A. (2003), Family Firms. The Journal of Finance, 58, 2167-2201.
- Chen, M.J. (2001). Inside Chinese business. Boston, MA: Harvard Business School Press.
- Chung, C.N., & Luo, X.R. (2013). Leadership succession and firm performance in an emerging economy: Successor origin, relational embeddedness, and legitimacy. Strategic Management Journal, 34(3), 338-357.
- Daily, C.M., & Dollinger. (1992). An empirical examination of ownership structure in family and professionally managed firms. Family Business Review, 5, 117-136.
- Dharwadkar, R., George, G., & Brandes, P. (2000). ‘Privatization in emerging economies: An agency theory perspective’. Academy of Management Review, 25, 650–69.
- Eugster, N., & Isakov, D. (2019). Founding family ownership, stock market returns, and agency problems. Journal of Banking & Finance, 107, 105600.
- Eun, C.S., & Resnick, B.G. (2008). International financial management. Boston: McGraw- Hill/Irwin.
- Faccio, M., Lang, L.H.P., & Young. (2001). 'Dividends and expropriation', American Economic Review Papers. 91, 54-78.
- Katah, B. (2009). The impact on conflict between controlling and minority shareholders. The Case of Kakuzi Limited, University of Nairobi School of Business.
- La Porta, R., Lopez-de-Silanes, F., & Shleifer, A. (1999). ‘Corporate ownership around the world’. Journalof Finance, 54, 471–517.
- Lins, K. (2003). Equity ownership and firm value in emerging markets. The Journal of Financial and Quantitative Analysis, 38(1), 159-184.
- Lilienfeld-Toal, U.V., & Ruenzi, S. (2014). CEO ownership, stock market performance, and managerial discretion. The Journal of Finance, 69(3), 1013-1050.
- Carhart, M.M. (1997). On persistence in mutual fund performance. The Journal of finance, 52(1), 57-82.
- Jensen, M.C., & Murphy, K.J. (1990). Performance pay and top-management incentives. Journal of political economy, 98(2), 225-264.
- Jensen, M.C., & Meckling, W.H. (1976). Managerial behavior, agency costs and ownership structure. Journal of financial economics, 3(4), 305-360.
- Sarkar, J. (2010). Ownership and corporate governance in Indian firms. Corporate governance: An emerging scenario, National Stock Exchange of India Ltd, 217-267.Sener, P. (2014). Influence of family ownership and management on firm performance: evidence from public firms in Turkey. Revue del Entrepreneuriat, 13(3), 143-169.
- Shleifer, A., & Vishny, R.W. (1986). Large shareholders and corporate control. Journal of political economy, 94(3, Part 1), 461-488.
- Stein, J.C. (1988). “Takeover Threats and Managerial Myopia.” Journal of Political Economy, 96(1), 61-80.
- Sitthipongpanich, T. (2017). Family ownership and free cash flow. International Journal of Managerial Finance, 13(2).
- Sitthipongpanich, T., & Polsiri, P. (2015). Do CEO and board characteristics matter? A study of Thai family firms. Journal of Family Business Strategy, 6(2), 119-129.
- Villalonga, B., & Amit, R. (2009). How are US family firms controlled?. The Review of Financial Studies, 22(8), 3047-3091.