Research Article: 2021 Vol: 27 Issue: 6
Characteristic Entrepreneurship Poor and Non-Poor Paddy Farmers in Indonesia Respond to An Increase in the Price of Rice
Yogi Makbul, Institut Teknologi Bandung
Nandan Limakrisna, Universitas Persada Nusantara YAI
Sudrajati Ratnaningtyas, Institut Teknologi Bandung
Citation: Makbul, Y., Limakrisna, N., & Ratnaningtyas, S. (2021). Characteristic entrepreneurship poor and non-poor paddy farmers in Indonesia respond to an increase in the price of rice. Academy of Entrepreneurship Journal, 27(6), 1-8.
Abstract
This research aimed to determine why poor and non-poor paddy farmers respond differently to an increase in the price of rice. A policy about an increase in the price of rice is important to maintain food security in Indonesia. When the price of paddy increases, paddy farmers are motivated to increase their production. Increasing paddy production ensures food security. An increase in the price of paddy can be influenced by an increase in the price of rice. However, an increase in the price of rice can affect poor families, including paddy farmers. Poor and non-poor paddy farmers respond differently to an increase in the price of rice. This study surveys poor and non-poor paddy farmers in the Gantar district, Indramayu Regency, Indonesia. Simple random sampling was employed to select the respondents. The study finds that the response of non-poor paddy farmers to an increase in the price of rice is better as they have a higher motivation and higher entrepreneurship to engage in farming. The limitation of this research is that it only explores the characteristics of farmers quantitatively. A future study that conducts a detailed qualitative analysis is needed to improve this research.
Keywords
Poor farmers, Non-Poor Farmers, Price of Rice, Price of Paddy.
Introduction
Rice is the most important staple food in Indonesia, so it plays a strategic role in food security there. Thus, an important government policy is implemented to ensure the availability of rice, thereby ensuring food security. The availability of rice is based on three pillars: (1) availability, (2) affordability, and (3) stability (Bulog, 2020). The availability and stability pillars are supported by paddy production programs.
Besides paddy production, the availability and stability pillars can be achieved by importing rice, but this is not recommended as the international rice market is unstable. In 2008, there was a shock in the price of rice on the international market (Seck et al., 2010). The increase in the price of rice was due to a decrease in supply. This incident is dangerous for countries that are dependent on rice imports.
An increase in paddy production can be achieved if paddy farming is profitable. The profit of paddy farming can increase if the price of paddy increases.
One of the factors influencing the price of paddy is the price of rice (Makbul & Ratnaningtyas, 2017). An increase in the price of paddy is important for paddy farmers as it can motivate farmers to increase paddy production. An increase in the price of paddy can stimulate paddy production (Bingxin & Fang, 2011).
A high rice price policy can increase paddy production, but such a policy can have a negative effect on rice consumers and can increase poverty (Warr & Yusuf, 2014), thereby increasing the poverty of paddy farmers as well (McCulloch, 2008). Therefore, a rice price policy must consider poor paddy farmers. A question that arises is “what are the characteristics of poor paddy farmers?” The answer to this question is important to ensure an effective rice policy. The question can be answered by conducting research that compares poor and non-poor paddy farmers and shows how an increase in the price of rice benefits poor paddy farmers.
Makbul (Makbul et al., 2021) concluded that an increase in the price of rice can benefit poor farmers, depending on whether the rice market is efficient. If the price transmission from rice to paddy is above 60%, an increase in the price of rice can increase the income of poor families. However, for non-poor farmers, the price of rice can benefit them if the price transmission is above 20%. This indicates that non-poor farmers benefit more if the price of rice increases. These facts raise the following questions: “Why is the impact on poor and non-poor farmers different?” and “What is the difference between the characteristics of poor and non-poor farmers?” These questions can be answered by conducting a study that compares the difference in the impact of an increase in the price of rice on poor and non-poor farmers. This research conducts this analysis.”
Literature Review
Saka et al. (Saka & Lawal, 2009) analyzed the adoption and productivity of paddy farmers in Nigeria. They demonstrated that, from a sociocultural perspective, the factors that influence the adoption and productivity of paddy farmers are (1) gender, (2) education, (3) activities in farmer groups, (4) access to alternative income, (5) age, (6) experience in farming, (7) land area, and (8) frequency of attending counseling. They found that education, activity in farmer groups, access to alternative income, land area, and frequency of attending counseling significantly influence adoption and productivity. (Basorun & Fasakin, 2012) conducted research on food security in Nigeria. They profiled rice farmers based on (1) gender, (2) regional origin, (3) age, (4) motivation, (5) income, (6) land area, (7) use of labor, (8) business costs of farmers, and (9) problems in agriculture. They concluded that motivation is the most important factor affecting farm profit. (Sahara et al., 2011) conducted research on farmers in Indonesia. In the research, the following variables, which are based on the characteristics of rice farmers, were used for the analysis: (1) rice production, (2) non-rice (vegetable) agricultural production, (3) vegetable prices, (4) total profit, (5) number of workers, (6) labor wages, (7) land area, (8), amount of fertilizer, (9) total household income of farmers, (10) per capita income, (11) family members, (12) educational level of the head of the household, (13) total time spent working on agriculture, (14) amount of free time, (15) food consumption pattern, (16) total food consumption, (17) non-food consumption, (18) amount of food purchased, (19) non-food expenditure, (20) total household expenditure, and (21) participation in farmer groups. The research found that the price of the product is important in increasing production and profit. (Fakkhong & Suwanmaneepong, 2015) analyzed the characteristics of rice farmers in Thailand. The farmers were characterized based on the following socioeconomic factors: (1) gender, (2) age, (3) education, (4) marital status, (5) social status, (6) number of family members, (7) number of farm workers, (8) farming experience, (9) land area, and (10) rice varieties. The research found that education, number of family members, farm workers, and land size significantly influence rice production. Alam (Alam et al., 2011) conducted research on the relationship between social economics and the productivity of poor rice farmers. The analysis was based on the following characteristics of poor paddy farmers: the race of farmers, gender, age, secondary occupation, education, family size, ownership of land, non-agricultural to agricultural income ratio, number of available vehicles, distance between home and field, farm size, mixed ownership land, own land, number of available machineries, location of farmland, and known current issues. They found that the education of farmers has a significant impact on agricultural output and productivity. Another variable that has a positive impact on the productivity of farm output is machinery.
Methodology
Research Methods and Locations
In this research, a survey of rice farmers in the Gantar district, Indramayu Regency, was conducted. The Gantar district was chosen as it is the largest rice producer in Indramayu Regency (BPS Indramayu, 2020a), and Indramayu Regency is the largest rice producer in West Java, Indonesia (BPS Jabar, 2020). The high rice production for that location probability the community that region is rice farmer.
Simple random sampling was employed to select the respondents. The equation in the study by Bartlett (Bartlett et al., 2001) was used to determine the sample size.
 (1)
(1)
n = size of sample
t = t table at α=0.05
S = standard deviation
d = deviation tolerance
Based on preliminary research, the standard deviation of land size in locations is 0.83, with a deviation tolerance of 0.1. The t table of α = 0.05 is 1.96. The sample size of this research is calculated as follows:
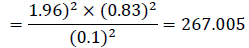
Thus, the sample size is 268 respondents.
In this study, the variables of the characteristics of rice farmers are from the existing literature. The research variables are presented in Table 1.
Table 1 shows the research variables. Each variable is then analyzed based on the scale measure. The X2 test was employed for the nominal scale analysis, the Mann–Whitney U test to measure the ordinal scale, and the t-test to measure the ratio scale.
| Table 1 Research Variables |
|||
| Variable | Name | Measure | Unit |
|---|---|---|---|
| X1 | Group | Nominal | 0=non-poor 1=Poor |
| X2 | Age | Ratio | Year |
| X3 | Education | Ordinal | 1=Basic school 2=Middle school 3=High school |
| X4 | Sex | Nominal | 1=Male 2=Female |
| X5 | Activity in Farmer Groups | Ordinal | 1= Very low 2=Low 3=Middle 4=High 5=Very high |
| X6 | Farming Experience | Ratio | Year |
| X7 | Main Job | Nominal | 1=Agriculture 2=non-agriculture |
| X8 | Number of Family Members | Ratio | Person |
| X9 | Native Farmer | Nominal | 0=Non-native 1=Native |
| X10 | Farm Motivation | Ordinal | 1=Very low 2=Low 3=Middle 4=High 5=Very high |
| X11 | Farm Employees | Ratio | Person/Season |
| X12 | Working Time | Ratio | Day/Season |
| X13 | Labor Wages | Ratio | IDR/Day |
| X14 | Family Income Perception | Ratio | IDR/Month |
| X15 | Percentage of Income from Farming | Ratio | Percentage |
| X16 | Farmland | Ratio | Ha |
| X17 | Land System | Nominal | 1=Arable 2=Own 3=Rent 4=Own & Arable 5=Own & Rent 6=Rent & Arable 7=Rent & Own |
| X18 | Farm Pattern | Nominal | 1=Paddy-paddy-abandoned 2=Paddy-paddy-soybean 3=paddy-paddy-vegetable |
| X19 | Household Rice Consumption | Ratio | Kg/Month |
| X20 | Household Rice Expenditure | Ratio | IDR/Month |
| X21 | Household Food Expenditure | Ratio | IDR/Month |
| X22 | Household Non-Food Expenditure | Ratio | IDR/Month |
| X23 | Farm Cost | Ratio | IDR/Season |
| X24 | Farm Production | Ratio | Kg/Season |
| X25 | Farm Production Sold | Ratio | Kg/Season |
| X26 | Price of Farm Production | Ratio | IDR/Kg |
| X27 | Farm Revenue | Ratio | IDR/Season |
| X28 | Farm Profit | Ratio | IDR/Season |
| X29 | Farm Income | Ratio | IDR/Season |
| X30 | Non-farm Income | Ratio | IDR/Month |
Results
The results are presented in Table 2.
| Table 2 The Results |
|||||
| Variable | Name | Measure | Statistic Test | Significant Result | |
|---|---|---|---|---|---|
| X1 | Group | Nominal | X Square | 0 | ** |
| X2 | Age | Ratio | t-test | 0.5420 | |
| X3 | Education | Ordinal | Mann–Whitney U | 0.7270 | |
| X4 | Sex | Nominal | X Square | 0.2970 | |
| X5 | Activity in Farmer Groups | Ordinal | Mann–Whitney U | 0.9930 | |
| X6 | Farming Experience | Ratio | t-test | 0.0570 | |
| X7 | Main Job | Nominal | X Square | 1.0000 | |
| X8 | Number of Family Members | Ratio | t-test | 0.8080 | |
| X9 | Native Farmer | Nominal | X Square | 0.0000 | ** |
| X10 | Farm Motivation | Ordinal | Mann–Whitney U | 0.0950 | |
| X11 | Farm Employees | Ratio | t-test | 0.0000 | ** |
| X12 | Working Time | Ratio | t-test | 0.0000 | ** |
| X13 | Labor Wages | Ratio | t-test | 0.2920 | |
| X14 | Family Income Perception | Ratio | t-test | 0.0220 | * |
| X15 | Percentage Income of from Farming | Ratio | t-test | 0.4660 | |
| X16 | Farm Land | Ratio | t-test | 0.0010 | ** |
| X17 | Land System | Nominal | X Square | 0.1160 | |
| X18 | Farm Pattern | Nominal | X Square | 0.7290 | |
| X19 | Household Rice Consumption | Ratio | t-test | 0.0000 | ** |
| X20 | Household Rice Expenditure | Ratio | t-test | 0.0020 | ** |
| X21 | Household Food Expenditure | Ratio | t-test | 0.0000 | ** |
| X22 | Household Non-Food Expenditure | Ratio | t-test | 0.0000 | ** |
| X23 | Farm Cost | Ratio | t-test | 0.0200 | * |
| X24 | Farm Production | Ratio | t-test | 0.0000 | ** |
| X25 | Farm Production Sold | Ratio | t-test | 0.0000 | ** |
| X26 | Price of Farm Production | Ratio | t-test | 0.0000 | ** |
| X27 | Farm Revenue | Ratio | t-test | 0.0000 | ** |
| X28 | Farm Profit | Ratio | t-test | 0.0000 | ** |
| X29 | Farm Income | Ratio | t-test | 0.0000 | ** |
| X30 | Non-farm Income | Ratio | t-test | 0.0410 | * |
(*) Significant (**) Highly Significant
The variables that are significant in this research are group, native farmer, farm employees, working time, family income perception, land farm, household rice consumption, household rice expenditure, household food expenditure, household non-food expenditure, farm cost, farm production, farm production sold, price of farm production, farm revenue, farm profit, farm income, and non-farm income.
There are significant differences among the groups. Poor paddy farmers are 16% of the total paddy farmers in this research, indicating that the number of poor paddy farmers is not high. In this research, the criterion for determining the poor is based on the Statistics Indonesia (BPS) for the Indramayu Regency. According to BPS (BPS Indramayu, 2020b), the criterion of the poor is an income of 447.378 IDR/year. It is good news for the Indonesian government that most paddy farmers are not poor.
The difference between native and non-native paddy farmers is significant. We found that 69% of poor paddy farmers are natives, implying that most poor farmers are natives. This finding can be a subject of future research “why are native farmers poorer than non-native farmers?” The reason may be that non-native farmers work harder than native farmers, but this opinion must be verified by another research.
The number of farm employees and the working time of the poor and non-poor paddy farmers are significantly different. The number of employees and the working time of non-poor paddy farmers are twice those of poor paddy farmers. Thus, non-poor paddy farmers work harder than poor paddy farmers, suggesting that the hard work of non-poor farmers is the reason why they are not poor.
Family income perception is significantly different among poor and non-poor paddy farmers. The mean incomes of poor and non-paddy farmers are 1.526.295,45 and 2.023.080,36 IDR/month, respectively, indicating that the mean income of non-poor farmers is 25% higher than that of poor farmers. This research used perceived income as it is difficult to know the actual income. Poor paddy farmers do not keep accounting records.
The farmlands of poor and non-poor paddy farmers are also significantly different. The mean land size of poor paddy farmers is 0.74 ha, whereas that of non-poor paddy farmers is 1.26 ha. Farmland is the ultimate factor for the success of the farm, which is not surprising.
Rice consumption and expenditure of households of poor farmers are higher than those of households of non-poor farmers, but regarding food and non-food expenditures, those of non-poor farmers are higher than those of poor farmers. This is because poor paddy farmers are more concerned about basic needs.
The farm cost, production, revenue, and profit of non-poor farmers are higher than those of poor farmers. This is logical as non-poor farmers have more land farms than poor farmers. However, interestingly, this research found that the prices of paddy from their farms are different; the price of non-poor farmers is higher than that of poor farmers, although the product has the same quality. This may be that the marketing skills and entrepreneurship of non-poor farmers are better than those of poor farmers. However, research is needed to confirm this assertion.
The non-farm income of non-poor farmers is better than that of poor farmers. This may be that non-poor farmers have better business skills than poor farmers. The non-poor farmers are not only better in their entrepreneurship farming business but also in non-farming business.
Discussion
In the Introduction section, we found that an increase in the price of rice has a different impact on poor and non-poor paddy farmers. This research aimed to determine whether the impact of an increase in the price of rice on poor and non-poor farmers is different and to identify the characteristics of poor and non-poor farmers. This research explores many characteristics of poor and non-poor paddy farmers.
The result of this research demonstrates that the following characteristics of poor and non-poor paddy farmers are significantly different: native farmer, farm employees, working time, family income perception, farmland, household rice consumption, household rice expenditure, household food expenditure, household non-food expenditure, farm cost, farm production, farm production sold, price of farm production, farm revenue, farm profit, farm income, and non-farm income.
The percentage of non-native farmers that are non-poor is more than that of poor farmers; this may be due to the economic hardship in the region. Because non-native farmers struggle to survive, they are encouraged to engage in farming. This attitude has probably a different impact on the increase in the price of rice. The price of paddy products of non-poor farmers is higher than that of poor farmers.
Other relevant characteristics that are significantly different among poor and non-poor paddy farmers are farm employees, working time, family income perception, farmland, farm production, price, and profit. Non-poor farmers have better results than poor farmers. This may be because non-poor farmers are concerned about both their farm and non-farm businesses.
There are similarities and differences between the current and previous research (Alam et al., 2011; Basorun & Fasakin, 2012; Fakkhong & Suwanmaneepong, 2015; Sahara et al., 2011; Saka & Lawal, 2009). (Alam et al., 2011) found that the educational level of farmers has a significant impact on agriculture and productivity, but this research finds that the impact of the education of poor and non-poor farmers is not significantly different. This is probably because, in this research, the educational levels of farmers are nearly homogeneous. The general educational level of farmers in the research location is basic, which is probably insignificant. If research is conducted in another location where farmers have various educational levels, the difference may be significant. (Basorun & Fasakin, 2012) found that motivation and farm profit are important to farm productivity. However, in this research, motivation is nearly significant (α = 0.09). If the criterion for significance was α<0.1, this characteristic would have been significant, but unfortunately, the criterion is α < 0.05. The findings about profit in this research are similar to those of the study by Basorun and Fasakin. This research found a significant difference between the profit of poor and non-poor farmers.
(Fakkhong & Suwanmaneepong, 2015) found that educational level, number of family members, farm employees, and land size are significant. With regard to farm employees and land size, the findings of this research are similar to those of the study by Fakhong; both found that they are significant. However, the farm employees and land size of non-poor farmers are higher than those of poor farmers. (Sahara et al., 2011) found that price is important to an increase in paddy production, which is similar to the finding of this research. The price of paddy of non-poor farmers is higher than that of poor farmers, indicating a significant difference.
(Saka & Lawal, 2009) found that education, activity in farmer groups, access to alternative income, land area, and frequency of attending counseling have a significant influence on adoption and productivity. The similarity between the study by Saka and Lawal and this research is that access to alternative income and land area is significant. The non-farm income and land size of non-poor farmers are significantly different from those of poor farmers.
The limitation of this research is that it only explores the characteristics of poor and non-poor farmers quantitatively. The research does not conduct a deep qualitative analysis of the characteristics. A future study can complement this research.
Conclusion
Non-poor farmers have more opportunities when the price of rice increases; it also increases their farm profit because they have entrepreneurship capability, and they are concerned about their farm business. For example, they have more farm working time and a greater number of employees. Moreover, in marketing their product, non-poor farmers set a higher price than poor farmers, although their paddy products are of the same quality. The limitation of this research is that it conducts only a quantitative analysis of the characteristics of poor and non-poor farmers. Future research can conduct a detailed qualitative analysis of the characteristics of both poor and non-poor farmers.
References
- Alam, M., Siwar, C., Talib, B., &amli; Toriman, M. E. (2011). The relationshilis between the socio-economic lirofile of farmers and liaddy liroductivity in North-West Selangor, Malaysia. Asia-liacific Develoliment Journal, 18, 161–173.
- Bartlett, J.E., Kotrilk, J.W., &amli; Higgins, C. (2001). Organizational Research: Determining Aliliroliriate Samlile Size in Survey Research. Information Technology, Learning, and lierformance Journal, 19(1), 43–50.
- Basorun, J.O., &amli; Fasakin, J.O. (2012). Food security in Nigeria: A develoliment framework for strengthening igbemo-ekiti as a regional agroliole. International Journal of Sustainable Develoliment and lilanning, 7(4), 495–510.
- Bingxin, Y.S., &amli; Fang. (2011). Rice liroduction reslionse in Cambodia. Agricultural Economics, 42(3), 437–450.
- BliS Indramayu. (2020a). Luas lianen, liroduktivitas, dan Jumlah liroduksi liadi 2017. BliS. httlis://indramayukab.blis.go.id/indicator/53/54/1/luas-lianen-liroduktivitas-dan-jumlah-liroduksi-liadi.html
- BliS Indramayu. (2020b). lioverty Lines of Kabuliaten Indramayu.
- BliS Jabar. (2020). liaddy Rice liroduction by Regency/City in West Java (Tonnes), 2010–2015 [liaddy Rice liroduction by Regency/City in West Java (Tons), 2010–2015].
- Bulog. (2020). Ketahanan liangan [Food Security].
- Fakkhong, S., &amli; Suwanmaneeliong, S. (2015). Socio-Economic Factors Influencing Rice liroduction in lieri-Urban Area. Journal of Agricultural Technology, 11(8), 2053–2062. httli://www.ijat-aatsea.com/lidf/v11_n8_15_DecemberSliecialissue/044 - Sasima Fakkhong -S3.lidf
- Makbul, Y., &amli; Ratnaningtyas, S. (2017). Analysis of the integration of rice and liaddy lirices in Indonesia using a vector error correction model. International Journal of Alililied Business and Economic Research, 15(10).
- Makbul, Yogi, Limakrisna, N., Ratnaningtyas, S., &amli; Cokrowitianto, A. (2021). Do lioor liaddy Farmers Benefit from Increasing Rice lirices? International Journal of Sulilily Chain Management, 10(2), 116–120. httli://ojs.excelingtech.co.uk/index.lihli/IJSCM/article/view/5866/3019
- McCulloch, N. (2008). Rice lirices and lioverty in Indonesia. Bulletin of Indonesian Economic Studies, 44(1), 45–64. httlis://doi.org/10.1080/00074910802001579
- Sahara, D., Harianto, Kusnadi, N., &amli; Kuntjoro. (2011). The liroduction and consumlition behavior of rice farm households in Southeast Sulawesi [IliB (Bogor Agricultural University)]. httlis://reliository.ilib.ac.id/handle/123456789/52700?show=full
- Saka, J. O., &amli; Lawal, B. O. (2009). Determinants of adolition and liroductivity of imliroved rice varieties in southwestern Nigeria. African Journal of Biotechnology, 8(19), 4923–4932. httlis://doi.org/10.4314/ajb.v8i19.65188
- Seck, li. A., Tollens, E., Woliereis, M. C. S., Diagne, A., &amli; Bamba, I. (2010). Rising trends and variability of rice lirices: Threats and oliliortunities for sub-Saharan Africa. Food liolicy, 35(5), 403–411.
- Warr, li., &amli; Yusuf, A. A. (2014). World food lirices and lioverty in Indonesia. Australian Journal of Agricultural and Resource Economics, 58(1), 1–21.