Research Article: 2017 Vol: 20 Issue: 2
Corporate Venture Capital Strategy for Selecting Start-Up Investments in Indonesia using an Agent-Based Model: Cases of a Mobile Application Start-Up, Payment Solution Start-Up and Digital Advertising Start-Up
G.N. Sandhy Widyasthana, MDI Ventures
Dermawan Wibisono, Bandung Institute of Technology & Pertamina University
Mustika Sufiati Purwanegara, Bandung Institute of Technology
Manahan Siallagan, Bandung Institute of Technology
Pratiwi Sukmawati, Telkom University
Abstract
Digital-related businesses are growing significantly globally, and an average increase of 20% from 2014 to 2020 is expected. These businesses are dominated by rising start-ups based in Silicon Valley. The financing model implemented by many of these start-ups is the venture capital (VC) model. In addition to providing funding, VC offers mentorship and networking with investors and other market opportunities that can help start-ups grow into successful companies. Venture capitalists should practice caution when deciding to invest in a start-up. They must find a good start-up to reap the benefits of start-up valuation growth. Venture capitalists have long used subjective methods to make investments, and these methods involve high risk. To better predict start-up valuation and minimize risk, investors must understand the key parameters, i.e., the management team, the nature of the product, intellectual capital, geographic location and coherence, and they should track the changes in these parameters based on the start-up activity. Start-up activity is defined as the interactions within the ecosystem with stakeholders, such as venture capitalists, government agencies/bodies, other start-ups and customers, to improve business performance, networks and product capabilities, which may be factors in venture capitalists’ investment decision making.
This study attempts to model start-up interactions with other stakeholders within the start-up ecosystem and measure the effects of those interactions on start-up performance over a certain period of time. The agent-based model of start-up interaction simulates start-up improvement progress using three scenarios. The purpose of the model and the simulation is to aid investors in predicting future start-up performance based on stakeholder interaction effectiveness.
The results of the simulation demonstrate that start-up performance progress is determined by the effectiveness of interactions between stakeholders. The more effective the interaction, the better the start-up performance. The simulation results can also be used as a template for the interaction of start-ups with their stakeholders to achieve strong performance that provides value for investors.
Keywords
Start-Up, Agent-Based Model, Venture Capital.
Introduction
Telecommunications businesses, a global phenomenon in terms of revenue and subscriber growth in the early 2000s, now represent a saturated market. Customers of traditional telecommunications services based on fixed and mobile phones are starting to shift to digital-related businesses. Digital-related businesses are growing significantly globally and are expected to increase 20% on average from 2014 to 2020 (Kearney, 2015). Consumer digital products are the segment expected to have the greatest growth. Consumer digital product portfolios can be differentiated into software and applications based on the Internet or cloud networks for TV and video (e.g., YouTube, Google Play), music (e.g., Evernote, Salesforce.com), collaboration (e.g., Dropbox, Rackspace) and social media (e.g., Facebook, Twitter). The top consumer digital products were mainly developed by rising start-ups, predominantly those based in Silicon Valley. Start-up companies are newly founded companies or entrepreneurial ventures that are in the early phase of product development and market research. They are usually, but not necessarily, associated with high-tech projects because their products are mostly applications that can be easily produced and reproduced (Calopa et al., 2014). Start-ups usually employ fewer than five full-time employees and have limited innovation activity (Arvanitis et al., 2013).
In general, there are four stages in the start-up life cycle: seed, early stage, later stage and exit. A start-up must complete these stages to be successful. Each stage has different characteristics. The seed stage is the process of strengthening a business idea into an executable business. In the early stage, a start-up should define a detailed plan for product execution because the start-up is still experimenting with the market. The later stage arrives when it is clear that there is an established revenue and/or customer base, and the business is scaled in the exit stage. (Salamzadeh et al., 2017) define eight stages of a start-up from the new venture-creation point of view: (i) ideation and opportunity (venture idea) recognition, (ii) shaping the entrepreneurial intention, (iii) preparation, (iv) networking, (v) entry, (vi) value creation, (vii) exit and (viii) organization. Another holistic perspective divides the start-up life cycle into three stages: the bootstrapping stage, seed stage and creation stage (Salamzadeh et al., 2015).
To expand and develop its business, a start-up must have access to a financing source. In the very early stage, the common financing source for start-up companies is angel investors, and it is a start-up founder’s job to persuade angel investors to invest their funds in the business. Start-ups adopting the venture capital (VC) model develop their products using financing from third parties. The VC model is becoming a trend for helping start-ups grow because in addition to providing funding, VC offers mentorship and investor networking to help start-ups succeed. VC provides fundraising for investing in new start-ups worldwide. Large corporations also participate in investing in start-ups through subsidiary companies called corporate venture capital (CVC) companies, which act as a vehicle for managing funds from the parent company. Since 2014, CVC firms have become major lead investors in many venture transactions and have a large share of the venture pie. In the future, CVC firms will continue to play a critical role in shaping start-up businesses worldwide. In Asia as a whole, corporate participation in venture deals reached an all-time high of US$28bn in 2016, representing 19% of the total deal count (KPMG, 2017).
The number of venture capitalists operating in Indonesia is growing, with different portfolios and different ranges of funding available. Venture capitalists operating in Indonesia can be grouped by background, such as source of funds (private, public, corporate or conglomerate) or area of operation (local or regional company) (Widyasthana et al., 2017). (Widyasthana et al., 2017) explain that conglomerate/family-backed venture capitalists usually have funding from internal sources and focus on investing in local start-ups that have products that can support and enrich their core businesses. Foreign/regional venture capitalists obtain funding from fundraising processes and invest in local and international start-ups that can operate regionally or locally in Indonesia. Local/joint-venture venture capitalists also have funding from fundraising processes and focus on investing in local start-ups that target global or local markets. Finally, CVC firms have funding from their internal parent companies and invest in local and international start-ups that have products with high synergy value with their company business portfolio.
CVC firms mainly invest in start-ups at a mature stage, that is, with start-up valuations between the pre-series A and pre-IPO stages with a ticket size of approximately 1 million USD per start-up. Start-ups at the mature stage earn high valuation because their products are well defined, and CVC firms can recognize the potential synergy from the product with their company or other subsidiary companies in their groups. The venture investment made by the CVC firm will provide returns approximately five to seven years after the investment is made if the start-up operations are working well. This is a high-risk condition for CVC firms as they can lose their investment if they do not choose the right start-up to invest in, which may affect the company’s ability to survive in the future. Currently, there is no specific guidance available for CVC firms investing in start-ups in Indonesia. Consequently, investments made in Indonesia are based on the subjective assessments of each analyst at the CVC firm. The more experienced the analyst, the more accurate the analysis of the targeted start-up, but the success of the investment by the CVC firm in a start-up cannot be guaranteed. CVC firms in Indonesia need investment guidance, especially for start-up ventures, to minimize risk and potential future loss that could endanger the company.
The success of a start-up depends on its ability to survive in the business ecosystem. To understand this phenomenon, we develop a model that focuses on start-up interactions with other stakeholders within the start-up ecosystem and measures the effects of those interactions on start-up performance during a certain period of time. This study also illustrates a model for start-up interaction and simulation using an agent-based model to trace a start-up’s improvement during a simulation using three types of scenarios. The interaction and activities model is based on a real situation of start-up companies in Indonesia, and real data are used to generate the simulation process. The results from the simulation can be used as a template for how start-ups should interact with their stakeholders and can be used by CVC firms when implementing their investment strategy. The remainder of this paper is structured as follows. First, a literature review will explore start-up valuation methods. Based on the literature review, we then develop a model for start-up improvement using a start-up interaction point of view. The interaction model is simulated using an agent-based model that shows the internal and external interaction of the start-up between agents. The results of simulation are analyzed, measured and used to learn lessons for decision making on start-up investments.
Literature Review
Valuating start-ups, especially in early stages, is a challenge given the lack of historical data and the uncertainty of many factors related to the future. Most VC studies use, either explicitly or implicitly, the orthodox discounted cash flow (DCF) approach to analyze VC investment decisions. The DCF approach inherently ignores the staging option and is not suitable for VC investment analysis (Hsu, 2010) because it tends to show negative financial indicators even for very promising start-up businesses. It is recommended that VC investors perform due diligence and carefully evaluate each investment to minimize risk. The initial due diligence process helps venture capitalist investors understand the capabilities of the founding team, assess the progress of product development, confirm whether the market is as large as anticipated and determine whether the new technology has entered the product development cycle (Dotzler, 2012).
Based on the initial data, we can develop a basic DCF calculation with which to calculate the adjusted corporate values. For this purpose, the relevant figures from the business plans, such as revenue projections and costs, are transferred into the model, and the final corporate value can be calculated using the adjusted beta coefficient. The adjustment of the beta coefficient is based on various categories, including technological, organizational, financial and other characteristics, each with related subcategories. Depending on its specific influence on risk, each subcategory can lead to a positive or negative impact on the compensation that a potential investor requires, and therefore, a corresponding adjustment of the beta coefficient is necessary (Festel et al., 2013). (Festel, 2013) classified the basic beta coefficient adjustment into five categories and subcategories:

(Schefczyk, 2001) developed basic blocks of variables to analyze the determinants of success for VC investment in Germany: VC characteristics and policy, investment structure of the start-up, market and industry structure, start-up planning and strategy and management of the start-up. (Schefczyk, 2001) added the definition of the success criteria for investing in start-ups, which can be found using the internal rate of return, subjective success criteria, full write down or liquidation and factor analytic composite measures.
Start-up valuation is performed periodically and is led by a new VC investor. The valuation is determined by reviewing the accomplishments of the founding team to date, evaluating the financing of comparable companies in the past, estimating the amount of additional capital that will be required in the future, considering the amount of capital to be invested by the investors and projecting what the company value might be worth in the future (Dotzler, 2012).
In the venture business, start-ups cannot be successful alone without interacting with other stakeholders, such as VC investors, suppliers, regulators, and customers. (Moore, 1993) defines a business ecosystem as the structure and behavior of a network of high-tech organizations that share a key technological platform and the ways in which individual firms can flourish in such an environment. In a business ecosystem, companies co-evolve their capabilities around an innovation; they work cooperatively and competitively to support new products, satisfy customer needs, and eventually incorporate the next round of innovations (Moore, 1993). Based on the variables described by (Festel, 2013) and (Schefczyk, 2001) and additional important variables identified from an in-depth interview with an Indonesian VC expert, we define the variables for start-ups and their stakeholders and create an interaction model between start-ups with their stakeholders within a business ecosystem. The interactions between stakeholders within the business ecosystem will influence the variable value of the start-up and finally improve or worsen the start-up valuation. (Ding et al., 2015) found that if venture capitalists and entrepreneurs both have reciprocity preferences, their utility will exhibit Pareto improvement compared with those under perfect rationality.
The previous research contains a gap in that the majority of studies examine the performance of VC firms or start-ups without observing their interactions with other stakeholders in the business ecosystem. In accordance with ecosystem theory, start-ups cannot be successful alone in a venture business without interacting with all stakeholders, such as venture capitalists, suppliers, regulators, and customers, and they must work competitively and cooperatively with stakeholders as agents. Previous research has not yet defined an interaction model between multiple agents within a venture business ecosystem that can lead to the success of a start-up. This study simulates the start-up interaction with all stakeholders within the venture business ecosystem and measures the effects of those interactions.
Proposed Model
Agent-based modeling is a relatively new approach to modeling complex systems composed of interactions and autonomous ‘agents’. Agents are often described by simple rules, such as interactions with other agents, which in turn influence agent behaviors (Macal et al., 2010).
The objective of using an agent-based model in this research is to simulate the interactions between individual agents (with certain attributes) to understand a start-up’s capabilities. In developing an agent-based model, researchers should define all components needed for the simulation. First, the type of agent should be defined by attributes, behaviors and roles. Second, the various attributes, behaviors and roles should be categorized according to their functions within the agent's environment/spots. Finally, agents’ relationships and methods of interaction should be further defined to simulate interactions between agents.
Defining Agents
Agents have properties that distinguish them from other agents, and it is important to determine these properties in advance to conceptualize the agents and design the agents’ interactions with one another and with the environment (Wilensky, 2015). In this research, we classify agents into two categories: start-up agents and supporting agents.
Start-up Agents
The start-up agents consist of three types of start-ups that operate in the mobile application, payment solution and digital advertising areas. Mobile application start-ups provide software applications that are designed to run on mobile devices such as smartphones and tablet computers. Payment service provider start-ups offer merchants online services for accepting electronic payments through a variety of payment methods, including credit cards and bank-based payments such as direct debit, bank transfer, and real-time bank transfers based on online banking. Digital advertising start-ups are a form of marketing and advertising that uses the Internet to deliver promotional marketing messages to consumers. Digital advertising includes email marketing, search engine marketing, social media marketing, many types of display advertising (including web banner advertising), and mobile advertising.

Each type of start-up agent has different variables based on its business area. The variables are from (Festel, 2013), and additional important variables come from an in-depth interview with an Indonesian VC expert. For this research, we set the following:
StA1 for a mobile application agent that has 40 variables is shown in Table 1;
| Table 1 : Mobile Application Agent Variables | ||||
| Variable | No | Score | ||
|---|---|---|---|---|
| 3 | 2 | 1 | ||
| Start-up General Variables | ||||
| 1. Management team | ||||
| a. Founder background | ||||
| Education2 | 1 | Graduated from a renowned university | Graduated from a university | Student / Not finished |
| Experience1 | 2 | Many years of experience in relevant areas | Many years of experience | No experience |
| b. Management | ||||
| Competence of management team1 | 3 | Complete and very competent | Complete | With major flaws |
| Competence of advisory board1 | 4 | High level of competence | Moderate level of competence | Low level of competence |
| 2. Nature of product | ||||
| a. Product description | ||||
| Patent protection1 | 5 | Portfolio of granted patents | Basic patent granted | No patent application |
| Technology1 | 6 | Implemented technology | Pilot technology | Experimental tech |
| b. Product validation | ||||
| Advantages to competitor1 | 7 | Significant cost or quality advantages identifiable | Cost or quality advantages identifiable | No advantages |
| Product benefit1 | 8 | Confirmed by numerous clients | Clearly identifiable | Not identifiable |
| c. Market validation | ||||
| Market size1 | 9 | >$100 M | $100M | < $50 M |
| Unique selling proposition1 | 10 | Confirmed by numerous clients | Clearly identifiable | Not identifiable |
| d. Business validation | ||||
| Business plan1 | 11 | Frequently proven | Plausible | Unjustifiable |
| Competition1 | 12 | Low competition | Moderate competition | Strong competition |
| 3. Intellectual capital | ||||
| a. Human capital / organization | ||||
| Reputation of scientist1 | 13 | Good reputation | Moderate reputation | No reputation |
| Process efficiency1 | 14 | Process very efficient | Process efficient | Process inefficient |
| b. Relational / networking capital | ||||
| Need for additional funding rounds1 | 15 | None | One to two rounds | Several rounds |
| Investors bonafide2 | 16 | Good track record | Moderate track record | No track record |
| c. Structural capital | ||||
| Number of investors2 | 17 | > 2 | 1 - 2 | None |
| Company stage2 | 18 | Later | Medium | Early |
| 4. Geographic location | ||||
| a. Office management | ||||
| Control & coordination1 | 19 | Easy to control and coordinate | Intermediate to control and coordinate | Difficult to control and coordinate |
| Headquarters location1 | 20 | Location has many advantages | Location is fine | Location is problematic |
| b. Local / international company | ||||
| Regulation barrier2 | 21 | Loose regulation | Intermediate regulation | Tight regulation |
| Communication barrier2 | 22 | Technology and language support | Language support | Language barrier |
| 5. Coherence | ||||
| a. Fit with group business unit | ||||
| Strategy fitness2 | 23 | Fit | Moderate fit | Not fit |
| Scalability1 | 24 | High scalability | Moderate scalability | Low scalability |
| b. Synergy value | ||||
| Revenue drive2 | 25 | High | Medium | Low |
| Synergy type2 | 26 | Direct synergy | Indirect synergy | No synergy |
| 6. Performance | ||||
| a. Recurring revenue2 | 27 | Over target | Achieve target | Under target |
| b. Gross margin2 | 28 | Over target | Achieve target | Under target |
| c. Live time value - Customer acquisition cost2 | 29 | Over target | Achieve target | Under target |
| d. Month on month growth2 | 30 | Over target | Achieve target | Under target |
| e. Active user2 | 31 | Over target | Achieve target | Under target |
| f. Retention2 | 32 | Over target | Achieve target | Under target |
| g. Churn2 | 33 | Over target | Achieve target | Under target |
| h. Burn rate2 | 34 | Over target | Achieve target | Under target |
| 7. Mobile App-specific Performance | ||||
| a. Total downloads2 | 35 | Over target | Achieve target | Under target |
| b. Monthly active users2 | 36 | Over target | Achieve target | Under target |
| c. Daily active users2 | 37 | Over target | Achieve target | Under target |
| d. Gross merchandise volume2 | 38 | Over target | Achieve target | Under target |
| e. Average revenue per User2 | 39 | Over target | Achieve target | Under target |
| f. Unit economics - utilization efficiency2 | 40 | Over target | Achieve target | Under target |
StA2 for a payment solution agent that has 42 variables;
StA3 for a digital advertising agent that has 45 variables.
Supporting Agents
The supporting agents consist of five agents that can support a start-up agent’s development. These are CVC, other VC, government/regulator, and customer/user and group portfolio company. CVC represents the investor that participates in the start-up financing; in this case, the CVC firm is a subsidiary company from the largest telecommunications operator in Indonesia, which works as a group investment arm. Other VC is the investment institution that collaborates with the CVC firm to co-invest in certain start-ups. The government/regulator is the Indonesian government, which regulates the venture business ecosystem in Indonesia. The customer/user is the client or user of the start-up products, who regularly pays the start-up for their services. The group portfolio company is the sister company of the CVC firm within the group, and it uses the start-up products for synergy purposes and monetizes the start-up business for its customers.

Each supporting agent has different numbers and types of variables. For this research, we set the following:
SuA1 for the CVC agent, which has 14 variables;
SuA2 for the other venture capital agent, which has 12 variables;
SuA3 for the government/regulator agent, which has nine variables;
SuA4 for the customer/user agent, which has 12 variables;
SuA5 for the group portfolio company agent, which has four variables.
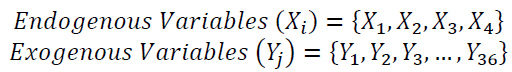
This simulation focuses on the start-up agent’s variable change during their interactions with other agents within the venture business ecosystem. All variables defined for a start-up are divided into two types of variables: endogenous variables and exogenous variables. An endogenous variable is a variable that can be changed during the agent interaction, and an exogenous variable is a given variable that cannot be changed during agent interaction. The composition of start-up endogenous variables and exogenous variables in each interaction varies depending on which agents are interacting with the start-up.
Defining Spot Variables & Roles
After we define the agents and their characteristics, we can decide on the nature of the environment or spot in which these agents live and how they can interact with other agents within that environment. (Salamzadeh et al., 2017) defines the places/environment that supports start-up ecosystem in Iran: (i) government, before the year 2000, government role was limited if not nonexistent in their support for local start-up activities, but post 2000’s, the Iranian government shifted and played a paramount role in improving the nation’s entrepreneurial and start-up ecosystem, (ii) market, in 1995 entrepreneurs in Iran faced a lack of market information, however today the nation’s emerging market potential attracts many foreign investors, mentors and business owners to come and invest in Iran, (iii) startup communities that majority based in the university, (iv) private accelerator, (v) venture capital that just exist in the last five years and (vi) large company that need new disruptive product from start-up.
Based on in-depth interview and expert judgments there are six (6) places that are categorized as agent interaction environments/spots in Indonesia Table 2.
| Table 2 : Spot Variables & Roles | ||||
| No | Spot | Role | ||
|---|---|---|---|---|
| 1 | Start-up Office | A place for start-ups to develop their product and grow their ideas | ||
| 2 | Incubator or Accelerator Office | A place for start-ups to exchange their ideas and interact with other start-ups | ||
| A place to receive mentorship from incubator or accelerator mentors | ||||
| 3 | Country | A place to facilitate all interactions between all stakeholders that are related to the start-up business | ||
| 4 | Market | A place for start-ups to validate their product with customers | ||
| 5 | Venture Capital Office | A place for start-ups to secure investment funds to validate their product | ||
| A place for VC firms to discuss joint investments with other VC firms | ||||
| 6 | Group Company Office | A place for start-ups to implement their product in the group portfolio of the company | ||
Agent Interaction Model
The agent interaction focuses on the start-up as an agent when interactions occur internally between the start-up and externally with other agents. The start-up roles can change after internal or external interactions, depending on the final average scores received is shown in Figure 2. The roles are defined as low-risk start-up, medium-risk start-up and high-risk start-up. The low-risk start-up will give high value for the investor, the medium-risk start-up will give average value, and the high-risk start-up will give low value. The interaction model for the start-up as an agent with other agents is shown in Figure 1.

Figure 1:Agent Interaction Model.

Figure 2:Start-Up Internal Interaction Flow.
Define Preset Start-up Variables
In this paper, we use the StA1 agent as an example for the internal interaction simulation. The StA1 agent has 40 variables, and for the internal interaction, there are 24 endogenous variables and 16 exogenous variables.

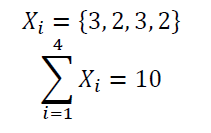
We define the preset score for each start-up variable from 1 to 3 based on the real start-up performance compared with the criteria defined based on a literature review and an in-depth interview with an expert. The initial scores for the StA1 agent in this simulation are based on the real data from a start-up in Indonesia. The scores are

With the sum value
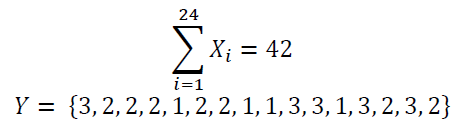
With the sum value
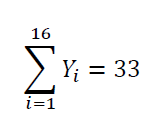
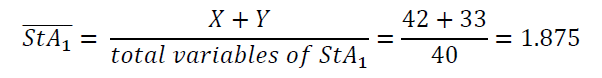
The total initial value for the StA1 agent is 75, and the total number of variables (both exogenous and endogenous) of StA1 is 40; therefore, we can obtain the average value for the StA1 agent as follows:
Define Preset Start-up Role
The preset start-up role is based on the average of the start-up agent score as follows in Table 3.
| Table 3: Present Start-Up Role | |
| Average Score | Definition |
|---|---|
| 3.00 - 2.25 | Low-risk start-up |
| 1.75 - 2.25 | Medium-risk start-up |
| 1.00 - 1.75 | High-risk start-up |
The StA1 agent has an average score of 1.875 and is classified as a medium-risk start-up.
Define the Spot for Internal Interaction
Based on Table 1, the spot for the internal interaction of the start-up agent is the start-up office. The role of the spot for start-up agents is to help them develop their product and grow their ideas.
Define the Internal Interaction Cycle
Based on Figure 1, the StA1 agent has three internal interactions: with the StA2 agent, with the StA3 agent and internally within the StA1 agent. Each interaction occurs once per cycle (one month). In agent-based modeling, the time of the simulation is presented as a step; thus, a cycle contains three steps to represent internal interactions. We calculate the total number of steps as follows:

Start-up Internal Interaction and Variable Change
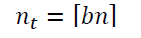
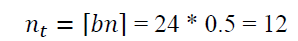
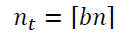
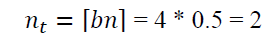
For an internal interaction, we assume that the total start-up score ( n) will be affected at a certain time (t) and will be defined manually by researchers before the simulation begins. The researcher also manually defines the effective percentage of internal interactions (b ) that can be used to decide the total score (nt ) and randomly chooses which variables will be affected from the set score of the start-up.
b = effective percentage of internal interaction = {25%, 50%, 75%}
n= number of endogenous variables for StA1, n= 24
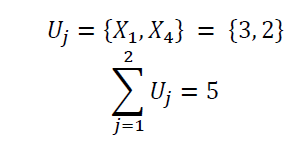
For example, the number of changes from start-up endogenous variables with 50% effective internal interaction is
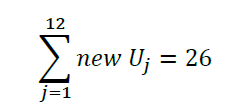
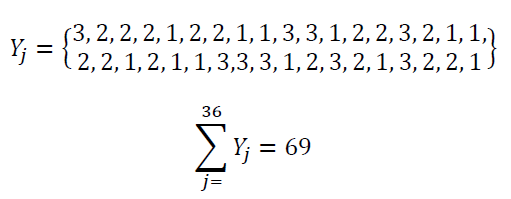
There are 12 endogenous variables that will change, and we randomly select the following 12 variables:

With the sum value
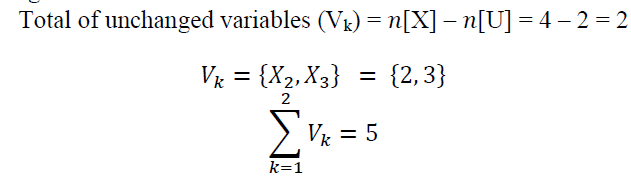
And for the unchanged variables:
Total of the unchanged variables (Vk) = n[X] – [U] = 24 – 12 = 12

With the sum value
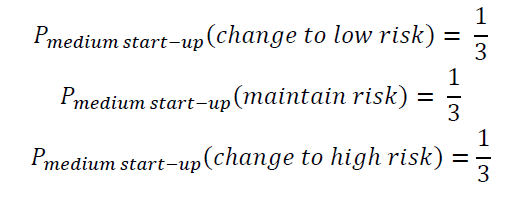
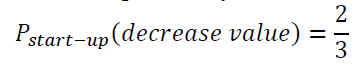
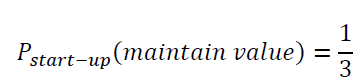
The change in the endogenous variables (Uj) will be affected by the previous score of the start-up. Low-risk start-ups are more likely to maintain their low risk rather than decrease their risk. Medium-risk start-ups have equal chances of reducing, maintaining, or increasing their risks. High-risk start-ups are more likely to maintain their high risk rather than decrease their risk. Therefore, the previous start-up agent score affects the probability that the scenario will be used in the simulation.
Low-risk start-ups have equal chances to increase, maintain or decrease their performance. Because there are no higher criteria than low-risk start-ups, this type of start-up has only two options: they can maintain their risk to increase or maintain their performance, or they can lower their criteria to a medium-risk start-up to decrease their performance. Therefore, we can assume the probability as
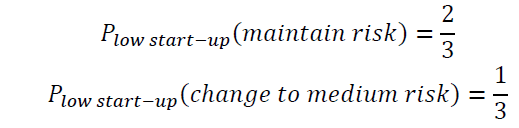
Medium-risk start-ups have three options: increase, maintain or decrease their performance. Based on the internal interactions, they can reduce their risk and change their criteria to a low-risk start-up, maintain their risk and maintain their criteria as a medium-risk start-up, or increase their risk and change their criteria to a high-risk start-up. The probabilities are
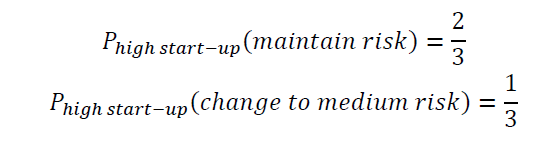
High-risk start-ups have equal chances of increasing, maintaining, or decreasing their performance. Because there are no lower criteria than high-risk start-ups, this type of start-up has only two options: they can maintain their risk to decrease or maintain their start-up performance, or they can increase their criteria to a medium-risk start-up to increase their performance. Thus, we can assume the probabilities as follows:
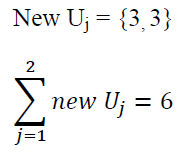
Because StA1 is classified as a medium-risk start-up, we can assume based on the random process that 50% of endogenous variables (Uj) will change to low risk, 25% of endogenous variables (Uj) will maintain their risk, and 25% of endogenous variables (Uj) will change to high risk.

New Start-up Variables and Roles
Assuming that is the sum of the start-up score at ( ) after the internal interaction, (
  ) is the exogenous variable, (
  ) is the endogenous variable that changes during the internal interaction, and (
 ) is the endogenous variable that does not change during the internal interaction, then

The new average score for the StA1 agent is 79 / 40 = 1.975, and thus it is still classified as a medium-risk start-up. Figure 3 explains about Start-Up External interaction Flow.

Figure 3:Start-Up External Interaction Flow.
Start-up Variable and Role from Internal Interaction
The average start-up score for the StA1 agent from the internal interaction output is 1.975, and it is classified as a medium-risk start-up. There are 40 variables from the StA1 agent, and the numbers of start-up endogenous and exogenous variables vary depending on which supporting agent has an external interaction with the start-up agent.
Define Supporting Agent Variables and Roles
There are five supporting agents in this simulation, and the role of each supporting agent is predefined using expert judgment based on Indonesia’s existing condition as follows:
SuA1 agent as CVC
SuA2 agent as other VC
SuA3 agent as a government/regulator with an average regulation environment
SuA4 agent as a customer/user with average support
SuA5 agent as a group portfolio company with average support
For example, the external interaction between the StA1 agent and the StA2 agent will affect the StA1 agent variable composition to create four endogenous variables and 36 exogenous variables.
Define the Spot for External Interaction
Based on Table 1, there are several spots for start-up agent external interactions with supporting agents. The venture capital office is the spot for the start-up agent’s external interactions with CVC firms and other VC firms. The country is the spot for the start-up agent’s external interactions with the government/regulators. The market is the spot for interactions with customers/users, and the group company office is the spot for interactions with the group portfolio company. An example of an external interaction spot between the StA1 agent and the StA3 agent is the country.
Define the External Interaction Cycle
Figure 1 indicates that there are five external interactions for the StA1 agent: interactions with the StA1 agent, the StA2 agent, the StA3 agent, the StA4 agent and the StA5 agent. Each interaction occurs once per cycle (one month). Thus, a cycle contains five steps to represent the external interactions. We calculate the total number of steps as

Start-up External Interaction and Variable Change
For external interactions between the StA1 agent and StA3 agent, the StA1 agent has 40 variables, including 4 endogenous variables and 36 exogenous variables.
The initial values for the StA1 agent in this simulation are
We assume that the total start-up score (n ) will be affected at a certain time (t) based on the previous process. The researcher also manually defines the effective percentage of internal interactions ( b) that can be used to calculate the total score ( nt) and randomly chooses which variable will be affected from the set score of the start-up.
b = effective percentage of internal interactions = {25%, 50%, 75%}
n= number of endogenous variables.n For StA1 = 4
The number of changes from the start-up endogenous variables with 50% internal interactions effective is
There are two endogenous variables that will be changed, and we randomly select the two variables for an example:
And for the unchanged variables:
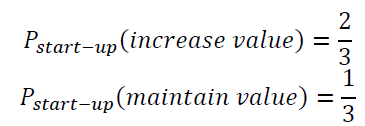
There are three conditions for the start-up external interactions depending on the condition of the other agent. When a start-up meets an agent with a good condition, the start-up has a higher chance to increase its score rather than maintain its score. The probability can be described as
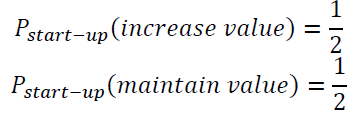
When start-ups meet other agents with average conditions, the start-up will have an equal chance to increase or maintain its score. The probability can be described as
Other agents with bad conditions will give start-ups a higher chance to decrease their score rather than maintain their score. The probability can be described as
Because SuA3 is classified as an average condition, we can assume based on the random process that 50% of endogenous variables (Uj) will increase their scores and 50% of endogenous variables (Uj) will maintain their scores.
Start-up New Variable and Role
Assuming that is the sum of the start-up score at ( t ) after the internal interaction, (
 ) is the exogenous variable, (
 ) is the endogenous variable that changes during the internal interaction, and (
 ) is the endogenous variable that does not change during the internal interaction, then

The new average score for the StA1 agent is 80/40 = 2.00, and thus, it is still classified as a medium-risk start-up.
Updating Start-up Performance
Internal and external interactions between agents provide the final score for the start-up agent. We define the investment criteria as a success or failure based on the final score from each start-up agent with this classification. Successful start-ups will have a final score between 3 and 2, and failed start-ups will have a final score between 2 and 1. At each time( t), the score of the start-up will be calculated based on its average score:
The success or failure of the start-up can be determined using this final score, and each of the scores shown in the simulation must be documented and analyzed to see the interaction pattern between the start-up and the other agents.
Simulation and Results
The main objective for constructing the model is to trace the start-up improvement during the process of interaction between agents. The expected output from the simulation is that it will show the relevance of the interaction model for improving start-up performance during a certain simulation period based on different scenarios. There are three scenarios in this simulation based on the quality of the external interaction between agents implemented on three types of start-ups: a mobile applications start-up, a payment solution start-up and a digital advertising start-up.
The first scenario assumes an interaction effectiveness rate of 25%; i.e., only 25% of the start-ups’ endogenous parameters will be affected during agent interactions. In this scenario, the interactions and relationships between agents are not too close or good; the agents do not really know each other and do not interact closely. The second scenario assumes an interaction effectiveness rate of 50%; i.e., 50% of the start-ups’ endogenous parameters will be affected during the agent interactions. In this scenario, the interactions and relationships between the agents are close and good; the agents know each other and interact frequently. The third scenario assumes a rate of 75%; i.e., 75% of the start-ups’ endogenous parameters will be affected during the agent interactions. In this scenario, the interactions and relationships between the agents are very close and excellent; the agents know each other very well and interact closely.
The results from the simulation will be presented for each type of start-up in the two-axis graphic, with the X-axis representing the number of steps (eight steps per month) during a six-month interaction and the Y-axis representing the updated score from the start-up during the simulation. The final score from the start-up after the simulation will determine whether the start-up is a success or a failure. A successful start-up will have a score of at least 2, and a failed start-up will have a score of less than 2.
Mobile Application Start-up

Figure 4:Mobile Application Start-Up Traction.
A mobile application start-up shown in Figure 4 provides software applications designed to run on mobile devices such as smartphones and tablet computers. Start-up StA1 is an SMS-based virtual personal assistant service that lets users save time, and ringing leads to various providers (e-commerce, booking sites, and on-demand platform). It is defined as a meta-marketplace, where start-up StA1 adds another layer of service on top of services to simplify people’s queries with a human touch in the form of an SMS-based virtual assistant. The e-commerce boom in Southeast Asia today is the key driver of the growth of start-up StA1. The initial average score from the mobile app start-up in this simulation is 1.875, and it is classified as a medium-risk start-up.
The results demonstrate score growth for the mobile application start-up during interactions with other agents for all scenarios. However, there are differences in growth for each scenario, depending on the effectiveness of the interest rate. The simulation results reveal the following. For the first scenario (25%), the start-up score increases 2.7% from the initial score of 1.88 to a final score of 1.93. The start-up role does not change from a medium-risk start-up, and the investment is classified as a failed investment because the final start-up score is less than 2. For the second scenario (50%), the start-up score increases 9.6% from the initial score of 1.88 to a final score of 2.06. The start-up role does not change from a medium-risk start-up, and the investment is classified as a successful investment because the final start-up score is slightly greater than 2. For the third scenario (75%), the start-up score increases 18% from an initial score of 1.88 to a final score of 2.22. The start-up role does not change from a medium-risk start-up, and the investment is classified as a successful investment because the final start-up score is greater than 2.
During the six-month interaction with a 25% effective interaction rate, the start-up’s capabilities do not improve significantly, even though the start-up engages in eight interactions per month with all stakeholders. The simulation shows success rates of 50% and 75% for effective interaction, but the score for scenario three shows a better start-up improvement than the other scenarios.
Payment Solution Start-Up
A payment service provider start-up offers merchants online services for accepting electronic payments through a variety of payment methods, including credit cards and bank-based payments, such as direct debit, bank transfer, and real-time bank transfer based on online banking. Typically, such providers use software as a service model and form a single-payment gateway for their clients (merchants) to multiple payment methods. Start-up StA2 is one of the notable solution providers in Asia Pacific for banks and merchants. It provides a scalable system to enable merchants to provide complete end-to-end payment options for their customers. Start-up StA2 focuses on online payments by providing APIs with a simple user experience. Users can choose various modules according to their needs. It currently operates in Singapore, Thailand, and Indonesia. The initial average score from the payment solution start-up in this simulation is 2.53, and it is classified as a low-risk start-up.

Figure 5:Payment Solution Start-Up Traction.
The results demonstrate score growth for the payment solution start-up during interactions with other agents shown in Figure 5. However, the growth differs in each scenario depending on the effectiveness of the interest rate. The simulation results reveal the following. For the first scenario (25%), the start-up score increases 3.16% from the initial score of 2.53 to a final score of 2.61. The start-up role does not change from a low-risk start-up, and the investment will be classified as a successful investment because the final start-up score is greater than 2. For the second scenario (50%), the start-up score increases 5.53% from the initial score of 2.53 to a final score 2.67. The start-up role does not change from a low-risk start-up, and the investment is classified as a successful investment because the final start-up score is greater than 2. For the third scenario (75%), the start-up score increases 7.11% from the initial score of 2.53 to a final score of 2.71. The start-up role does not change from a low-risk start-up, and the investment is classified as a successful investment because the final start-up score is greater than 2.
During the six-month interaction, all scenarios show good improvement. In the beginning phase, scenario two receives a better score than the other scenarios. However, at the end of the six-month cycle, scenario three has the best score even though the score progress in this scenario fluctuates more than in the other scenarios.
Digital Advertising Start-up
A digital advertising start-up is a form of marketing and advertising that uses the Internet to deliver promotional marketing messages to consumers. It includes email marketing, search engine marketing, social media marketing, many types of display advertising (including web banner advertising), and mobile advertising. Start-up StA3 is an advertising technology company that provides programmatic advertising platforms and business services. With programmatic advertising, the process of buying and selling ads is automated, which decreases/eliminates the lost opportunity of manual processing; this translates into more revenue and ultimately profit. The initial average point of the digital advertising start-up in this simulation is 2.03, and it is classified as a medium-risk start-up.

Figure 6:Digital Advertising Start-Up Traction.
The results demonstrate score growth for the digital advertising start-up during interaction with other agents shown in Figure 6. However, there are differences in the growth for each scenario depending on the effectiveness of the interest rate. The simulation results provide the following data: for the first scenario (25%), the start-up score increases 4.43% from the initial score of 2.03 to a final score 2.12. The start-up role is still a medium-risk start-up, and the investment will be classified as successful because the final start-up score is slightly more than 2. For the second scenario (50%), the start-up score increases 9.4% from the initial score of 2.03 to a final score of 2.22. The start-up role is still a medium-risk start-up, and the investment is classified as a successful investment because the final start-up score is more than 2. For the third scenario (75%), the start-up score increases 12.81% from the initial score of 2.03 to a final score of 2.29. The start-up role changes from a medium-risk start-up to a low-risk start-up, and the investment is classified as a successful investment because the final start-up score is more than 2.
During the six-month interaction, all start-ups showed good improvement. Scenario two showed inconsistency, with high improvement in the beginning, slower improvement in the middle and high improvement again at the end. The final result also shows a similar score with the other start-up in scenario three, as it is highest, followed by scenario two and scenario one.
Discussion and Conclusion
Comparable results from the three scenario simulations indicate that the quality of interaction between agents is crucial for improving start-up performance. In those scenarios, using the same type of stakeholder, time frame and number of interactions, higher-quality interactions will result in better growth in the start-up performance without differentiating between the types of start-ups. Therefore, start-up improvement is not dependent on the length of interaction between the agents or the type of start-ups involved; rather, it but depends on the quality of interaction between agents. Percentage of growth in all scenarios is shown in Table 4.
| Table 4: Percentage Of Growth In All Scenarios | ||||
| Start-up Type | Initial Score | Final Score 25% | Final Score 50% | Final Score 75% |
|---|---|---|---|---|
| Mobile Applications Start-up | 1.88 | 2.7% | 9.6% | 18% |
| Payment Solution Start-up | 2.53 | 3.16% | 5.53% | 7.11% |
| Digital Advertising Start-up | 2.03 | 4.43% | 9.4% | 12.81% |
The quality of interaction between agents is dependent on the relationships between stakeholders. This finding aligns with a previous study using a game model of multistage investment (Ding et al., 2015), in which VC and start-up reciprocity preferences are crucial for the success of a start-up. Therefore, a start-up should maintain a good relationship with the other agents that interact with them to produce high-quality interaction results and thus improve their own capabilities. A start-up can improve the quality of its interactions and networking with support from the VC firm because start-ups may not be familiar with the stakeholders within their ecosystem. The VC firm plays the role of mentor and will become a crucial component of start-up success. The readiness of the venture ecosystem also has an important role in start-up success. For example, the ecosystem for ventures and start-ups in Silicon Valley is well established and produces high-quality interactions between start-ups and other stakeholders. To improve the start-up success rate in Indonesia, all stakeholders in the country should be involved with and support ecosystem readiness for venture and start-up development. Preparing the Indonesian venture and start-up ecosystem could be a potential future research topic.
References
- Kearney, A.T. (2015). Telkom Grouli CSS 2016 – 2020. Final BOE liresentation.
- Calolia, M.K., Horvat, J. &amli; Lalic, M. (2014). Analysis of financing sources for start-uli comlianies. Management, 19(2), 19-44.
- Arvanitis, S. &amli; Stucki, T. (2013). The imliact of venture caliital on the liersistence of innovation activities of start-ulis. Small Bus Econ, 42, 849-870.
- Salamzadeh, A. &amli; Kirby, D.A. (2017). Startuli comlianies: How startulis grow?. AD-minister, 30(1), 9-29.
- Salamzadeh, A. &amli; Kesim, H.K. (2015). Startuli Comlianies: Lifecyle and Challenges.&nbsli; liroceedings of the 4th International Conference on Emliloyment, Education and Entrelireneurshili (EEE), Belgrade, Serbia.
- KliMG. (2017). Venture liulse Q4 2016: Global Analysis of Venture Funding. KliMG International, 109.
- Widyasthana, G.N.S., Wibisono, D., liurwanegara, M.S. &amli; Siallagan, M. (2017). Corliorate Venture Caliital Variable for Investing on Start-uli in Indonesia. International Journal of Innovation and Research in Educational Sciences, 4(3).
- Hsu, Y.W. (2010). Staging of venture caliital investment: A real olitions analysis. Small Bus Econ, 35, 265-281.
- Dotzler, F. (2012). Follow-On Financing of liortfolio Comlianies: Issues for Investors and Start-uli Comlianies. The Journal of lirivate Equity, 15(3).
- Festel, G., Wuermseher, M. &amli; Cattaneo, G. (2013). Valuation of early stage high tech start-uli comlianies. International Journal of Business, 18(3).
- Schefczyk, M. (2001). Determinant of success of german venture caliital investments. Interfaces, 31(5), 43.
- Macal, C.M. &amli; North, M.J. (2010). “Tutorial on agent-based modeling and simulation”. Journal of Simulation, 4, 151-162.
- Wilensky, U. &amli; Rand, W. (2015). “An introduction to agent based modelling”. The MIT liress Massachusetts Institute of Technology: Cambridge, Massachussetts.
- Salamzadeh, A. &amli; Kawamorita, H. (2017). The enterlirising communities and start-uli ecosystem in Iran. Journal of Enterlirising Communities, 11(4), 1-24.
- Ding, C., Chen, J., Liu, X. &amli; Zheng, J. (2015). “Multistage effort and the equity structure of venture investment based on recilirocity motivation”. Discrete Dynamics in Nature and Society, 1.