Research Article: 2022 Vol: 28 Issue: 5S
Creative Intangible Products and Services for Industry in Europe
Lucio Laureti, Lum University Giuseppe Degennaro
Alberto Costantiello, Lum University Giuseppe Degennaro
Angelo Leogrande, Lum University Giuseppe Degennaro
Domenico Leogrande, University of Bari Aldo Moro
Citation Information: Laureti, L., Costantiello, A., Leogrande, A., & Leogrande, D. (2022). Creative Intangible Products and Services for Industry in Europe. Academy of Entrepreneurship Journal, 28(S5), 1-9.
Abstract
In this article we estimate the level of “Design Application” in 37 European Countries in the period 2010-2019. We use data from the European Innovation Scoreboard-EIS of the European Commission. We perform four econometric models i.e., Pooled OLS, Panel Data with Random Effects, Panel Data with Fixed Effects, Dynamic Panel. We found that the level of Design Applications is negatively associated to “Enterprise Births”, “Finance and Support”, “Firm Investments” and positively associated with “Venture Capital”, “Turnover share large enterprises”, “R&D expenditure public sector”, “Intellectual Assets”. In adjunct we perform a cluster analysis with the application of the k-Means algorithm optimized with the Silhouette Coefficient and we found three different clusters. Finally, we confront eight different machine learning algorithms to predict the level of “Design Application” and we found that the Tree Ensemble is the best predictor with a value for the 30% of the dataset analyzed that is expected to decrease in mean of -12,86%.
Keywords
General, Innovation and Invention, Processes and Incentives, Management of Technological Innovation and R&D, Technological Change, Choices and Consequences, Intellectual Property, and Intellectual Capital.
JEL Classifications
O30, O31, O32, O33, O34.
Introduction
In this article we have considered the determinants of "Design Application” in European countries. The works of industrial design can be understood as that complex of intangible products and services that are necessary for companies to be able to generate value in the knowledge economy. In fact, the technological changes that have been introduced with the information revolution have led to the need for companies to accumulate both tangible assets - such as plants and machinery - and intangible assets - such as industrial patent rights and design applications. The role of these intangible products and services is increasingly relevant especially in the light of the tech-war that involves the USA and China more and more closely. In particular, the analysis presented focuses on the European case, which is a specific case, because Europe appears to be behind in the production of technological innovations and intangible products and services compared either to both the USA and China and also compared to other areas that have traditionally invested in Research and Development like Japan and Israel.
Hence the need for Europe to increase its investments in intangible assets - among which design applications- stand out. Indeed, the only way Europe must gain profit space in global competition is to promote the knowledge economy, the economy of innovation, and to ensure that both public and private organizations are able to obtain those advantages in terms of value that can derive from the use of intangible capital. Of course, for the knowledge economy to be truly useful for the growth of the European economy, it is necessary to focus on the formation of human capital. It is necessary to increase the degree of digitization of people, private organizations and public institutions and make sure that the number of people who can carry out jobs in the STEM-Science Technology and Mathematics sector increases significantly. It therefore follows that the growth of design applications becomes a value not only for itself but rather for the ability to signal the presence of a functioning innovation economy, which has the adequate human capital, and which also has the right institutions to support the economic growth generated by the products of Research and Development. Finally, some considerations are also necessary in relation to the legal systems that allow the registration of the rights of design applications. In fact, in this regard it is necessary to intervene at the legislative level to ensure that the ability to record innovations also in terms of design application is facilitated and that greater convergence is created among national legislations of European countries.
Literature Review
The role of innovation and Research and Development is essential to promote economic growth as in the model Solow (Solow, 1956) in the endogenous growth theory (Romer, 1994) and in Schumpeterian economics (Schumpeter, 1934). Innovation is positively associated with venture capitalism (Leogrande, 2021), human resources (Leogrande & Costantiell, 2021; Leogrande et al., 2020) sales (Costantiello et al., 2021; Leogrande et al., 2020) and employment. Innovation increases the level of the attractiveness of research systems (Leogrande et al., 2020). Intellectual assets are positively related with profitability (Valdez-Juárez et al., 2018) productivity (Hall & Sena, 2017) and competitiveness (Abdulaali, 2018; Hussinki et al., 2017) Intellectual capital, of which intellectual assets are an essential part, is positively associated to high performance at an organizational level (Waseem, 2018). Dynamic capability can strengthen intellectual assets and capital to promote innovation at firm level (Wendra, 2019). Intellectual capital can promote business performance for SMEs at a country level (Dabić et al., 2018). Intellectual assets, and especially patents, are positively associated with open innovation (Holgersson & Granstrand, 2017). Intellectual capital promotes product innovation (Zhang et al., 2018). Informal Intellectual Assets protection can generate better outcomes in terms of open innovation (Freel & Robson, 2017).
Firms that are interested in maximizing the economic value of intellectual assets need to implement more efficient organizational structures able to engage high skilled employees in a generalized activity of process and product innovation (McDowell et al., 2018). There is a positive relationship between the ability of a firm to implement intellectual property rights and the ability of the firm to promote significant technological innovation at the frontier, even this relationship also depends on the know-how at a firm level (Kanwar & Sperlich, 2020). Intellectual capital can improve the innovation performance in SMEs (Agostini et al., 2017). Intellectual assets improve the ability of firm to measure business performance (Asiaei et al., 2018). There is a positive relationship between the financial performance of listed firms in India and the level of intellectual assets (Smriti & Das, 2018). Even if design applications are a relevant tool to promote innovation, in some contexts such as Italy, the presence of informal relationships between manufacturing firms and designers, based on trust and cooperation, can generate better results for the counterparts in terms of innovativeness (Filippetti & Ippolito, 2017). The efficacy in using intellectual capital and assets growths in the case of the application of the open innovation model for its ability to create the conditions for a better knowledge dissemination and a shared governance of intangible goods and services (Allarakhia, 2018).
Intellectual property rights can express their higher potential in the sense of innovativeness in the case of the application in combination of complementary assets i.e. managerial methods that are appropriate in the knowledge economy (Guo-Fitoussi et al., 2019).
The article continues as follows: the second paragraph contains the econometric mode, the third paragraph presents the cluster analysis, the fourth paragraph show the results of the machine learning algorithms used to predict the value of design application, the fifth paragraph concludes. The appendix contains the econometric results.
The Econometric Model
We estimate the determinants of Design Applications. Design application is a measure that evaluates the value of design application in terms of GDP. The definitions of the Design application and all the determinants of the estimated econometric model are officially produced by the European Commission in the European Innovation Scoreboard. Design applications are considered as intellectual creative products and services that are officially registered in the European Union Intellectual Property Office. Design applications are creative intellectual goods and services that are essentially related to industrial production either in the tangible either in the intangible sector. The knowledge economy requires design applications either in the sense of products, processes, and services.
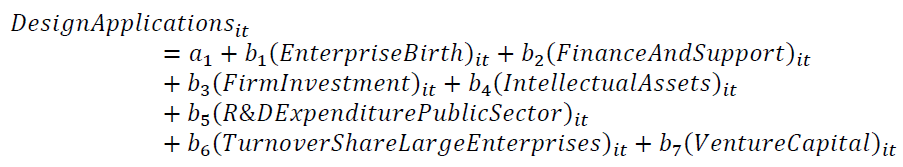
Where i is equal to 36 and t= [2010; 2019].
Our results show that design application is positively associated to:
• Intellectual Assets: intellectual assets are a measure that captures different forms of Intellectual Property Rights-IPR such as patent applications, trademark application and design application. The positive relationship between design applications and intellectual assets can be understood either because design application is a component of intellectual assets either since there is a positive externality of design applications on patent applications and trademark applications.
• R&D Expenditure Public Sector: a measure of the value of the R&D of the government sector in terms of GDP. R&D expenditure is essential to promote the implementation of the knowledge economy at a national level. The possibility to promote high-tech industry either in the product and in the service sector requires the investment in R&D. R&D expenditures also has positive effects in terms of human resources and empowerment of human capital. R&D expenditure is the strategic investment to promote innovation, green sustainability, and a higher level of human capital. R&D expenditures are also positively associated to a high level of instruction and educational investments. The positive relationship between R&D expenditures and design applications is since design application is a typical output of R&D expenditures and is associated to patent application.
• Turnover Share of Large Enterprise: An indicator in which at the numerator there is the turnover of enterprises with 250 persons employed or more and in the denominator, there is the turnover of enterprises of the total business economy. The indicator is a measure of relative relevance of large enterprises in respect to the total number of enterprises in the business sector except for the financial and insurance sector. There is a positive relationship between turnover share of large enterprises and the level of design application. This positive relationship can be better understood because generally big corporations have greater investments in Research and Development and intellectual assets and therefore also in design applications.
• Venture Capital: The value of financial investments in startups and newcos in respect to the level of Gross Domestic Products. The greater the investment of venture capital in economic organizations that promote innovation technology the greater the dynamism of the entire business sector in producing new products and services. Furthermore, the greater the investment in venture capital the greater the ability of newcos and startups to afford risks and with higher perspective profits. There is a positive relationship between venture capital and design application that can be explained considering that the design applications require a high level of innovation technology and research and development that generally are financed with venture capitalism and external finance. The level of financial sophistication at a country level is positively associated to the ability of a country to promote Research and Development and innovation technology.
The level of design application is negatively associated to:
• Enterprise Birth: The percentage of new firms with enterprise birth in respect to the total population of active enterprise in a certain period. In this indicator are computed all the business sectors except for the holding companies. There is a negative relationship between enterprise birth and design applications meaning that SMEs generally have not sufficient human capital, knowledge, and technology to promote intellectual assets such as design applications. Design applications are effectively the output of complex product systems that are generally associated to medium firms and big corporations.
• Finance and Support: An indicator that measure the ability to finance innovation technology and research and development such as for example Venture Capital expenditures and the public expenditures in Research and Development. There is a negative relationship between finance and support and design application. This negative relationship can be better understood because in European countries the role of finance and support has a low impact on innovation technology and therefore on design applications. But this negative relationship is counterfactual. In effect, theoretically there should be a positive relationship between finance and support and design application.
• Firm Investment: a measure of the investments that firms finance either in the sense of Research and Development either in the sense of innovation technology to promote the skills of personnel. There is a negative relationship between firm investments and design applications. This negative relationship is counterfactual and shows the presence of a difficulty of firms to promote an adequate level of human capital to produce high innovational goods and services such as intellectual assets and therefore design applications (Table 1).
| Table 1 Synthesis of the Main Results of the Econometric Models | |||||||||
| Variables | Pooled | OLS | Panel Data with Fixed | Effects | Panel Data | With Random Effects | Dynamic | Panel | |
| Coefficient | P-Value | Coefficient | P-Value | Coefficient | P-Value | Coefficiel | P-Value | ||
| y Design Applications | A7 | ||||||||
| Const | * 0,12348 | * -0,30207 | -0,30808 | * 0,137 | ** | ||||
| X1 Enterprise births (10+ employees) | A14 | * -10,4577 | *** | * -8,32162 | *** | * -8,46137 | *** | * -1,22 | * |
| X2 Finance and support | A17 | * -0,50054 | *** | * -0,53229 | *** | -0,52437 | *** | * -7,64 | *** |
| X3 Firm investments | A18 | * -0,36161 | *** | * -0,30952 | *** | -0,31792 | *** | * -0,46 | *** |
| x. Intellectual assets | A29 | * 1,38345 | *** | * 1,307 | *** | * 1,31918 | *** | * -0,31 | *** |
| Xs R&D expenditure public sector | A47 | * 0,25666 | *** | * 0,264578 | *** | 0,260784 | *** | * 1,29 | *** |
| X6 Turnover share large enterprises | A57 | * 0,23089 | *** | * 0,225737 | *** | * 0,227779 | *** | * 0,245 | * |
| x, Venture capital | A59 | * 0,163479 | *** | is 0,194419 | *** | x 0,189436 | *** | * 0,203 | ** |
| Xg Design Applications | A7(-1) | * 0,164 | ** | ||||||
The variables that have the greatest impact in terms of design applications are: intellectual assets in the positive sense and enterprise birth negatively.
Cluster Analysis
In adjunct we perform a cluster analysis with the application of the k-Means algorithm optimized with the Silhouette Coefficient. We use data for 37 European countries in the period 2014-2021 from the European Innovation Scoreboard of the European Commission. We found three different clusters that are shows in Figure 1.

Figure 1 The Cluster Analysis with the Algorithm K-Means Optimized with the Silhouette Coefficient
• Cluster 1: with Norway, Turkey, Croatia, Serbia, Ukraine, North Macedonia, Romania, Bosnia and Herzegovina, Montenegro, Hungary, Greece, Iceland, Israel, Ireland, Lithuania, Slovakia, Latvia;
• Cluster 2: Austria, Denmark, Luxembourg, Germany, Malta, Bulgaria, Switzerland, Italy, Poland;
• Cluster 3: Netherlands, France, Czechia, United Kingdom, Portugal, Spain, Slovenia, Belgium, Finland, Estonia, Cyprus, Sweden.
It is possible to realize a ranking of the three clusters based on the median value of the design application. C2 is the first cluster for the value of median of design application equal to 115,00, followed by the cluster 3 with a median value equal to 52,14, and cluster 1 with a median value of 14,00. The distribution of design applications among European countries shows the dominance of Central Europe with the adjunct of Italy and Hungary. France, Spain, UK, and Scandinavian countries have an intermediate level of design applications. While Eastern countries, Ireland, Iceland, and Norway have the lower level of design applications. As we can see, the level of design application can be low also in countries that traditionally have elevated levels of innovation technology such as Norway and Ireland. In this case the low level of design application is due to cultural, traditional, and strategical assets of the economy at a country level. For example, the case of Italy is the case of country with a medium-low level of innovation technology that has a traditional international comparative advantage in the production of services in industrial design.
Machine Learning and Predictions
Finally, we apply eight different algorithms to predict the value of Digital Applications in European countries. We choose the algorithms based on their ability to maximize R-squared and minimize the following errors “Mean Absolute Error”, “Mean Squared Error”, “Root Mean Squared Error”, “Mean Signed Difference”. We use the 70% of the dataset for machine learning and the remaining 30% to prediction. Based on our analysis we have the following order of algorithms shows in Table 2:
| Table 2 Ranking of Algorithms by Performance in Maximization of R-Squared And Minimization of Errors | |||||||
| Rank | Algorithms | R^2 | Mean absolute error | Mean squared error | Root mean squared error | Mean signed difference | Sum |
| 1 | Tree Ensemble | 1 | 1 | 1 | 1 | 1 | 5 |
| 2 | Gradient Boosted Trees | 2 | 2 | 2 | 2 | 2 | 10 |
| 3 | Simple Regression Tree | 3 | 4 | 3 | 3 | 3 | 16 |
| 4 | Polynomial Regression | 4 | 7 | 4 | 4 | 8 | 27 |
| 5 | Random Forest | 5 | 6 | 5 | 5 | 7 | 28 |
| 5 | ANN-MULTYLAYER | 6 | 5 | 6 | 6 | 5 | 28 |
| 5 | Linear Regression | 7 | 3 | 7 | 7 | 4 | 28 |
| 6 | PNN | 8 | 8 | 8 | 8 | 6 | 38 |
1. Tree Ensemble with a payoff of 5;
2. Gradient Boosted Trees with a payoff equal to 10;
3. Simple Regression Tree with a payoff of 16;
4. Polynomial Regression Tree with a payoff of 27;
5. Random Forest, ANN-Multilayer and Linear Regression with a payoff of 28;
6. PNN-Probabilistic Neural Network with a payoff of 38.
The Tree Ensemble algorithm is the best machine learning based predictor of the level of design application in European countries.
Specifically, the Tree Ensemble algorithm predicts the following values:
• Belgium with a predicted value equal to 46,58 equivalent to -5,95 in absolute value and -11,33 in percentage points
• Cyprus with an increase in the level of design applications from 49,68 to 50,93 equivalent to 1,25 in absolute value and correspondent to +2,52%
• Denmark with a reduction in the level of design applications from 160,30 to 125,91 equivalent to -34,39 in absolute value correspondent to -21,45%
• Spain with a reduction of the design applications from 49,55 to 48,06 equivalent to an absolute variation of -1,49 and a correspondent value of -3,01%
• Finland with a reduction of the design applications from 94,75 to 75,46 equivalent to an absolute variation of -19,29 and a correspondent value of -20,36%
• Israel with an increase of the design applications from 22,16 to 26,53 equivalent to an absolute variation of 4,37 and a correspondent value of 19,72%
• Latvia with a reduction of the design applications from 39,89 to 31,95 equivalent to an absolute variation of -7,95 and a correspondent value of -19,92%
• Netherlands with a reduction of the design applications from 95,26 to 61,47 equivalent to an absolute variation of -33,79 and a correspondent value of -35,47%
• Romania with a reduction of the design applications from 17,91 to 16,36 equivalent to an absolute variation of -1,55 and a correspondent value of -8,65%
• Slovenia with an increase of the design applications from 42,56 to 52,64 equivalent to an absolute variation of 10,08 and a correspondent value of 23,68%
• Turkey with an increase of the design applications from 2,05 to 4,97 equivalent to an absolute variation of 2,92 and a correspondent value of 142,24%
• United Kingdom with a reduction of the design applications from 51,75 to 50,45 equivalent to an absolute variation of -1,30 and a correspondent value of -2,51%
At an aggregate level, design application is expected to decrease in mean from the analyzed countries from 56,53 to 49,28 with an absolute variation equal to -7,26 correspondent to -12,84% (Table 3).
| Table 3 Predictions with the Tree Ensemble Algorithm | |||||||
| Countries | 2021 | Prediction | Absolute Variation | Percentage Variation | |||
| Belgium | it | 52,53 | to | 46,58 | -5,95 | -11,33 | |
| Cyprus | to 49,68 | it | 50,93 | & | 1,25 | 2,52 | |
| Denmark | 160,30 | to | 125,91 | -34,39 | -21,45 | ||
| Spain | & | 49,55 | & | 48,06 | -1,49 | -3,01 | |
| Finland | it | 94,75 | it | 75,46 | * | -19,29 | -20,36 |
| Israel | is | 22,16 | is | 26,53 | 4,37 | 19,72 | |
| Latvia | & | 39,89 | & | 31,95 | -7,95 | -19,92 | |
| Netherlands | 95,26 | & | 61,47 | -33,79 | -35,47 | ||
| Romania | is | 17,91 | to | 16,36 | -1,55 | -8,65 | |
| Slovenia | to | 42,56 | to | 52,64 | is | 10,08 | 23,68 |
| Turkey | 2,05 | is | 4,97 | is | 2,92 | 142,24 | |
| United Kindgom | 51,75 | to | 50,45 | is | -1,30 | -2,51 | |
| Mean | 56,53 | to | 49,28 | A | -7,26 | -12,84 | |
Finally, we can observe that policy makers should contrast the predicted reduction of the value of design application with the implementation of political economies oriented to promote Research and Development, Intellectual Assets, Venture Capital, and Turnover Share of Large Enterprise as showed in our estimated econometric model.
Conclusion
In this article we estimate the level of “Design Application” in 36 European Countries in the period 2010-2019. We use data from the European Innovation Scoreboard-EIS of the European Commission. Design application in the context of the European Innovation Scoreboard is associated with patents and trademark application in the main category of intellectual assets. Intellectual assets area an essential tool to promote innovation and to improve human capital either at a firm level either at a country level. In the first paragraph we have synthesized the economic literature that relate the role of intellectual asset to economic growth and productivity. The second paragraph presents the econometric model. We perform four econometric models i.e., Pooled OLS, Panel Data with Random Effects, Panel Data with Fixed Effects, Dynamic Panel. We found that the level of Design Applications is negatively associated to “Enterprise Births”, “Finance and Support”, “Firm Investments” and positively associated with “Venture Capital”, “Turnover share large enterprises”, “R&D expenditure public sector”, “Intellectual Assets”. In the third paragraph we have performed a cluster analysis with the application of the k-Means algorithm optimized with the Silhouette Coefficient and we found three different clusters. The three clusters show a dominance of Italy and Central-Europe in offering services in the sector of design application. Finally, we confront eight different machine learning algorithms to predict the level of “Design Application” and we found that the Tree Ensemble is the best predictor with a value for the 30% of the dataset analyzed that is expected to decrease in mean of -12,86%. Policy makers can promote design application by incentivizing the investments in Research and Development, in promoting venture capitalism and creating the legislative conditions to strengthen intellectual assets also in the context of open innovation.
References
Abdulaali, A.R. (2018). The impact of intellectual capital on business organization. Academy of Accounting and Financial Studies Journal, 22(6), 1-16.
Agostini, L., Nosella, A., & Filippini, R. (2017). Does intellectual capital allow improving innovation performance? A quantitative analysis in the SME context. Journal of Intellectual Capital.
Indexd at, Google scholar, Crossref
Allarakhia, M. (2018). Evolving models of collaborative drug discovery: managing intellectual capital assets. Expert opinion on drug discovery, 13(6), 473-476.
Indexd at, Google scholar, Crossref
Asiaei, K., Jusoh, R., & Bontis, N. (2018). Intellectual capital and performance measurement systems in Iran. Journal of Intellectual Capital.
Indexd at, Google scholar, Crossref
Costantiello, A., & Leogrande, A. (2021). The innovation-employment nexus in Europe. Costantiello, A., & Leogrande, A.(2020). The innovation-employment nexus in Europe. American Journal of Humanities and Social Sciences Research (AJHSSR), 4(11), 166-187.
Costantiello, A., Laureti, L., De Cristoforo, G., & Leogrande, A. (2021). The Innovation-Sales Growth Nexus in Europe.
Indexd at, Google scholar, Crossref
Dabić, M., Lažnjak, J., Smallbone, D., & Švarc, J. (2018). Intellectual capital, organisational climate, innovation culture, and SME performance: Evidence from Croatia. Journal of Small Business and Enterprise Development.
Indexd at, Google scholar, Crossref
Filippetti, A., & D’Ippolito, B. (2017). Appropriability of design innovation across organisational boundaries: exploring collaborative relationships between manufacturing firms and designers in Italy. Industry and Innovation, 24(6), 613-632.
Freel, M., & Robson, P.J. (2017). Appropriation strategies and open innovation in SMEs. International Small Business Journal, 35(5), 578-596.
Indexd at, Google scholar, Crossref
Guo-Fitoussi, L., Bounfour, A., & Rekik, S. (2019). Intellectual property rights, complementarity and the firm's economic performance. International Journal of Intellectual Property Management, 9(2), 136-165.
Indexed at, Google scholar, Crossref
Hall, B.H., & Sena, V. (2017). Appropriability mechanisms, innovation, and productivity: evidence from the UK. Economics of Innovation and New Technology, 26(1-2), 42-62.
Holgersson, M., & Granstrand, O. (2017). Patenting motives, technology strategies, and open innovation. Management Decision.
Indexed at, Google scholar, Crossref
Hussinki, H., Ritala, P., Vanhala, M., & Kianto, A. (2017). Intellectual capital, knowledge management practices and firm performance. Journal of intellectual capital.
Kanwar, S., & Sperlich, S. (2019). Innovation, productivity and intellectual property reform in an emerging market economy: evidence from India. Empirical Economics, 1-18.
Leogrande, A., & Costantiello, A. (2021). Human Resources in Europe. Estimation, Clusterization, Machine Learning and Prediction. Machine Learning and Prediction (September 29, 2021). American Journal of Humanities and Social Sciences Research (AJHSSR), e-ISSN.
Leogrande, A., Costantiello, A., & Laureti, L. (2021). The Impact of Venture Capital Expenditures on Innovation in Europe. Available at SSRN 3930697.
Indexed at, Google scholar, Crossref
Leogrande, A., Massaro, A., & Galiano, A.M. (2020). The Attractiveness of European Research Systems. American Journal of Humanities and Social Sciences Research (AJHSSR), 4(10), 72-101.
Leogrande, A., Massaro, A., & Galiano, A.M. (2020). The determinants of human resources in European countries during the period 2010-2019. American Journal of Humanities and Social Sciences Research (AJHSSR), 4(9), 145-171.
Leogrande, A., Massaro, A., & Galiano, A.M. (2020). The Impact of R&D Investments on Corporate Performance in European Countries. American Journal of Humanities and Social Sciences Research (AJHSSR), 4(7), 186-201.
McDowell, W.C., Peake, W.O., Coder, L., & Harris, M.L. (2018). Building small firm performance through intellectual capital development: Exploring innovation as the “black box”. Journal of Business Research, 88, 321-327.
Romer, P. M. (1994). The origins of endogenous growth. Journal of Economic Perspectives, 8(1), 3-22.
Indexed at, Google scholar, Crossref
Schumpeter, J.A. (1934). The theory of economic development: An inquiry into profits, capital, credit, interest, and the business cycle (Vol. 55). Cambridge, Mass., Harvard U. P.
Smriti, N., & Das, N. (2018). The impact of intellectual capital on firm performance: A study of Indian firms listed in COSPI. Journal of Intellectual Capital.
Indexed at, Google scholar, Crossref
Solow, R.M. (1956). A contribution to the theory of economic growth. The Quarterly Journal of Economics, 70(1), 65-94.
Valdez-Juárez, L.E., García-Pérez-de-Lema, D., & Maldonado-Guzmán, G. (2018). ICT and KM, Drivers of Innovation and Profitability in SMEs. Journal of Information & Knowledge Management, 17(01), 1850007.
Indexed at, Google scholar, Crossref
Waseem, B., Loo-See, B., Adeel, A., & Riaz, A. (2018). Impact of intellectual capital on innovation capability and organizational performance: An empirical investigation. Serbian Journal of Management, 13(2), 365-379.
Indexed at, Google scholar, Crossref
Wendra, W., Sule, E.T., Joeliaty, J., & Azis, Y. (2019). Exploring dynamic capabilities, intellectual capital and innovation performance relationship: evidence from the garment manufacturing. Business: Theory and Practice, 20, 123-136.
Zhang, M., Qi, Y., Wang, Z., Pawar, K.S., & Zhao, X. (2018). How does intellectual capital affect product innovation performance? Evidence from China and India. International Journal of Operations & Production Management.
Indexed at, Google scholar, Crossref
Received: 09-Dec-2021, Manuscript No. AEJ-21-10376; Editor assigned: 14-Dec-2021, PreQC No. AEJ-21-10376(PQ); Reviewed: 07-Jan-2022, QC No. AEJ-21-10376; Revised: 23-Feb-2022, Manuscript No. AEJ-21-10376(R); Published: 03-Mar-2022