Research Article: 2018 Vol: 22 Issue: 1
Crude Oil Hedging With Precious Metals: a DCC-GARCH Approach
Vaneet Bhatia, Indian Institute of Management Raipur
Satyasiba Das, Indian Institute of Management Raipur
Subrata Kumar Mitra, Indian Institute of Management Raipur
Keywords
Crude Oil, DCC, GARCH, Hedging, Precious Metals.
Introduction
The increased association between commodity markets has always attracted the interest of researchers, investors and policymakers. In one of the earlier studies on commodity price movements, Pindyck and Rotemberg (1990) observed a pattern in price movements between unrelated commodities. This finding led to several studies analysing this phenomenon and the debate was further intensified with the financialization of commodity markets during early 2000s. For example, Soytas, Sari, Hammoudeh and Hacihasanoglu (2009) argued that the excess comovement among commodities could be attributed to the similar influence of macroeconomic variables on all commodity markets. Nevertheless, among all commodities, crude oil has acquired unprecedented importance because of its share in the energy sector across nations. Most economies are exceedingly reliant on crude oil for their energy needs and as a result it could result in huge import bills for crude oil importing nations. Besides, such economies could find it difficult to sustain their trade balances because of price fluctuations in international crude oil markets. Therefore, the importance of the commodity markets like crude oil, underlines the need to investigate the crude oil price fluctuations to safeguard the interest of numerous stakeholders.
The uncertainty in crude oil markets may trigger investments in other assets or in hedging instruments like precious metals. For example, Melvin and Sultan (1990) reported that the increase in crude oil prices is usually associated with increased investment in gold. The linkages between crude oil and precious metals like gold may be because reserve portfolios of oil exporting countries generally comprises gold. Tiwari and Sahadudheen (2015) argue that some of the oil importing countries pays through gold and therefore, there exists a relationship between crude oil and gold through import channels. Kanjilal and Ghosh (2017) suggest a lead-lag relationship between crude oil and gold. There is also an evidence of increased investment in gold during the periods of market uncertainty (Jain & Biswal, 2016). Moreover, during financial crisis or periods of high volatility, gold was found to be uncorrelated with other financial assets (Baur & Lucey, 2010; Baur & McDermott, 2010). These properties of gold have also motivated researchers to consider the relationship between crude oil with other precious metals. For example, Sari, Hammoudeh and Soytas (2010) suggested that silver prices are better predictor of oil price movements in comparison to other precious metals. Jain and Ghosh (2013) indicated some dependence between oil prices and precious metals. Bildirici and Turkmen (2015) argue that recent periods of uncertainty have resulted in the renewed relationship between crude oil and precious metal prices.
Motivated by the earlier literature, the primary objective of this study is to investigate the dynamic correlation between crude oil and precious metals (gold, silver, platinum and palladium) using Dynamic Conditional Correlation-Generalized autoregressive conditional heteroscedasticity (DCC-GARCH) approach proposed by Engle (2002). Second, the covariance and variance structure obtained from DCC-GARCH framework were used to generate the hedging ratios and portfolio weights between crude oil and precious metals. Kroner and Sultan (1993) approach was used to construct the hedging ratios and Kroner and Ng (1998) approach was used to construct the portfolio weights. Several authors have used the hedging ratios and portfolio weights to investigate the dynamics between different markets, for example, Baser & Sardorsky (2016), Ku et al. (2007) and Maghyereh et al. (2017). Third, to check the robustness and asymmetric characteristic of the relationship, the investigation was also carried out using Asymmetric DCC.
Rest of the paper is structured as follows: Next section explains the methodology. Section 3 reports the data and preliminary analysis. Section 4 explains the empirical findings followed by conclusion in section 5.
Methodology
DCC-GARCH
DCC-GARCH is based on the decomposition of the conditional covariance matrix into two time-varying parts: First, conditional standard deviations matrix and second into correlations matrix (Engle & Sheppard, 2001; Engle, 2002). The DCC-GARCH process can be explained as follows:
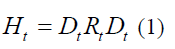
Ht is n × n matrix of conditional variances of mean-corrected n-commodity (ct) at time t. and therefore,
  is a n × n, diagonal matrix of time-varying standard deviations from n univariate GARCH model at time t. Rt is the time-varying conditional correlation matrix of standardized disturbances
 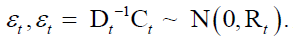 At least two criteria needed to be satisfied while defining the DCC-GARCH process. First, Ht is to be positive definite. Second, elements in Rt should be less than or equal to one.
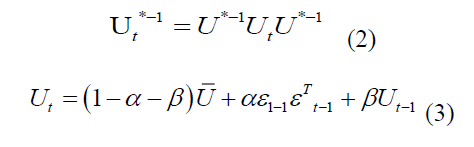
Ut * is a diagonal matrix with the elements consisting of square root of the diagonal elements of Ut Ut * rescales the elements in Ut such that 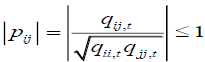
Ut has to be positive definite so that ??t is positive definite. Where 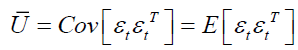 represents the unconditional covariance matrix of (standardised errors) and U can be estimated as
Maximum likelihood estimation is used to estimate the model. The scalar parameters α and β have to meet certain conditions to ensure Ht to be positive definite: first,  and second α + β <1.

The resultant correlation between two series depends on the standardized residuals. When the residuals move in the same direction, they push the correlation up and then with the passage of time and with complete information absorption gradually fall back to the average level. On the other hand when residuals move in opposite directions, it will result in low correlation and again the correlation will move towards the average with the passage of time. The time taken to move to different positions is governed by the parameters α (short run persistence) and β (long-run persistence).
ADCC-GARCH
Capeeiello et al. (2006) suggested the modification of DCC model by adding an asymmetric term to the model, which was termed as ADCC-GARCH (Asymmetric DCC). A positive asymmetric term indicates that negative residuals have more impact on the variance than positive residuals. It is designed to capture the asymmetric effect, i.e., the volatility of any financial asset tends to get affected more during the unexpected fall in asset prices (bad news) than an unexpected increase in asset price (good news). With regard to ADCC the dynamics of Ut can be shown as:
Hedging Ratio and Portfolio Weights
Kroner and Sultan (1993) argue that hedge ratios may be constructed by using the conditional volatility estimates. An asset (x) on which a long-position is taken may be hedged with a second asset (y) by taking a short position. Thus, the hedge ratio between the two assets may be represented as:
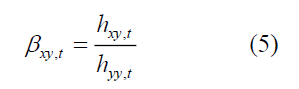
 is the hedge ratio between asset x and y at time t ,
  is the conditional covariance between asset x and y at time is the conditional variance of asset y.
Kroner and Ng (1998) suggest that multivariate GARCH estimates can be used to construct optimal portfolio weights.
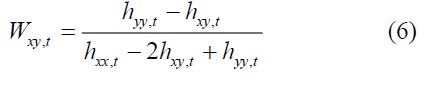
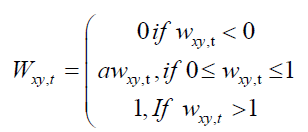
 is the weight of asset xin a one dollar portfolio of y and at time t. is the conditional covariance between asset x and y at time t,
  is the conditional variance of asset y . The weight of asset y at time t is
Data and Preliminary Analysis
Weekly data has been collected from January 2000 to March 2017. Crude oil spot prices have been collected from US Energy Information Administration and are reported in US dollar per barrel. On the other hand, world precious metal prices for gold, silver, platinum, palladium have been collected from Bloomberg data services and are reported in US dollar per troy ounce. Log return series were calculated to take care of the unit root and same were used for the rest of the analysis. Descriptive statistics are shown in Table 1. It can be noted that gold provides highest mean returns followed by silver and palladium provides the least return among the selected series. The initial volatility estimates (standard deviation) suggests palladium returns to be highly volatile followed by crude oil returns. Skewness values are negative for all the return series indicating that most values are distributed to the right and suggests longer tail on the left. Except for silver returns, all other returns are platykurtic indicating shorter and thinner tails. The last four columns of Table 1 show the result for Ljung-Box test and Jarque-Berra test respectively. Ljung Box test indicates the presence of serial correlation of second moments in the case of crude oil, platinum and palladium. Jarque Berra test suggests the non-normal distribution of all the return series. These tests suggest the possibility of using GARCH like models to examine the dynamics between crude oil and precious metals.
| Table 1: Descriptive Statistics | ||||||||
| Mean Return | SD | Skewness | Kurtosis | Ljung-Box test | Jarque-Berra | |||
|---|---|---|---|---|---|---|---|---|
| Chi-squared | p-value | Chisquared | p-value | |||||
| Crude oil | 0.0009 | 0.0428 | -0.43 | 2.29 | 52.266 | 0.0000 | 225.89 | 0.00 |
| Gold | 0.0017 | 0.0244 | -0.22 | 1.77 | 0.1172 | 0.7321 | 125.52 | 0.00 |
| Silver | 0.0014 | 0.0419 | -1.13 | 5.97 | 2.5349 | 0.1114 | 1535.8 | 0.00 |
| Platinum | 0.0009 | 0.0312 | -0.53 | 2.63 | 5.7561 | 0.0164 | 302.69 | 0.00 |
| Palladium | 0.0007 | 0.0472 | -0.26 | 1.79 | 7.626 | 0.0058 | 131.36 | 0.00 |
Note: SD: Standard Deviation; Ljung-Box test: H0: Zero serial correlation of residuals; Jarque- Berra: H0: Series is normally distributed.
Empirical Results
| Table 2: Multivariate Dcc-Garch Parameter Estimates | ||||||||
| DCC | ADCC | |||||||
|---|---|---|---|---|---|---|---|---|
| Parameter | Estimate | Std. Error | t-value | p-value | Estimate | Std. Error | t-value | p-value |
| a | 0.0143 | 0.0023 | 6.2996 | 0.00 | 0.0141 | 0.0026 | 5.4636 | 0.0000 |
| ß | 0.9783 | 0.0034 | 286.77 | 0.00 | 0.9783 | 0.0034 | 285.77 | 0.0000 |
| g | 0.0005 | 0.0033 | 0.1374 | 0.8907 | ||||
| Akaike | -21.725 | -21.727 | ||||||
| Bayes | -21.463 | -21.47 | ||||||
| Shibata | -21.73 | -21.732 | ||||||
| Hannan-Quinn | -21.625 | -21.629 | ||||||
Note: DCC: Dynamic Conditional Correlation, ADCC: Asymmetric DCC.
Table 2 reports DCC and ADCC-GARCH parameter estimates and are significant at 1% level of significance. The low value of α and high value of β indicates the importance of long-run persistence in comparison to short-run persistence. The ADCC parameter estimate (γ) for asymmetric relationship is not statistically significant and suggests that vitality estimates between crude oil and precious metals are no influenced by negative shocks or sharp increase in returns. Therefore, it may be the reason that our results are almost similar in both DCC and ADCC framework. Figures 1 and 2 show the DCC and ADCC between crude oil and precious metals over the sample period respectively. The dynamic correlation between crude oil and precious metals exhibit similar patterns during for several time periods. For example, DCC between crude oil and precious metals show similar patterns during and before the recent 2007- 2008 financial crisis and then from 2011 to first half of 2014. The period from 2011 depicts the impact of the Arab uprising, Libyan unrest and the excess capacity (supply) during 2014-15. On an average, the dynamic correlation between crude oil and precious metals increased on the eve of the financial crisis and started to decrease after the effect of crisis subsided in 2012. It suggests that during such turmoil’s investors can expect high correlation in volatilities and need to adjust their investments in these markets.

Figure 1:Operating Venture Capital Funds (KVCA, 2016)

Figure 2:Asymmetric Dynamic Conditional Correlation Between Crude Oil (Co) And Precious Metals.
Table 3 reports the hedging ratios calculated from the variance and covariance structure obtained from DCC and ADCC-GARCH processes. For example, the average value of hedge ratio between crude oil and gold is 0.24 and for gold and crude oil is 0.12. It indicates that $1 long position in crude oil can be hedged for 24 cents with a short position in gold. Similarly, a $1 long position in gold can be hedged with a short position for 12 cents in crude oil. From the Table 3, it can be noticed the cheapest hedge for a $1 long position in crude oil is a short position in palladium (18 cents). Therefore, most economical way to hedge a 1 position in crude oil is with palladium followed by silver, gold and platinum.
| Table 3: Hedging Ratio Between Crude Oil And Precious Metals | ||||
| DCC | ADCC | |||
|---|---|---|---|---|
| Mean | SD | Mean | SD | |
| CO with Gold | 0.24 | 0.14 | 0.25 | 0.14 |
| CO with Silver | 0.19 | 0.11 | 0.19 | 0.11 |
| CO with Platinum | 0.33 | 0.14 | 0.33 | 0.14 |
| CO with palladium | 0.18 | 0.10 | 0.18 | 0.10 |
| Gold with CO | 0.12 | 0.10 | 0.12 | 0.10 |
| Silver with CO | 0.23 | 0.19 | 0.23 | 0.19 |
| Platinum with CO | 0.20 | 0.12 | 0.21 | 0.12 |
| Palladium with CO | 0.25 | 0.17 | 0.25 | 0.17 |
Note: CO represents crude oil. For example, CO with gold shows that on an average $1 long position in crude oil can be hedged with 24 cents short position in gold. DCC: Dynamic Conditional correlation, ADCC: Asymmetric DCC, SD: Standard Deviation.
Table 4 shows the optimal portfolio weights of two asset portfolios of crude oil with precious metals. For example, the average weight for the crude oil/gold portfolio is 0.27. It indicates that for a $1 portfolio, 27 cents should in invest in crude oil and 73 cents in gold. Portfolio weights suggest that for an optional portfolio between crude oil and precious metals, gold is required in highest proportions followed by platinum, silver and palladium.
| Table 4: Portfolio Weights | ||
| DCC | ADCC | |
|---|---|---|
| Mean SD | Mean SD | |
| CO, Gold | 0.27 0.14 | 0.27 0.14 |
| CO, Silver | 0.51 0.24 | 0.51 0.24 |
| CO, Platinum | 0.35 0.18 | 0.35 0.18 |
| CO, Palladium | 0.59 0.18 | 0.59 0.18 |
Note: CO: Crude Oil, DCC: Dynamic Conditional Correlation, ADCC: Asymmetric DCC, SD: Standard Deviation
The results of this study show that a portfolio of crude oil spot and precious metal spot can be built and precious metals can be used to hedge the investment in crude oil and vice versa. The high correlation between crude oil and precious metals during normal time periods, however, may create confusion to the average investor, but if examined appropriately, could be extremely useful during stressful events. Results also show that investors and oil importing countries can target precious metal other than gold, to hedge the investments in the crude oil market. Similarly, oil importing countries while designing reserve portfolio could also include silver, platinum and palladium rather than relying only on gold.
Conclusion
The objective of this paper was to investigate the dynamic relationship between crude oil and precious metals (gold, silver, platinum and palladium) from January 2000 to March 2017. Linear models usually fail to capture the dynamics between such commodities due to serial correlation and non-normal distribution properties. Therefore, this paper investigates the time-varying relationship between crude oil and precious metals using GARCH framework. This paper relies on DCC-GARCH model to investigate the relationship between crude oil and precious metals and further checks the robustness of the results with ADCC model. The conditional volatilities obtained from both the models (DCC and ADCC) are then used to investigate the hedging ratios and portfolio weights.
The empirical results of DCC and ADCC estimation reveal several interesting findings. First, there is a time varying relationship between crude oil and precious metals. Second, there was a significant increase in correlation between crude oil and precious metals after the crude oil shock and financial crisis (2007-2008). It suggests that volatilities of crude oil and precious metals tend to be highly correlated during the periods of uncertainty. Third, the DCC between crude oil and precious metals indicate that, precious metals tend to behave as a single asset class during the periods of uncertain outcome. Fourth, the asymmetric effect (ADCC) does not seem to work in the case of crude oil and precious metals. It suggests that statistically there is no heterogeneity in the influence of sharp rise and fall in prices of crude oil and precious metals on conditional volatilities. Fourth, the hedging ratios indicate that in contrast to general belief, silver and palladium offer economical hedging option in comparison to gold.
Results have important implications for investors, portfolio managers and policymakers. First, the rising dynamic correlation for extended periods may indicate a recessionary phase. Second, the dynamic correlation of crude oil and any precious metal may also indicate the dynamic correlation of crude oil and other precious metals. Third, including non-linear characteristics while modelling the relationship between commodities may result in superior hedging and portfolio strategies.
References
- Basher, S.A. & Sadorsky, P. (2016). Hedging emerging market stock prices with oil, gold, VIX and bonds: A comparison between DCC, ADCC and GO-GARCH. Energy Economics, 54, 235-247.
- Baur, D.G. & Lucey, B.M. (2010). Is gold a hedge or a safe haven? An analysis of stocks, bonds and gold. Financial Review, 45(2), 217-229.
- Baur, D.G. & McDermott, T.K. (2010). Is gold a safe haven? International evidence. Journal of Banking & Finance, 34(8), 1886-1898.
- Bildirici, M.E. & Turkmen, C. (2015). Nonlinear causality between oil and precious metals. Resources Policy, 46, 202-211.
- Cappiello, L., Engle, R.F. & Sheppard, K. (2006). Asymmetric dynamics in the correlations of global equity and bond returns. Journal of Financial Econometrics, 4(4), 537-572.
- Engle, R. (2002). Dynamic conditional correlation: A simple class of multivariate generalized autoregressive conditional heteroskedasticity models. Journal of Business & Economic Statistics, 20(3), 339-350.
- Engle, R.F. & Sheppard, K. (2001). Theoretical and empirical properties of dynamic conditional correlation multivariate GARCH (No. w8554). National Bureau of Economic Research.
- Ghalanos, A. (2015). The rmgarch models: Background and properties. (Version 1.3-0).
- Jain, A. & Biswal, P. (2016). Dynamic linkages among oil price, gold price, exchange rate and stock market in India. Resources Policy, 49, 179-185.
- Jain, A. & Ghosh, S. (2013). Dynamics of global oil prices, exchange rate and precious metal prices in India. Resources Policy, 38(1), 88-93.
- Kanjilal, K. & Ghosh, S. (2017). Dynamics of crude oil and gold price post 2008 global financial crisis?New evidence from threshold vector error-correction model. Resources Policy, 52, 358-365.
- Kroner, K.F. & Ng, V.K. (1998). Modelling asymmetric comovements of asset returns. The Review of Financial Studies, 11(4), 817-844.
- Kroner, K.F. & Sultan, J. (1993). Time-varying distributions and dynamic hedging with foreign currency futures. Journal of Financial and Quantitative Analysis, 28(4), 535-551.
- Ku, Y.H.H., Chen, H.C. & Chen, K.H. (2007). On the application of the dynamic conditional correlation model in estimating optimal time-varying hedge ratios. Applied Economics Letters, 14(7), 503-509.
- Maghyereh, A.I., Awartani, B. & Tziogkidis, P. (2017). Volatility spillovers and cross-hedging between gold, oil and equities: Evidence from the Gulf Cooperation Council countries. Energy Economics, 68, 440-453.
- Melvin, M. & Sultan, J. (1990). South African political unrest, oil prices and the time varying risk premium in the gold futures market. Journal of Futures Markets, 10(2), 103-111.
- Pindyck, R.S. & Rotemberg, J.J. (1990). The Excess Co-Movement of Commodity Prices. The Economic Journal, 100(403), 1173-1189.
- Sari, R., Hammoudeh, S. & Soytas, U. (2010). Dynamics of oil price, precious metal prices and exchange rate. Energy Economics, 32(2), 351-362.
- Soytas, U., Sari, R., Hammoudeh, S., & Hacihasanoglu, E. (2009). World oil prices, precious metal prices and macroeconomy in Turkey. Energy Policy, 37(12), 5557-5566.
- Tiwari, A.K. & Sahadudheen, I. (2015). Understanding the nexus between oil and gold. Resources Policy, 46, 85-91.