Research Article: 2021 Vol: 24 Issue: 4S
Designing mixed sampling plan based on IPD
V. Jemmy Joyce, Karunya Institute of Technology and Sciences
G. Sheeba Merlin, Karunya Institute of Technology and Sciences
K. Rebecca Jebaseeli Edna, Karunya Institute of Technology and Sciences
S. Fenella, Karunya Institute of Technology and Sciences
Citation: Joyce, V. J., Merlin, G. S., Edna, K. R. J., & Fenella, S. (2021). Designing mixed sampling plan based on IPD. Journal of Management Information and Decision Sciences, 24(S4), 1-6.
Abstract
Acceptance Sampling Plans are used to protect against the irregular degradation of levels of quality, the specifications of the new sampling plan using IPD (MSPIPD), gives a better sample size when compared with average sample number of existing distribution. For an acceptable quality level of 0.95, it is found that the new sampling plan based on IPD, gives a lesser sample size , and hence the inspection cost will be less. Tables are formulated for selection of parameters of the plan. The production process with interference parameter is taken into account, and the mixed sampling plans based on IPD turns out to be superior to the existing plan.
Keywords
Probability of acceptance; Sample size; Acceptable quality level; Intervened poisson distribution; OC curve.
Introduction
In the production process there is a chance of some interference, in such circumstance the suitable probability distribution for number of defectives is demonstrated by IPD, by obtaining an estimated value for interference parameter ’r’ the probability of acceptance can be calculated (Azarudheen & Veerakumari, 2017). The design of a mixed sampling plan in case of a one-sided upper specification u assuming that the standard deviation σ of the considered process characteristic is known, is specified by parameters (n1, n2, m, c, r), where c is assumed to be not equal to zero (Arul & Joyce, 2010).
Mixed sampling plan combining process and product quality characteristics using ZTPD was developed by Arul and Joyce (2010). DevaArul (2002) Suresh and Devaarul (2002a;b) and Suresh and Devaarul (2003) have developed mixed sampling plans by combining process and product control procedures. Azarudheen and Veerakumari (2017); Veerakumari and Azarudheen (2017); Shahabudheen and Veerakumari (2019) formulated sampling plans based on Intervened Poisson distribution. Shanmugam (1985; 2001) derived IPD and studied its medical applications. Radhakrishnan and Sekkizhar (2007) and Sampath Kumar et al. (2012) derived sampling plans based on Intervened random effect Poisson distribution. Kumar and Shibu (2011; 2012) derived modified IPD. Scollnik (2006) derived intervened generalized Poisson distribution.
Importance of MSPIPD Plan
If some intervention is made to the production process with the goal of improving product quality, the mean of the uncommon event p may change. In this case, IPD models the proper probability distribution for the number of defectives in the sample. An advantage of application of IPD based plans is that it provides information on how effective were the preventive measure taken, that is not applicable in poison distribution. When an intervention modifies the production process during sampling inspection MSPIPD plan enables a better sampling plan. The IPD based probability models are frequently utilized in a variety of applications, including reliability analysis, queuing issues, and epidemiological investigations.
Operating Procedure of MSPIPD Plan
Independent MSPIPD pan is derived with parameters 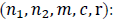 Take a random sample of size n1 from the lot. If the sample average
  then accept the lot. If the sample average
  take a second sample of size n2. If the number of non-conforming items in the second sample is less than or equal to c, then accept the lot, otherwise reject the lot (Arul & Joyce, 2010).
Measures of Independent MSPIPD plan
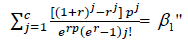
Operating Characteristic function based on the intervened Poisson distribution is given below
The Average Sample Number is given by

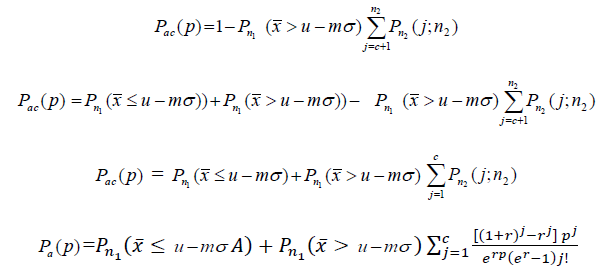
Designing and Selection of the MSPIPD plan for given n1 and a point on the Operating Characteristic Function
Break the probability of acceptance and determine the probability of acceptance that will be assigned to the first stage. Let it be  (Arul & Joyce, 2010).
Compute the acceptable limit as 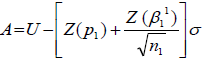
Find  the probability of acceptance assigned to the attribute plan associated with the second stage sample as
  (Arul & Joyce, 2010).
Find the second stage sample of size 2 n from the relation:
The above equations cannot be solved analytically. Hence, the solutions are obtained by search procedure using programming in ‘R’.
Application of MSPIPD plan
Quality control engineers are continually looking for methods to improve product quality in order to increase customer happiness, thus they make improvements to the manufacturing process. Due to high tech technology, in production industry there are technical and scientific interventions. In that case MSPIPD plan may be applicable. Also in agriculture, medicine, food industry the MSPIPD plan can be applied as there are technical and scientific interventions (Table 1 and Table 2).
| Table 1 Values of First Stage Variable Criteria ‘M’ For Given N1= 6, and Second Stage Sample Size n2 for the Plan Based on MSPIPD through AQL 0.95 and r = 0.01 |
||||||
| p | c=1 | c=2 | c=3 | c=4 | c=5 | m |
|---|---|---|---|---|---|---|
| 0.001 | 262 | 990 | 1765 | 2539 | 3314 | 2.978 |
| 0.002 | 131 | 495 | 883 | 1270 | 1657 | 2.761 |
| 0.003 | 87 | 330 | 589 | 847 | 1105 | 2.633 |
| 0.004 | 66 | 248 | 442 | 635 | 829 | 2.538 |
| 0.005 | 53 | 198 | 354 | 508 | 663 | 2.462 |
| 0.006 | 44 | 165 | 295 | 423 | 553 | 2.398 |
| 0.007 | 38 | 141 | 253 | 363 | 474 | 2.343 |
| 0.008 | 33 | 123 | 221 | 318 | 415 | 2.294 |
| 0.009 | 29 | 109 | 196 | 283 | 369 | 2.251 |
| 0.01 | 26 | 98 | 176 | 255 | 332 | 2.212 |
| Table 2 Values of m and n_2 for given AQL , 0.95 based on the Poisson Distribution |
||||||
| p | c=1 | c=2 | c=3 | c=4 | c=5 | m |
|---|---|---|---|---|---|---|
| 0.001 | 619 | 1237 | 1920 | 2651 | 3393 | 2.978 |
| 0.002 | 310 | 619 | 960 | 1326 | 1697 | 2.761 |
| 0.003 | 207 | 413 | 640 | 884 | 1131 | 2.633 |
| 0.004 | 155 | 310 | 480 | 663 | 848 | 2.538 |
| 0.005 | 125 | 248 | 384 | 530 | 678 | 2.462 |
| 0.006 | 104 | 207 | 320 | 442 | 560 | 2.398 |
| 0.007 | 89 | 177 | 274 | 379 | 485 | 2.343 |
| 0.008 | 78 | 155 | 240 | 332 | 424 | 2.294 |
| 0.009 | 69 | 138 | 213 | 295 | 377 | 2.251 |
| 0.01 | 62 | 124 | 192 | 265 | 339 | 2.212 |
Comparison
It is found that mixed sampling plans based on the IPD have better sharpness in the OC curves (Table 3, Figure 1 and Figure 2).
| Table 3 Comparison of Mixed Sampling Plans using Intervened Poisson Distribution |
||||
| P | (MSPIPD) | ASN | Pac(Poisson distribution) | ASN |
|---|---|---|---|---|
| 0.005 | 0.99985094 | 6.0598 | 0.999982169 | 6.1426 |
| 0.01 | 0.998530898 | 6.3016 | 0.999179764 | 6.7192 |
| 0.05 | 0.882333 | 11.8916 | 0.915438114 | 20.0492 |
| 0.07 | 0.767215 | 15.2482 | 0.806823 | 28.0534 |
| 0.09 | 0.648984972 | 18.0666 | 0.68522 | 34.7742 |
| 0.1 | 0.47749 | 23.0508 | 0.519551 | 46.6596 |
| 0.2 | 0.1702609 | 28.1806 | 0.186078 | 58.892 |

Figure 1: Operating Characteristic Curve for MSPIPD Plan and Ordinary Poisson Distribution

Figure 2: ASN of Mixed Sampling Plans Based on The Intervened Poisson Distribution and the Ordinary Poisson Distribution.
It is found that the average sample number (ASN) of mixed sampling plans based on IPD is smaller than the ASN based on the ordinary Poisson distribution.
Illustration Based on Application
Consider the production of high tech automobile manufacturing industry. In order to improve quality, the company is using 1% robots in manufacturing process. Let p1 = 0.01 be the fraction non-conforming corresponding to the AQL and acceptance number c = 2. Determine the parameters of MSPIPD plan with β = 0.9.
Solution
The interference parameter r = 1% = 0.01. Let n1 = 6 be the first stage sample size and  be the first stage probability of acceptance; then from Table 1, n2 = 98 . Hence the parameters are n1 = 6, n2 = 98 , m= 2.212. Take a random sample of size 6. If
 then accept the lot. Otherwise, take a second sample of size 98 and count the number of non-conforming items, let it be‘d’ If d ≤ 2 then accept the lot, otherwise reject the lot.
Conclusion
A good sampling will also protect the producer in the sense that lots produced at permissible levels of quality will have a good chance to be accepted by the plans. This paper provides contributions to MSPIPD plan, various properties of the proposed MSPIPD plans are derived and tables are provided for an easy selection of the plans. It is found that the mixed sampling plans based on IPD turn out to be superior with respect to the average sample number. The application of MSPIPD plan is explained with example.
References
- Arul, S. D., & Joyce, V. J. (2010). Selection of mixed sampling plans for second quality lots. Stochastics and Quality Control, 25(1), 31-42.
- Azarudheen, S., & Veerakumari, K. P. (2017). Designing of Skip lot sampling plan (SkSP-3) with Single Sampling Plan as reference plan under the conditions of Intervened Poisson distribution. Asia Mathematika, 1(1), 23-29.
- Dhanavanthan,P, (2000) Estimation of the parameters of compound intervened Poisson distribution. Biometrical Journal, 42, 315-320
- Jayakumar, K., & Sankaran, K. K. (2019). Exponential intervened Poisson distribution. Communications in Statistics-Theory and Methods, 1-31.
- Kumar, C. S., & Shibu, D. S. (2011). Modified intervened Poisson distribution. Statistica 71, 489-499
- Kumar, C. S., & Shibu, D. S. (2012). An alternative to truncated intervened Poisson distribution. Journal of Statistics and Applications, 5, 131-141.
- PradeepaVeerakumari, K., & Aruna, H. M. (2017). Application of SSP for Determination of Influence over Trade Credit with Payment Choice. International Journal of Pure and Applied Mathematics, 117(13), 193-201.
- Radhakrishnan, R., & Sekkizhar, J. (2007). Construction of sampling plans using intervened random effect Poisson distribution. International Journal, 2(1-2), 88-96.
- Sampath Kumar, R., Vijaya Kumar, R., & Radhakrishnan, R. (2012). Selection of mixed sampling plan through MAPD and IQL using intervened random effect Poisson distribution. International Journal of Engineering Research and Applications, 2(3), 2220-2226.
- Scollnik, D. P. M. (2006). On the intervened generalized Poisson distribution, Communication in Statistics-Theory & Methods, 35, 953-963.
- Shahabudheen, A., & Veerakumari, P. (2019). Selection of Tightened-Normal-Tightened sampling scheme under the implications of intervened Poisson distribution. Pakistan Journal of Statistics and Operation Research, 129-140.
- Shanmugam, R. (1985). An intervened Poisson distribution and its medical application. Biometrics, 41, 1025-1029.
- Shanmugam, R. (2001). Predicting a successful prevention of an epidemic. Communication in Statistics-Theory & Methods, 30(1), 93-103.
- Suresh, K. K., & Devaarul, S. (2002a). Combining Process and Product Control for Reducing Sampling Costs. Economic Quality Control. Journal and Newsletter for Quality and Reliability, 17(2), 187-194.
- Suresh, K. K., & Devaarul, S. (2002b). Designing and selection of mixed sampling plans with chain sampling as attribute plan. Quality Engineering Journal, 15(1), 155-160.
- Suresh, K. K., & Devaarul, S. (2003). Multi-dimensional mixed sampling plans. Quality Engineering Journal, 16(2), 233-237.
- Veerakumari, K. P., & Azarudheen, S. (2017). Evaluation of Single Sampling Plan under the conditions of Intervened Poisson distribution. Communications in statistics-Simulation and Computation, 46(8), 6106-6114.